

Comprehensive molecular characterization of clear cell renal cell carcinoma
- PMID: 23792563
- PMCID: PMC3771322
- DOI: 10.1038/nature12222
Comprehensive molecular characterization of clear cell renal cell carcinoma
Abstract
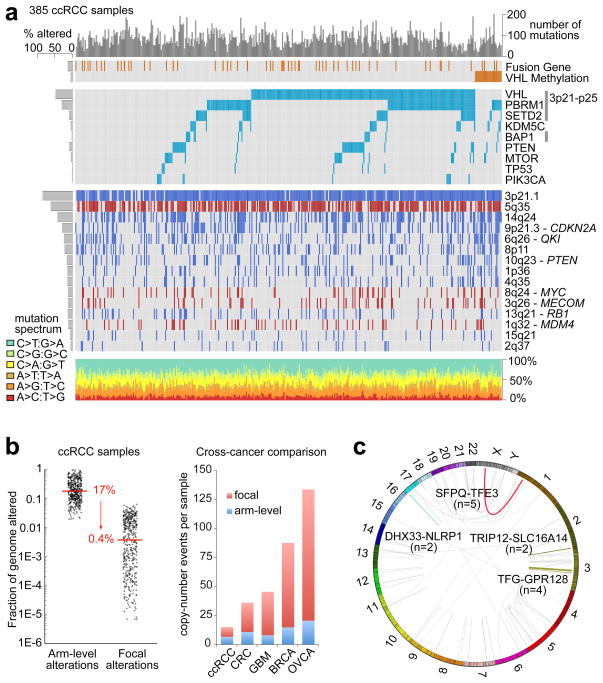
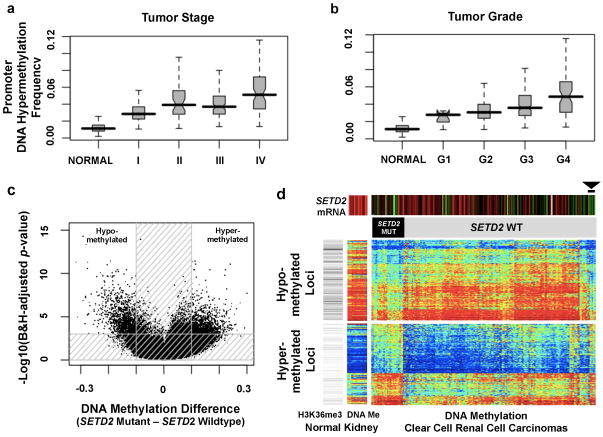
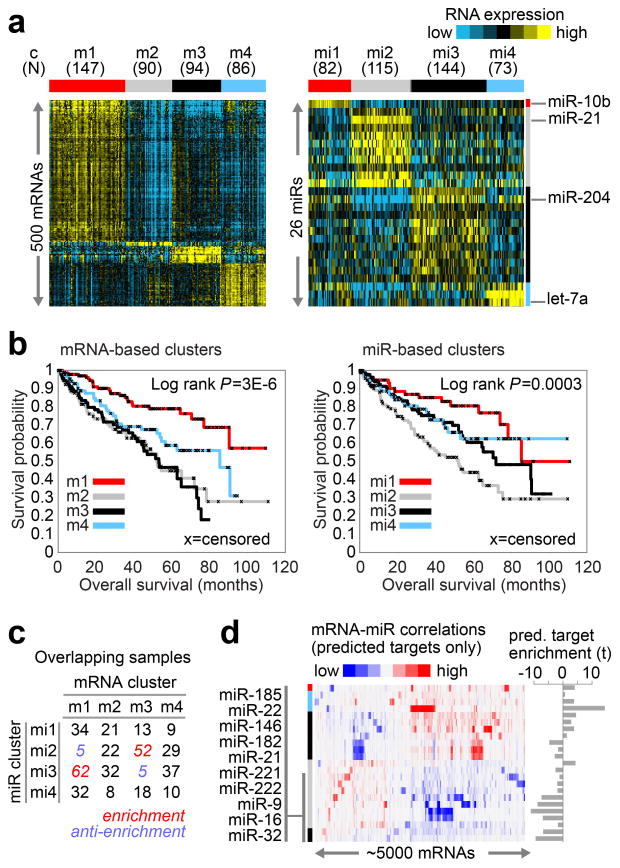
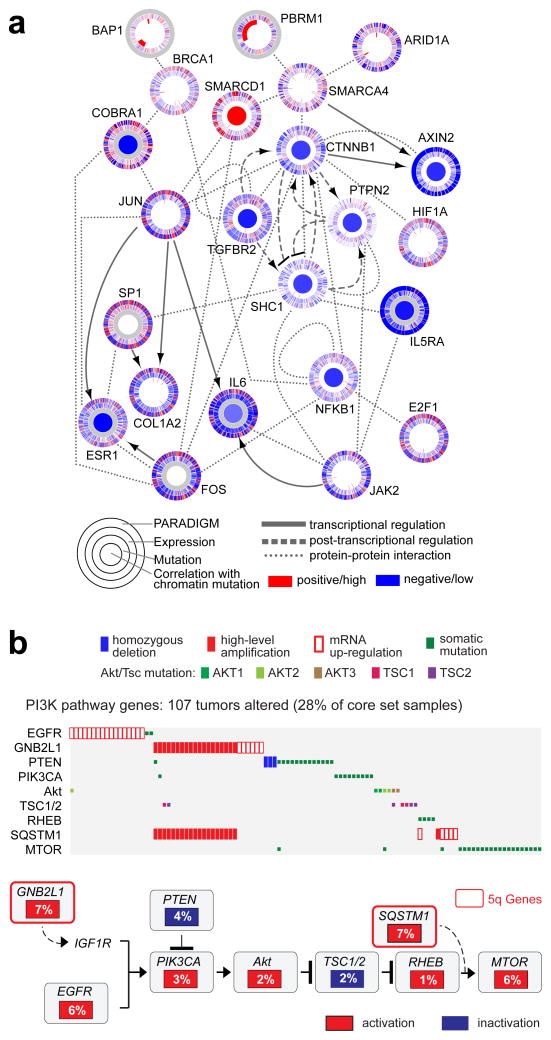
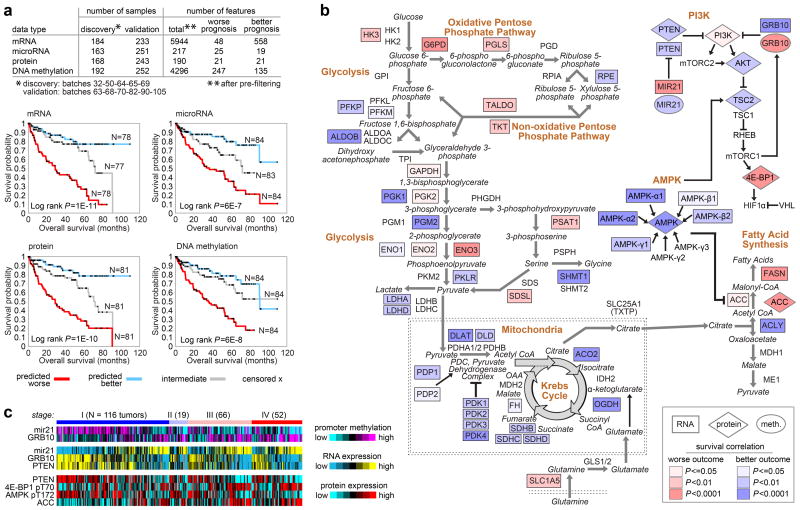
Genetic changes underlying clear cell renal cell carcinoma (ccRCC) include alterations in genes controlling cellular oxygen sensing (for example, VHL) and the maintenance of chromatin states (for example, PBRM1). We surveyed more than 400 tumours using different genomic platforms and identified 19 significantly mutated genes. The PI(3)K/AKT pathway was recurrently mutated, suggesting this pathway as a potential therapeutic target. Widespread DNA hypomethylation was associated with mutation of the H3K36 methyltransferase SETD2, and integrative analysis suggested that mutations involving the SWI/SNF chromatin remodelling complex (PBRM1, ARID1A, SMARCA4) could have far-reaching effects on other pathways. Aggressive cancers demonstrated evidence of a metabolic shift, involving downregulation of genes involved in the TCA cycle, decreased AMPK and PTEN protein levels, upregulation of the pentose phosphate pathway and the glutamine transporter genes, increased acetyl-CoA carboxylase protein, and altered promoter methylation of miR-21 (also known as MIR21) and GRB10. Remodelling cellular metabolism thus constitutes a recurrent pattern in ccRCC that correlates with tumour stage and severity and offers new views on the opportunities for disease treatment.
Figures
Comment in
-
Kidney cancer: creating a molecular atlas of clear cell renal cell carcinoma genetics.Nat Rev Urol. 2013 Sep;10(9):489. doi: 10.1038/nrurol.2013.151. Epub 2013 Jul 9. Nat Rev Urol. 2013. PMID: 23835579 No abstract available.
-
Genetics: a molecular atlas of clear cell renal cell carcinoma.Nat Rev Clin Oncol. 2013 Sep;10(9):485. doi: 10.1038/nrclinonc.2013.122. Epub 2013 Jul 9. Nat Rev Clin Oncol. 2013. PMID: 23836316 No abstract available.
Similar articles
-
MYBL2 promotes proliferation of clear cell renal cell carcinoma by regulating TOP2A and activating AKT/mTOR signaling pathway.FASEB J. 2025 Jan 31;39(2):e70330. doi: 10.1096/fj.202401910R. FASEB J. 2025. PMID: 39831843
-
Differences in mutations across tumour sizes in clear-cell renal cell carcinoma.BJU Int. 2025 Feb;135(2):269-278. doi: 10.1111/bju.16527. Epub 2024 Sep 12. BJU Int. 2025. PMID: 39263870 Free PMC article.
-
Deciphering potential molecular mechanisms in clear cell renal cell carcinoma based on the ubiquitin-conjugating enzyme E2 related genes: Identifying UBE2C correlates to infiltration of regulatory T cells.Biofactors. 2025 Jan-Feb;51(1):e2143. doi: 10.1002/biof.2143. Epub 2024 Nov 29. Biofactors. 2025. PMID: 39614426
-
Impact of residual disease as a prognostic factor for survival in women with advanced epithelial ovarian cancer after primary surgery.Cochrane Database Syst Rev. 2022 Sep 26;9(9):CD015048. doi: 10.1002/14651858.CD015048.pub2. Cochrane Database Syst Rev. 2022. PMID: 36161421 Free PMC article. Review.
-
Depressing time: Waiting, melancholia, and the psychoanalytic practice of care.In: Kirtsoglou E, Simpson B, editors. The Time of Anthropology: Studies of Contemporary Chronopolitics. Abingdon: Routledge; 2020. Chapter 5. In: Kirtsoglou E, Simpson B, editors. The Time of Anthropology: Studies of Contemporary Chronopolitics. Abingdon: Routledge; 2020. Chapter 5. PMID: 36137063 Free Books & Documents. Review.
Cited by
-
Tumor and immune reprogramming during immunotherapy in advanced renal cell carcinoma.Cancer Cell. 2021 May 10;39(5):649-661.e5. doi: 10.1016/j.ccell.2021.02.015. Epub 2021 Mar 11. Cancer Cell. 2021. PMID: 33711272 Free PMC article.
-
Metabolic reprogramming in renal cancer: Events of a metabolic disease.Biochim Biophys Acta Rev Cancer. 2021 Aug;1876(1):188559. doi: 10.1016/j.bbcan.2021.188559. Epub 2021 May 6. Biochim Biophys Acta Rev Cancer. 2021. PMID: 33965513 Free PMC article. Review.
-
Subgroup-Independent Mapping of Renal Cell Carcinoma-Machine Learning Reveals Prognostic Mitochondrial Gene Signature Beyond Histopathologic Boundaries.Front Oncol. 2021 Mar 15;11:621278. doi: 10.3389/fonc.2021.621278. eCollection 2021. Front Oncol. 2021. PMID: 33791209 Free PMC article.
-
Metastatic Renal Cell Carcinoma Management: From Molecular Mechanism to Clinical Practice.Front Oncol. 2021 Apr 22;11:657639. doi: 10.3389/fonc.2021.657639. eCollection 2021. Front Oncol. 2021. PMID: 33968762 Free PMC article. Review.
-
A 25 year perspective on the evolution and advances in an understanding of the biology, evaluation and treatment of kidney cancer.Urol Oncol. 2021 Sep;39(9):548-560. doi: 10.1016/j.urolonc.2021.04.038. Epub 2021 Jun 4. Urol Oncol. 2021. PMID: 34092483 Free PMC article. Review.
References
-
- Eder AM, et al. Atypical PKCiota contributes to poor prognosis through loss of apical-basal polarity and cyclin E overexpression in ovarian cancer. Proceedings of the National Academy of Sciences of the United States of America. 2005;102:12519–12524. doi: 10.1073/pnas.0505641102. - DOI - PMC - PubMed
MeSH terms
Substances
Grants and funding
- U24 CA143882/CA/NCI NIH HHS/United States
- U24 CA143866/CA/NCI NIH HHS/United States
- U54 HG003273/HG/NHGRI NIH HHS/United States
- R01 HG005690/HG/NHGRI NIH HHS/United States
- U24 CA143840/CA/NCI NIH HHS/United States
- U24 CA143843/CA/NCI NIH HHS/United States
- T32 CA071341/CA/NCI NIH HHS/United States
- U24 CA143858/CA/NCI NIH HHS/United States
- U24 CA143848/CA/NCI NIH HHS/United States
- U54 HG003079/HG/NHGRI NIH HHS/United States
- T32 CA082088/CA/NCI NIH HHS/United States
- U24 CA143883/CA/NCI NIH HHS/United States
- U24 CA143867/CA/NCI NIH HHS/United States
- UL1 TR000005/TR/NCATS NIH HHS/United States
- P30 CA016672/CA/NCI NIH HHS/United States
- U54 HG003067/HG/NHGRI NIH HHS/United States
- R01 CA068490/CA/NCI NIH HHS/United States
- K24 CA172355/CA/NCI NIH HHS/United States
- U24 CA143835/CA/NCI NIH HHS/United States
- U24 CA143845/CA/NCI NIH HHS/United States
- U24 CA143799/CA/NCI NIH HHS/United States
- P30 CA008748/CA/NCI NIH HHS/United States
- U24 CA144025/CA/NCI NIH HHS/United States
LinkOut - more resources
Full Text Sources
Other Literature Sources
Molecular Biology Databases
Research Materials
Miscellaneous
