FDA-approved selective estrogen receptor modulators inhibit Ebola virus infection
- PMID: 23785035
- PMCID: PMC3955358
- DOI: 10.1126/scitranslmed.3005471
FDA-approved selective estrogen receptor modulators inhibit Ebola virus infection
Abstract
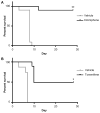
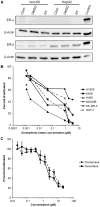
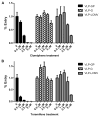
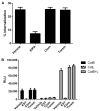
Ebola viruses remain a substantial threat to both civilian and military populations as bioweapons, during sporadic outbreaks, and from the possibility of accidental importation from endemic regions by infected individuals. Currently, no approved therapeutics exist to treat or prevent infection by Ebola viruses. Therefore, we performed an in vitro screen of Food and Drug Administration (FDA)- and ex-US-approved drugs and selected molecular probes to identify drugs with antiviral activity against the type species Zaire ebolavirus (EBOV). From this screen, we identified a set of selective estrogen receptor modulators (SERMs), including clomiphene and toremifene, which act as potent inhibitors of EBOV infection. Anti-EBOV activity was confirmed for both of these SERMs in an in vivo mouse infection model. This anti-EBOV activity occurred even in the absence of detectable estrogen receptor expression, and both SERMs inhibited virus entry after internalization, suggesting that clomiphene and toremifene are not working through classical pathways associated with the estrogen receptor. Instead, the response appeared to be an off-target effect where the compounds interfere with a step late in viral entry and likely affect the triggering of fusion. These data support the screening of readily available approved drugs to identify therapeutics for the Ebola viruses and other infectious diseases. The SERM compounds described in this report are an immediately actionable class of approved drugs that can be repurposed for treatment of filovirus infections.
Conflict of interest statement
Figures


Similar articles
-
Clomiphene and Its Isomers Block Ebola Virus Particle Entry and Infection with Similar Potency: Potential Therapeutic Implications.Viruses. 2016 Aug 2;8(8):206. doi: 10.3390/v8080206. Viruses. 2016. PMID: 27490565 Free PMC article.
-
Arbidol and Other Low-Molecular-Weight Drugs That Inhibit Lassa and Ebola Viruses.J Virol. 2019 Apr 3;93(8):e02185-18. doi: 10.1128/JVI.02185-18. Print 2019 Apr 15. J Virol. 2019. PMID: 30700611 Free PMC article.
-
Selective inhibition of Ebola entry with selective estrogen receptor modulators by disrupting the endolysosomal calcium.Sci Rep. 2017 Jan 24;7:41226. doi: 10.1038/srep41226. Sci Rep. 2017. PMID: 28117364 Free PMC article.
-
Small molecule inhibitors of ebola virus infection.Drug Discov Today. 2015 Feb;20(2):277-86. doi: 10.1016/j.drudis.2014.12.010. Epub 2014 Dec 19. Drug Discov Today. 2015. PMID: 25532798 Review.
-
Review: Insights on Current FDA-Approved Monoclonal Antibodies Against Ebola Virus Infection.Front Immunol. 2021 Aug 30;12:721328. doi: 10.3389/fimmu.2021.721328. eCollection 2021. Front Immunol. 2021. PMID: 34526994 Free PMC article. Review.
Cited by
-
Retrospective Analysis of the Effect of Postmenopausal Women Medications on SARS-CoV-2 Infection Progression.Life (Basel). 2024 Sep 3;14(9):1107. doi: 10.3390/life14091107. Life (Basel). 2024. PMID: 39337891 Free PMC article.
-
Antiviral Activity of Selective Estrogen Receptor Modulators against Severe Fever with Thrombocytopenia Syndrome Virus In Vitro and In Vivo.Viruses. 2024 Aug 20;16(8):1332. doi: 10.3390/v16081332. Viruses. 2024. PMID: 39205306 Free PMC article.
-
Two-way pharmacodynamic modeling of drug combinations and its application to pairs of repurposed Ebola and SARS-CoV-2 agents.Antimicrob Agents Chemother. 2024 Apr 3;68(4):e0101523. doi: 10.1128/aac.01015-23. Epub 2024 Mar 12. Antimicrob Agents Chemother. 2024. PMID: 38470112 Free PMC article.
-
Drug Repurposing in the Chemotherapy of Infectious Diseases.Molecules. 2024 Jan 29;29(3):635. doi: 10.3390/molecules29030635. Molecules. 2024. PMID: 38338378 Free PMC article. Review.
-
Tubeimosides are pan-coronavirus and filovirus inhibitors that can block their fusion protein binding to Niemann-Pick C1.Nat Commun. 2024 Jan 2;15(1):162. doi: 10.1038/s41467-023-44504-4. Nat Commun. 2024. PMID: 38167417 Free PMC article.
References
-
- Geisbert TW, Hensley LE. Ebola virus: New insights into disease aetiopathology and possible therapeutic interventions. Expert Rev Mol Med. 2004;6:1–24. - PubMed
-
- Mahanty S, Bray M. Pathogenesis of filoviral haemorrhagic fevers. Lancet Infect Dis. 2004;4:487–498. - PubMed
-
- Alibek K. The Soviet Union’s anti-agricultural biological weapons. Ann N Y Acad Sci. 1999;894:18–19. - PubMed
-
- Towner JS, Paragas J, Dover JE, Gupta M, Goldsmith CS, Huggins JW, Nichol ST. Generation of eGFP expressing recombinant Zaire Ebolavirus for analysis of early pathogenesis events and high-throughput antiviral drug screening. Virology. 2005;332:20–27. - PubMed
-
- Shelly W, Draper MW, Krishnan V, Wong M, Jaffe RB. Selective estrogen receptor modulators: An update on recent clinical findings. Obstet Gynecol Surv. 2008;63:163–181. - PubMed
Publication types
MeSH terms
Substances
Grants and funding
LinkOut - more resources
Full Text Sources
Other Literature Sources
Medical

