Carbachol-induced MUC17 endocytosis is concomitant with NHE3 internalization and CFTR membrane recruitment in enterocytes
- PMID: 23784542
- PMCID: PMC3891215
- DOI: 10.1152/ajpcell.00141.2013
Carbachol-induced MUC17 endocytosis is concomitant with NHE3 internalization and CFTR membrane recruitment in enterocytes
Abstract
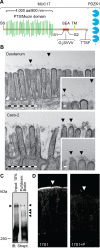
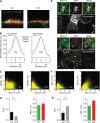
We have reported that transmembrane mucin MUC17 binds PDZ protein PDZK1, which retains MUC17 apically in enterocytes. MUC17 and transmembrane mucins MUC3 and MUC12 are suggested to build the enterocyte apical glycocalyx. Carbachol (CCh) stimulation of the small intestine results in gel-forming mucin secretion from goblet cells, something that requires adjacent enterocytes to secrete chloride and bicarbonate for proper mucin formation. Surface labeling and confocal imaging demonstrated that apically expressed MUC17 in Caco-2 cells and Muc3(17) in murine enterocytes were endocytosed upon stimulation with CCh. Relocation of MUC17 in response to CCh was specific as MUC3 and MUC12 did not relocate following CCh stimulation. MUC17 colocalized with PDZK1 under basal conditions, while MUC17 relocated to the terminal web and into early endosomes after CCh stimulation. CCh stimulation concomitantly internalized the Na(+/)H(+) exchanger 3 (NHE3) and recruited cystic fibrosis transmembrane conductance regulator (CFTR) to the apical membranes, a process that was important for CFTR-mediated bicarbonate secretion necessary for proper gel-forming mucin unfolding. The reason for the specific internalization of MUC17 is not understood, but it could limit the diffusion barrier for ion secretion caused by the apical enterocyte glycocalyx or alternatively act to sample luminal bacteria. Our results reveal well-orchestrated mucus secretion and trafficking of ion channels and the MUC17 mucin.
Keywords: CFTR; MUC17; Muc3(17), PDZK1; NHE3.
Figures


Similar articles
-
The mucus and mucins of the goblet cells and enterocytes provide the first defense line of the gastrointestinal tract and interact with the immune system.Immunol Rev. 2014 Jul;260(1):8-20. doi: 10.1111/imr.12182. Immunol Rev. 2014. PMID: 24942678 Free PMC article. Review.
-
Physiological relevance of cell-specific distribution patterns of CFTR, NKCC1, NBCe1, and NHE3 along the crypt-villus axis in the intestine.Am J Physiol Gastrointest Liver Physiol. 2011 Jan;300(1):G82-98. doi: 10.1152/ajpgi.00245.2010. Epub 2010 Oct 28. Am J Physiol Gastrointest Liver Physiol. 2011. PMID: 21030607 Free PMC article.
-
The C-terminus of the transmembrane mucin MUC17 binds to the scaffold protein PDZK1 that stably localizes it to the enterocyte apical membrane in the small intestine.Biochem J. 2008 Mar 1;410(2):283-9. doi: 10.1042/BJ20071068. Biochem J. 2008. PMID: 17990980
-
CFTR anion channel modulates expression of human transmembrane mucin MUC3 through the PDZ protein GOPC.J Cell Sci. 2011 Sep 15;124(Pt 18):3074-83. doi: 10.1242/jcs.076943. Epub 2011 Aug 18. J Cell Sci. 2011. PMID: 21852426
-
CFTR-NHERF2-LPA₂ Complex in the Airway and Gut Epithelia.Int J Mol Sci. 2017 Sep 4;18(9):1896. doi: 10.3390/ijms18091896. Int J Mol Sci. 2017. PMID: 28869532 Free PMC article. Review.
Cited by
-
The mucus and mucins of the goblet cells and enterocytes provide the first defense line of the gastrointestinal tract and interact with the immune system.Immunol Rev. 2014 Jul;260(1):8-20. doi: 10.1111/imr.12182. Immunol Rev. 2014. PMID: 24942678 Free PMC article. Review.
-
Mucins and the Microbiome.Annu Rev Biochem. 2020 Jun 20;89:769-793. doi: 10.1146/annurev-biochem-011520-105053. Epub 2020 Apr 3. Annu Rev Biochem. 2020. PMID: 32243763 Free PMC article. Review.
-
The human transmembrane mucin MUC17 responds to TNFα by increased presentation at the plasma membrane.Biochem J. 2019 Aug 22;476(16):2281-2295. doi: 10.1042/BCJ20190180. Biochem J. 2019. PMID: 31387973 Free PMC article.
-
Immunological aspects of intestinal mucus and mucins.Nat Rev Immunol. 2016 Oct;16(10):639-49. doi: 10.1038/nri.2016.88. Epub 2016 Aug 8. Nat Rev Immunol. 2016. PMID: 27498766 Free PMC article. Review.
-
Membrane mucins of the intestine at a glance.J Cell Sci. 2020 Mar 13;133(5):jcs240929. doi: 10.1242/jcs.240929. J Cell Sci. 2020. PMID: 32169835 Free PMC article. Review.
References
-
- Axelsson MA, Karlsson NG, Steel DM, Ouwendijk J, Nilsson T, Hansson GC. Neutralization of pH in the Golgi apparatus causes redistribution of glycosyltransferases and changes in the O-glycosylation of mucins. Glycobiology 11: 633–644, 2001 - PubMed
-
- Barlow AL, MacLeod A, Noppen S, Sanderson J, Guérin CJ. Colocalization analysis in fluorescence micrographs: verification of a more accurate calculation of Pearson's correlation coefficient. Microsc Microanal 16: 710–724, 2010 - PubMed
-
- Bustamante C, Marko JF, Siggia ED, Smith S. Entropic elasticity of lambda-phage DNA. Science 265: 1599–1600, 1994 - PubMed
-
- Carlstedt I, Herrmann A, Karlsson H, Sheehan J, Fransson LA, Hansson GC. Characterization of two different glycosylated domains from the insoluble mucin complex of rat small intestine. J Biol Chem 268: 18771–18781, 1993 - PubMed
Publication types
MeSH terms
Substances
Grants and funding
LinkOut - more resources
Full Text Sources
Other Literature Sources
Molecular Biology Databases
Research Materials
Miscellaneous

