. 2013 Jun 13;4(6):e668.
doi: 10.1038/cddis.2013.184.

miR-29 targets Akt3 to reduce proliferation and facilitate differentiation of myoblasts in skeletal muscle development

Affiliations

miR-29 targets Akt3 to reduce proliferation and facilitate differentiation of myoblasts in skeletal muscle development

W Wei et al. Cell Death Dis. .

Abstract

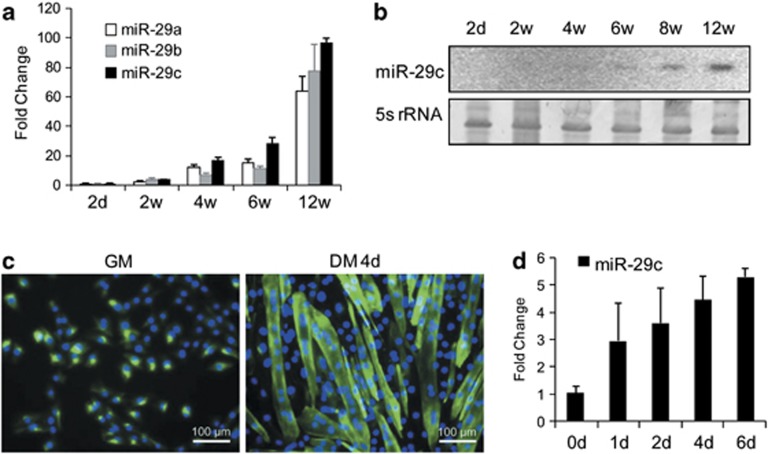
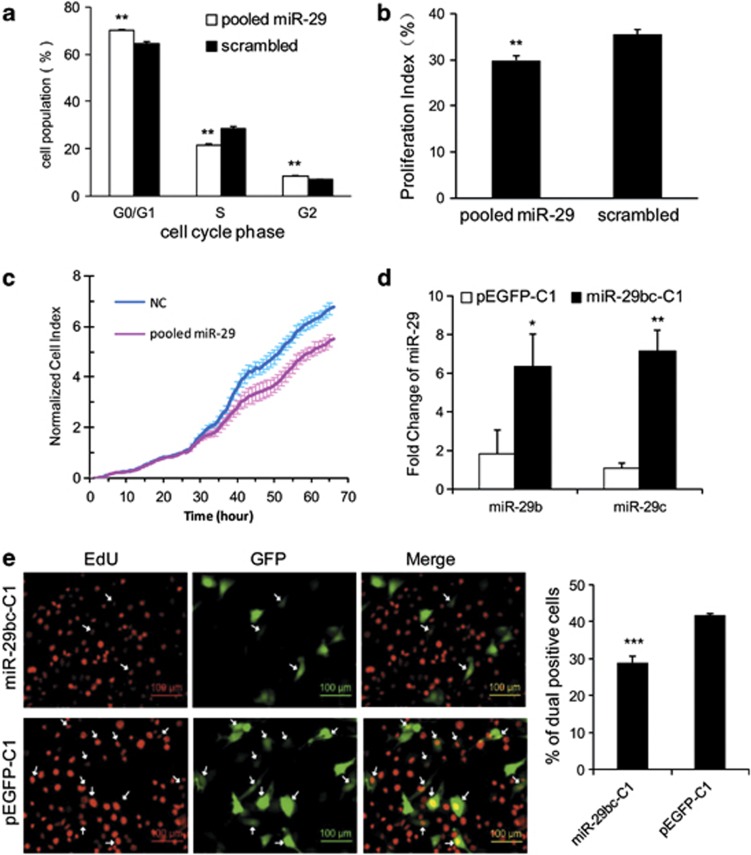
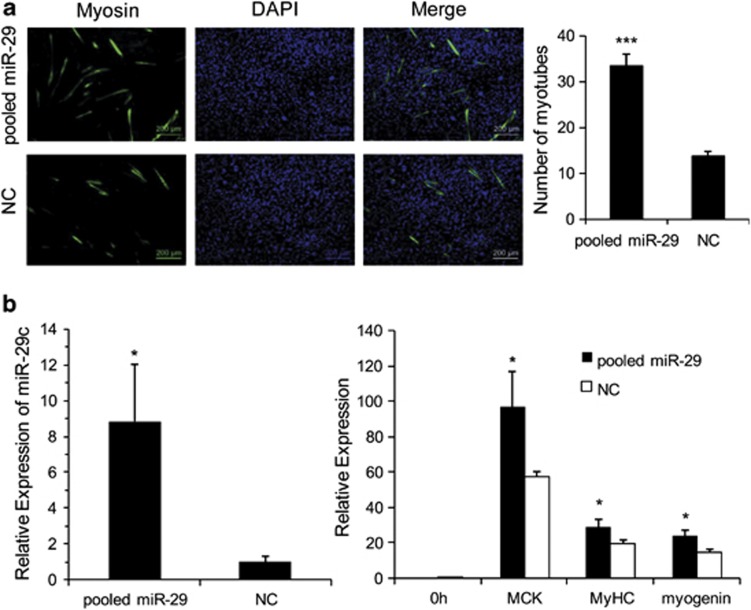
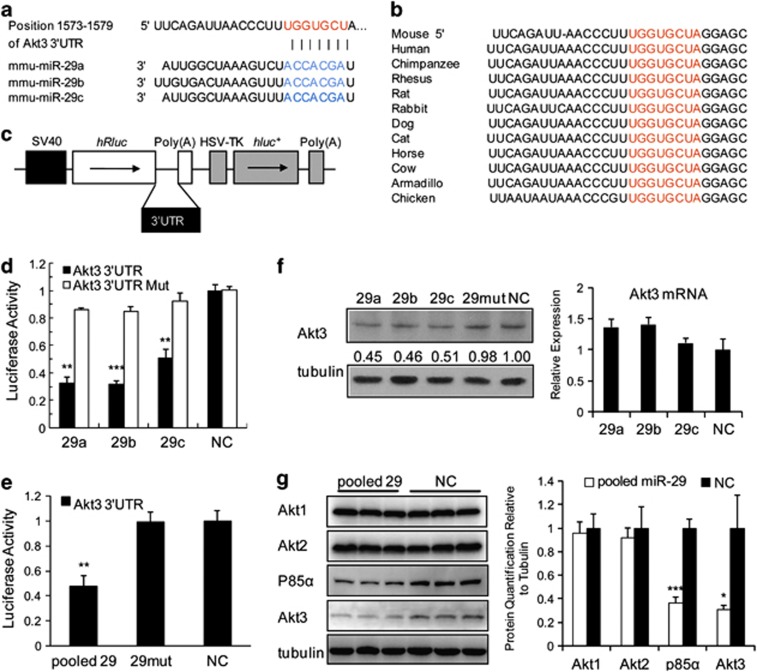
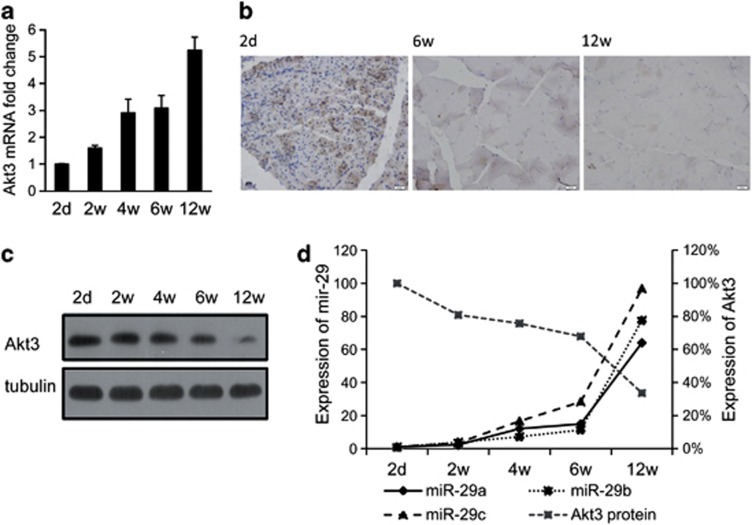
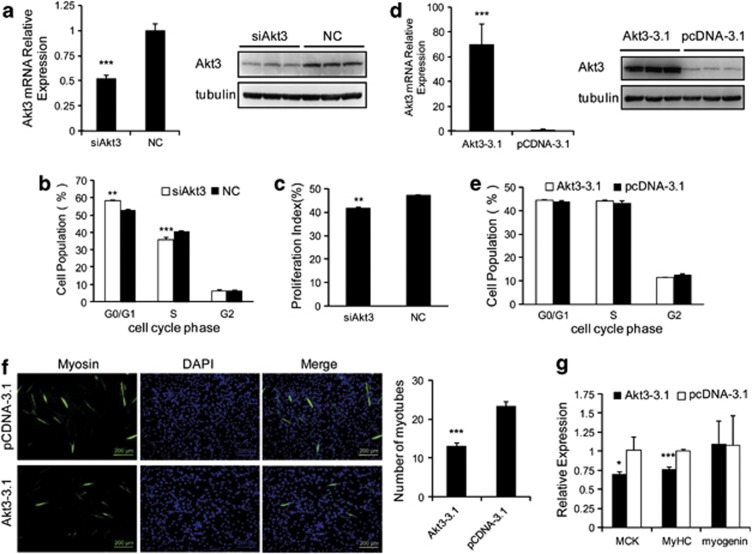
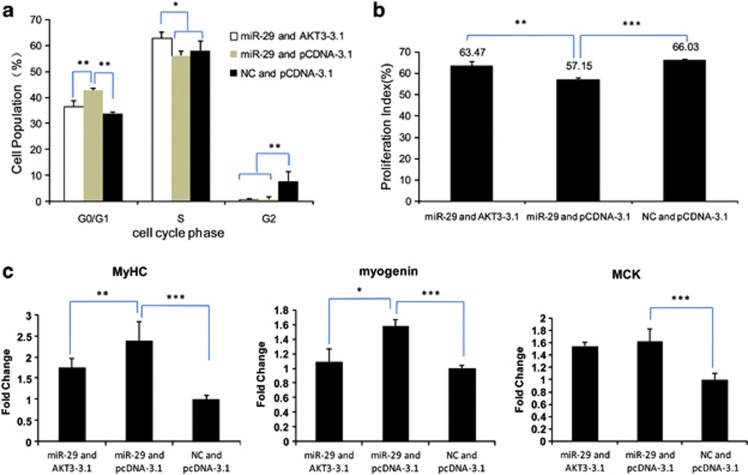
MicroRNAs (miRNAs) are a type of endogenous noncoding small RNAs involved in the regulation of multiple biological processes. Recently, miR-29 was found to participate in myogenesis. However, the underlying mechanisms by which miR-29 promotes myogenesis have not been identified. We found here that miR-29 was significantly upregulated with age in postnatal mouse skeletal muscle and during muscle differentiation. Overexpression of miR-29 inhibited mouse C2C12 myoblast proliferation and promoted myotube formation. miR-29 specifically targeted Akt3, a member of the serine/threonine protein kinase family responsive to growth factor cell signaling, to result in its post-transcriptional downregulation. Furthermore, knockdown of Akt3 by siRNA significantly inhibited the proliferation of C2C12 cells, and conversely, overexpression of Akt3 suppressed their differentiation. Collectively and given the inverse endogenous expression pattern of rising miR-29 levels and decreasing Akt3 protein levels with age in mouse skeletal muscle, we propose a novel mechanism in which miR-29 modulates growth and promotes differentiation of skeletal muscle through the post-transcriptional downregulation of Akt3.


Figures

Figure 1
Figure 1
Upregulation of miR-29 in mouse skeletal muscle with age. (a) Expression of miR-29 in the hindleg muscles of postnatal Balb/c mice was determined by Q-PCR. The ages of the mice were 2 days, 2 weeks, 4 weeks, 6 weeks, and 12 weeks. Fold change was in relation to expression in 2-day-old mice. (b) Northern blotting analysis of miR-29 in thigh muscles from postnatal Balb/c mice. 5s rRNA was used as the reference gene. (c) Immunofluorescence detection of fast skeletal myosin (Alexa Fluor 488 dye, green) in C2C12 myoblasts (GM) and myotubes at 4 days of differentiation (DM 4d). Cell nuclei were positive for DAPI (blue). Scale bar=100 μm. (d) miR-29c expression in C2C12 cells differentiated for 0, 1, 2, 4, and 6 days. Fold change in relation to expression on 0 day. Expression of miR-29 was normalized to U6 and is presented as mean±S.E.M. (from three independent individuals or replicates per time point)
Figure 2
Figure 2
miR-29 repressed proliferation of C2C12 cells. C2C12 cells were transiently transfected with pooled miR-29a/b/c mimics or scrambled NC, and the cell cycle phase (a) and proliferation index (b) were analyzed by propidium iodine flow cytometry. (c) C2C12 cells were transfected with pooled miR-29 mimics or NC upon the cell index reaching 1.0, and cell growth dynamics were continuously monitored using the xCELLigence system. (d) miR-29bc-C1 or pEGFP-C1 plasmids were transfected into C2C12 myoblasts and 24 h later, the cells were processed for Q-PCR detection of miR-29 b/c. Expression of miR-29c was normalized by U6. (e) After transfection with miR-29bc-C1 or pEGFP-C1, C2C12 cells were stained with EdU. Cells dual positive for EdU and GFP are indicated by white arrows (left graph), and the percentage of dual positive cells was determined by flow cytometry (right graph). The scale bar stands for 100 μm. The results are presented as mean±S.E.M. (three independent replicates per group). *P<0.05; **P<0.01; ***P<0.001
Figure 3
Figure 3
Promotion of C2C12 cell differentiation by miR-29. (a) C2C12 myoblasts transfected with pooled miR-29 mimics or NC were differentiated for 3 days. Immunofluorescence detection with fast myosin antibody was used to identify myotubes (green). The nuclei were stained blue with DAPI. The scale bar stands for 200 μm. The number of myotubes is presented as mean±S.E.M. (14 random fields were captured for each treatment group). (b) C2C12 myoblasts transfected with pooled miR-29 mimics or NC were induced to undergo differentiation for 48 h. Subsequent detection of miR-29c, myogenin, MyHC IId, and MCK was determined by Q-PCR. The results are presented as mean±S.E.M. (three independent replicates per group). *P<0.05; ***P<0.001
Figure 4
Figure 4
Akt3 3′ UTR as a target of miR-29. The predicted binding site of miR-29 in the 3′ UTR of Akt3 (a) is highly conserved among vertebrates (b). The Akt3 3′ UTR was inserted into the dual-luciferase reporter vector psi-CHECK2 at the 3′ end of the Renilla luciferase gene (hRluc). The constitutive firefly luciferase (hluc+) expression was used as an internal normalization control (c). The Akt3 3′ UTR or Akt3 3′ UTR Mut (containing a 2-base substitution in the binding site for miR-29) construct was co-transfected with miR-29a, miR-29b, miR-29c, or NC, as indicated, into BHK-21 cells, and normalized Renilla luciferase activity was determined (d). Pooled miR-29 mimics, miR-29 mut (housing a 2-base mutation), or NC was co-transfected with the Akt3 3′ UTR dual-luciferase vector, as indicated, into BHK-21 cells, and normalized Renilla luciferase activity was assayed (e). Akt3 protein expression in C2C12 myoblasts was detected at 48 h post transfection with miR-29a/b/c, miR-29 mut, or NC. Comparable tubulin levels served as loading controls in all western blotting assays (f). (g) Protein detection of members of the Akt3 family and p85a in C2C12 myoblasts transfected with pooled miR-29a/b/c and NC. Results are presented as mean±S.E.M. (three independent replicates per group). *P<0.05; **P<0.01; ***P<0.001
Figure 5
Figure 5
Inverse in vivo expression relationship between miR-29 and Akt3. Rising mRNA expression of Akt3 in thigh muscles of postnatal Balb/c mice of ages 2 days, 2 weeks, 4 weeks, 6 weeks, and 12 weeks (a). Akt3 expression was normalized to tubulin expression. Reduction in Akt3 protein expression in thigh muscles of Balb/c mice with increasing age. Immunohistochemical detection of Akt3 protein in Balb/c thigh muscles of different ages (b). Scale bar=20 μm. Inverse relationship with age between endogenous miR-29a/b/c and Akt3 protein expression in postnatal mouse muscles (c). Relative expression of Akt3 was normalized to tubulin levels. Expression of miR-29 was normalized to U6 levels (d). The results are presented as mean±S.E.M. (three independent individuals per group)
Figure 6
Figure 6
Akt3 inhibited differentiation and promoted proliferation of C2C12 cells. Transfection of siAkt3 into C2C12 myoblasts knocked down the expression of Akt3 mRNA (left) and protein (right), detected by Q-PCR and western blotting (a), which resulted in raised cell population in the G0/G1 phase and in reduced cell population in the S phase (b), and overall reduction in cell proliferation (c) as determined by flow cytometry. Overexpression of Akt3 via transfection of Akt3-3.1 expression vector into C2C12 myoblasts was detected as raised Akt3 mRNA (left) and protein (right) levels (d). Overexpression of Akt3 in C2C12 myoblasts had no appreciable effect on cell interphase cycle (G0/G1, S, and G2), as determined by flow cytometry (e). Immunofluorescence detection of fast skeletal myosin (green myotubes) in Akt3 expression plasmid-transfected C2C12 cells after 3 days of differentiation (f). Nuclei were stained blue with DAPI. Scale bar=200 μm. Number of myotubes graphically presented as mean±S.E.M. (right). A minimum of nine random fields were captured per group and numerically quantified. C2C12 myoblasts transfected with Akt3-3.1 or pcDNA-3.1 were induced to undergo differentiation for 48 h. Subsequent RNA detection of myogenin, MyHC IId, and MCK was determined by Q-PCR, normalized to tubulin expression (g). All the Q-PCR and flow cytometry results are presented as mean±S.E.M. (three independent replicates per group). *P<0.05; **P<0.01; ***P<0.001
Figure 7
Figure 7
Akt3 overexpression could overcome the cell cycle and differentiation effects of miR-29 in C2C12 cells. C2C12 myoblasts were transiently co-transfected with pooled miR-29 and Akt3 expression vector without the 3′ UTR miR-29 recognition site (Akt3-3.1), miR-29 and pCDNA-3.1, or NC and pCDNA-3.1 as control, followed by 3 days of differentiation. The cell cycle phase (a) and proliferation index (b) were analyzed by propidium iodine flow cytometry. RNA expression of myogenin, MyHC IId, and MCK from corresponding transfections was quantified by Q-PCR (c). Fold change calculation was with reference to control transfection (NC and pCDNA-3.1). The results are presented as mean±S.E.M. (three independent replicates per group). *P<0.05; **P<0.01; ***P<0.001

Similar articles

Cited by

References

    1. Hutvagner G, Zamore PD. A microRNA in a multiple-turnover RNAi enzyme complex. Science. 2002;297:2056–2060. - PubMed
    1. Bartel DP. MicroRNAs: genomics, biogenesis, mechanism, and function. Cell. 2004;116:281–297. - PubMed
    1. Kloosterman WP, Plasterk RH. The diverse functions of microRNAs in animal development and disease. Dev Cell. 2006;11:441–450. - PubMed
    1. Ambros V. The functions of animal microRNAs. Nature. 2004;431:350–355. - PubMed
    1. Yoon AR, Gao R, Kaul Z, Choi IK, Ryu J, Noble JR, et al. MicroRNA-296 is enriched in cancer cells and downregulates p21WAF1 mRNA expression via interaction with its 3' untranslated region. Nucleic Acids Res. 2011;39:8078–8091. - PMC - PubMed

Publication types

MeSH terms

LinkOut - more resources