

Identification of class I HLA T cell control epitopes for West Nile virus
- PMID: 23762485
- PMCID: PMC3677933
- DOI: 10.1371/journal.pone.0066298
Identification of class I HLA T cell control epitopes for West Nile virus
Abstract
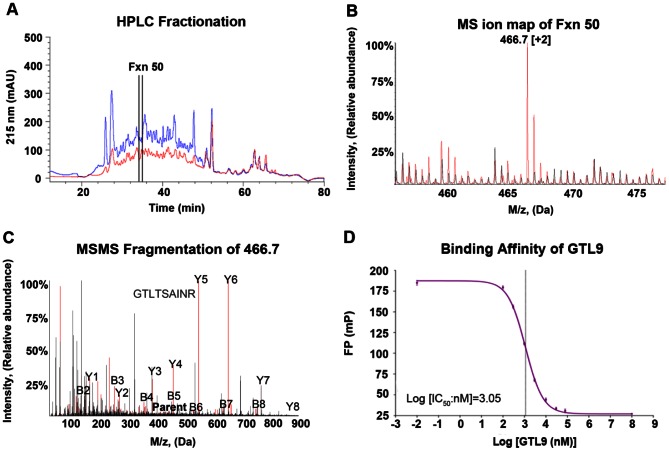
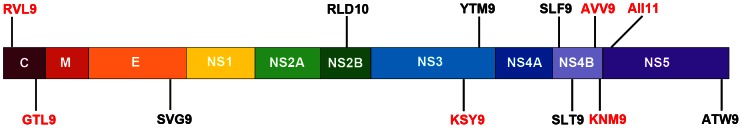
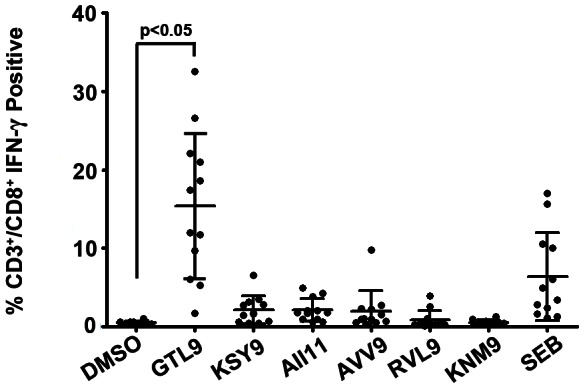
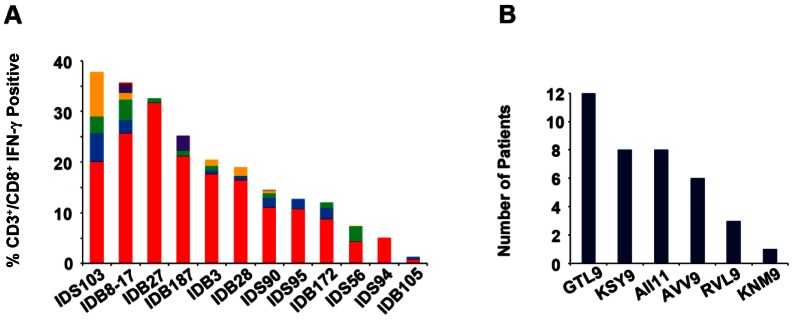
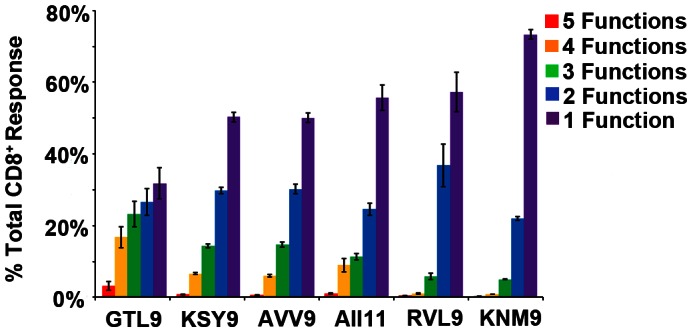
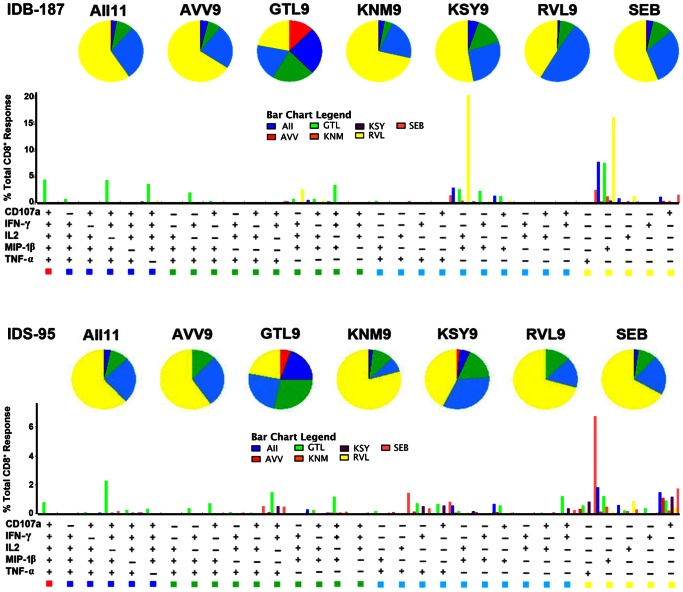
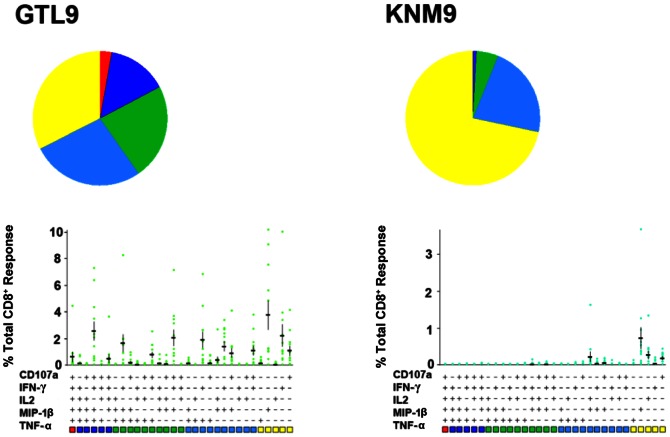
The recent West Nile virus (WNV) outbreak in the United States underscores the importance of understanding human immune responses to this pathogen. Via the presentation of viral peptide ligands at the cell surface, class I HLA mediate the T cell recognition and killing of WNV infected cells. At this time, there are two key unknowns in regards to understanding protective T cell immunity: 1) the number of viral ligands presented by the HLA of infected cells, and 2) the distribution of T cell responses to these available HLA/viral complexes. Here, comparative mass spectroscopy was applied to determine the number of WNV peptides presented by the HLA-A*11:01 of infected cells after which T cell responses to these HLA/WNV complexes were assessed. Six viral peptides derived from capsid, NS3, NS4b, and NS5 were presented. When T cells from infected individuals were tested for reactivity to these six viral ligands, polyfunctional T cells were focused on the GTL9 WNV capsid peptide, ligands from NS3, NS4b, and NS5 were less immunogenic, and two ligands were largely inert, demonstrating that class I HLA reduce the WNV polyprotein to a handful of immune targets and that polyfunctional T cells recognize infections by zeroing in on particular HLA/WNV epitopes. Such dominant HLA/peptide epitopes are poised to drive the development of WNV vaccines that elicit protective T cells as well as providing key antigens for immunoassays that establish correlates of viral immunity.
Conflict of interest statement
Figures
Similar articles
-
Epitope discovery in West Nile virus infection: Identification and immune recognition of viral epitopes.Proc Natl Acad Sci U S A. 2008 Feb 26;105(8):2981-6. doi: 10.1073/pnas.0711874105. Epub 2008 Feb 25. Proc Natl Acad Sci U S A. 2008. PMID: 18299564 Free PMC article.
-
Single-chain HLA-A2 MHC trimers that incorporate an immundominant peptide elicit protective T cell immunity against lethal West Nile virus infection.J Immunol. 2010 Apr 15;184(8):4423-30. doi: 10.4049/jimmunol.0903955. Epub 2010 Mar 8. J Immunol. 2010. PMID: 20212098 Free PMC article.
-
Identification of CD8+ T cell epitopes in the West Nile virus polyprotein by reverse-immunology using NetCTL.PLoS One. 2010 Sep 14;5(9):e12697. doi: 10.1371/journal.pone.0012697. PLoS One. 2010. PMID: 20856867 Free PMC article.
-
Innate and adaptive immune responses determine protection against disseminated infection by West Nile encephalitis virus.Viral Immunol. 2003;16(3):259-78. doi: 10.1089/088282403322396082. Viral Immunol. 2003. PMID: 14583143 Review.
-
West Nile virus infection and immunity.Nat Rev Microbiol. 2013 Feb;11(2):115-28. doi: 10.1038/nrmicro2950. Nat Rev Microbiol. 2013. PMID: 23321534 Review.
Cited by
-
Of Mice and Men: Protective and Pathogenic Immune Responses to West Nile virus Infection.Curr Trop Med Rep. 2015 Mar 1;2(1):41-48. doi: 10.1007/s40475-015-0040-4. Curr Trop Med Rep. 2015. PMID: 26120511 Free PMC article.
-
CD8 and CD4 T cells in west nile virus immunity and pathogenesis.Viruses. 2013 Oct 22;5(10):2573-84. doi: 10.3390/v5102573. Viruses. 2013. PMID: 24153060 Free PMC article. Review.
-
Impact of Micropolymorphism Outside the Peptide Binding Groove in the Clinically Relevant Allele HLA-C*14 on T Cell Responses in HIV-1 Infection.J Virol. 2022 May 25;96(10):e0043222. doi: 10.1128/jvi.00432-22. Epub 2022 Apr 27. J Virol. 2022. PMID: 35475667 Free PMC article.
-
Cancer immunotherapy. A dendritic cell vaccine increases the breadth and diversity of melanoma neoantigen-specific T cells.Science. 2015 May 15;348(6236):803-8. doi: 10.1126/science.aaa3828. Epub 2015 Apr 2. Science. 2015. PMID: 25837513 Free PMC article. Clinical Trial.
-
Dengue virus-infected human dendritic cells reveal hierarchies of naturally expressed novel NS3 CD8 T cell epitopes.Clin Exp Immunol. 2014 Sep;177(3):696-702. doi: 10.1111/cei.12373. Clin Exp Immunol. 2014. PMID: 24816171 Free PMC article.
References
-
- The CDC website. Available: http://www.cdc.gov/ncidod/dvbid/westnile/surv&control. htm. Accessed 2012 Dec 11.
-
- Brown CM, Demaria A (2012) The Resurgence of West Nile Virus. Ann Intern Med doi: 10.7326/0003-4819-157-11-201212040-00543 - DOI - PubMed
-
- Mostashari F, Bunning ML, Kitsutani PT, Singer DA, Nash D, et al. (2001) Epidemic West Nile encephalitis, New York, 1999: results of a household-based seroepidemiological survey. Lancet 358: 261–264. - PubMed
-
- Custer B, Kamel H, Kiely NE, Murphy EL, Busch MP (2009) Associations between West Nile virus infection and symptoms reported by blood donors identified through nucleic acid test screening. Transfusion 49: 278–288. - PubMed
Publication types
MeSH terms
Substances
Grants and funding
LinkOut - more resources
Full Text Sources
Other Literature Sources
Medical
Molecular Biology Databases
Research Materials
