Plasma processing conditions substantially influence circulating microRNA biomarker levels
- PMID: 23762257
- PMCID: PMC3676411
- DOI: 10.1371/journal.pone.0064795
Plasma processing conditions substantially influence circulating microRNA biomarker levels
Abstract
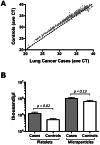
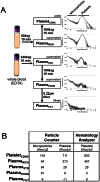
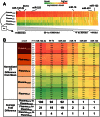
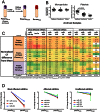
Circulating, cell-free microRNAs (miRNAs) are promising candidate biomarkers, but optimal conditions for processing blood specimens for miRNA measurement remain to be established. Our previous work showed that the majority of plasma miRNAs are likely blood cell-derived. In the course of profiling lung cancer cases versus healthy controls, we observed a broad increase in circulating miRNA levels in cases compared to controls and that higher miRNA expression correlated with higher platelet and particle counts. We therefore hypothesized that the quantity of residual platelets and microparticles remaining after plasma processing might impact miRNA measurements. To systematically investigate this, we subjected matched plasma from healthy individuals to stepwise processing with differential centrifugation and 0.22 µm filtration and performed miRNA profiling. We found a major effect on circulating miRNAs, with the majority (72%) of detectable miRNAs substantially affected by processing alone. Specifically, 10% of miRNAs showed 4-30x variation, 46% showed 30-1,000x variation, and 15% showed >1,000x variation in expression solely from processing. This was predominantly due to platelet contamination, which persisted despite using standard laboratory protocols. Importantly, we show that platelet contamination in archived samples could largely be eliminated by additional centrifugation, even in frozen samples stored for six years. To minimize confounding effects in microRNA biomarker studies, additional steps to limit platelet contamination for circulating miRNA biomarker studies are necessary. We provide specific practical recommendations to help minimize confounding variation attributable to plasma processing and platelet contamination.
Conflict of interest statement
Figures


Similar articles
-
Circulating microRNAs as novel biomarkers for platelet activation.Circ Res. 2013 Feb 15;112(4):595-600. doi: 10.1161/CIRCRESAHA.111.300539. Epub 2013 Jan 2. Circ Res. 2013. PMID: 23283721
-
Platelets confound the measurement of extracellular miRNA in archived plasma.Sci Rep. 2016 Sep 13;6:32651. doi: 10.1038/srep32651. Sci Rep. 2016. PMID: 27623086 Free PMC article.
-
MiRNA profiles in blood plasma from mother-child duos in human biobanks and the implication of sample quality: Circulating miRNAs as potential early markers of child health.PLoS One. 2020 Apr 2;15(4):e0231040. doi: 10.1371/journal.pone.0231040. eCollection 2020. PLoS One. 2020. PMID: 32240265 Free PMC article.
-
MicroRNA Biomarkers and Platelet Reactivity: The Clot Thickens.Circ Res. 2017 Jan 20;120(2):418-435. doi: 10.1161/CIRCRESAHA.116.309303. Circ Res. 2017. PMID: 28104774 Review.
-
microRNAs as promising biomarkers of platelet activity in antiplatelet therapy monitoring.Int J Mol Sci. 2020 May 14;21(10):3477. doi: 10.3390/ijms21103477. Int J Mol Sci. 2020. PMID: 32423125 Free PMC article. Review.
Cited by
-
Cardiovascular RNA markers and artificial intelligence may improve COVID-19 outcome: a position paper from the EU-CardioRNA COST Action CA17129.Cardiovasc Res. 2021 Jul 7;117(8):1823-1840. doi: 10.1093/cvr/cvab094. Cardiovasc Res. 2021. PMID: 33839767 Free PMC article.
-
Maternal Circulating microRNAs and Pre-Eclampsia: Challenges for Diagnostic Potential.Mol Diagn Ther. 2017 Feb;21(1):23-30. doi: 10.1007/s40291-016-0233-0. Mol Diagn Ther. 2017. PMID: 27638415 Review.
-
Concentration of circulating miRNA-containing particles in serum enhances miRNA detection and reflects CRC tissue-related deregulations.Oncotarget. 2016 Nov 15;7(46):75353-75365. doi: 10.18632/oncotarget.12205. Oncotarget. 2016. PMID: 27683108 Free PMC article.
-
Identification of a blood-borne miRNA signature of synovial sarcoma.Mol Cancer. 2015 Aug 7;14:151. doi: 10.1186/s12943-015-0424-z. Mol Cancer. 2015. PMID: 26250552 Free PMC article.
-
Role of miRNA-145, 148, and 185 and Stem Cells in Prostate Cancer.Int J Mol Sci. 2022 Jan 30;23(3):1626. doi: 10.3390/ijms23031626. Int J Mol Sci. 2022. PMID: 35163550 Free PMC article. Review.
References
-
- Lawrie CH, Gal S, Dunlop HM, Pushkaran B, Liggins AP, et al. (2008) Detection of elevated levels of tumour-associated microRNAs in serum of patients with diffuse large B-cell lymphoma. Br J Haematol 141: 672–675. - PubMed
-
- Chen X, Ba Y, Ma L, Cai X, Yin Y, et al. (2008) Characterization of microRNAs in serum: a novel class of biomarkers for diagnosis of cancer and other diseases. Cell Res 18: 997–1006. - PubMed
-
- Mostert B, Sieuwerts AM, Martens JW, Sleijfer S (2011) Diagnostic applications of cell-free and circulating tumor cell-associated miRNAs in cancer patients. Expert Rev Mol Diagn 11: 259–275. - PubMed
Publication types
MeSH terms
Substances
Grants and funding
LinkOut - more resources
Full Text Sources
Other Literature Sources
Miscellaneous

