. 2013 Jun 6;153(6):1312-26.
doi: 10.1016/j.cell.2013.05.014.

OTULIN antagonizes LUBAC signaling by specifically hydrolyzing Met1-linked polyubiquitin

Affiliations

OTULIN antagonizes LUBAC signaling by specifically hydrolyzing Met1-linked polyubiquitin

Kirstin Keusekotten et al. Cell. .

Abstract

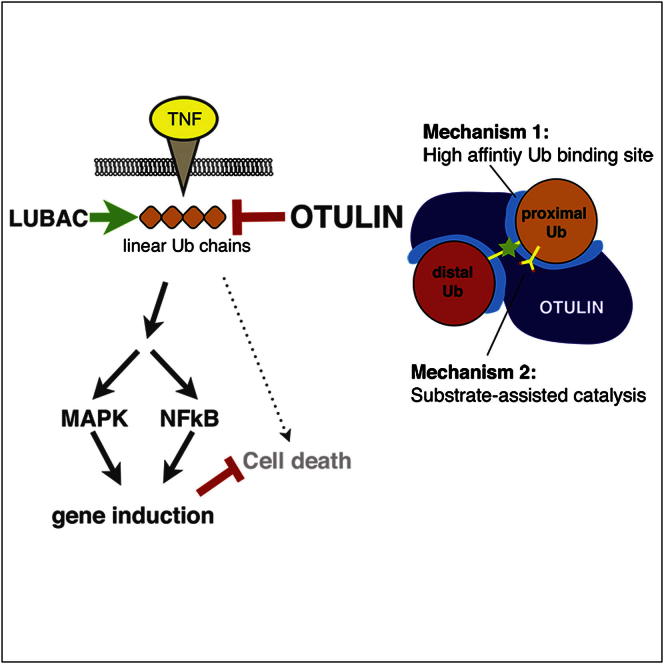
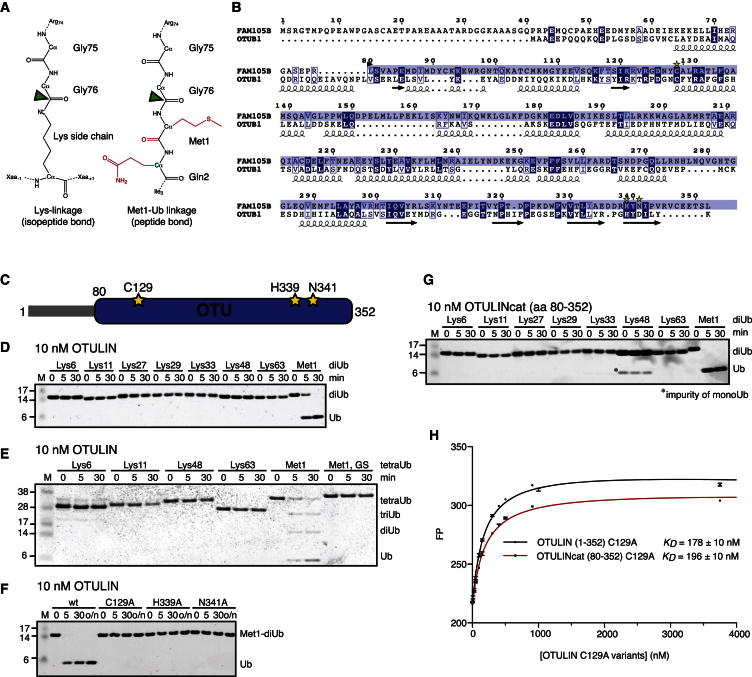
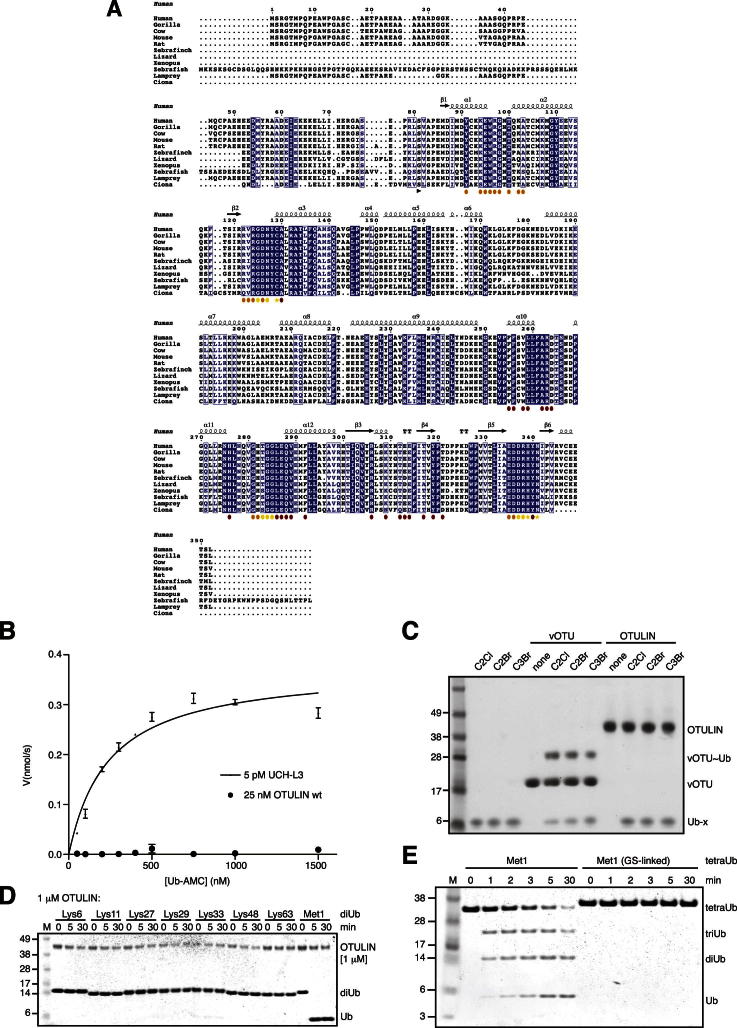
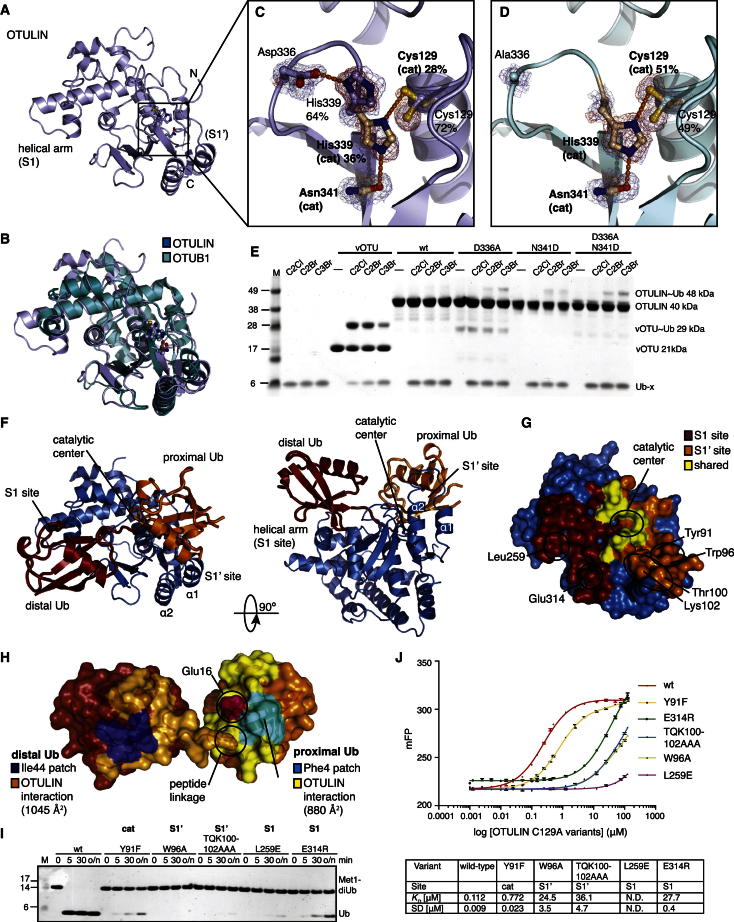
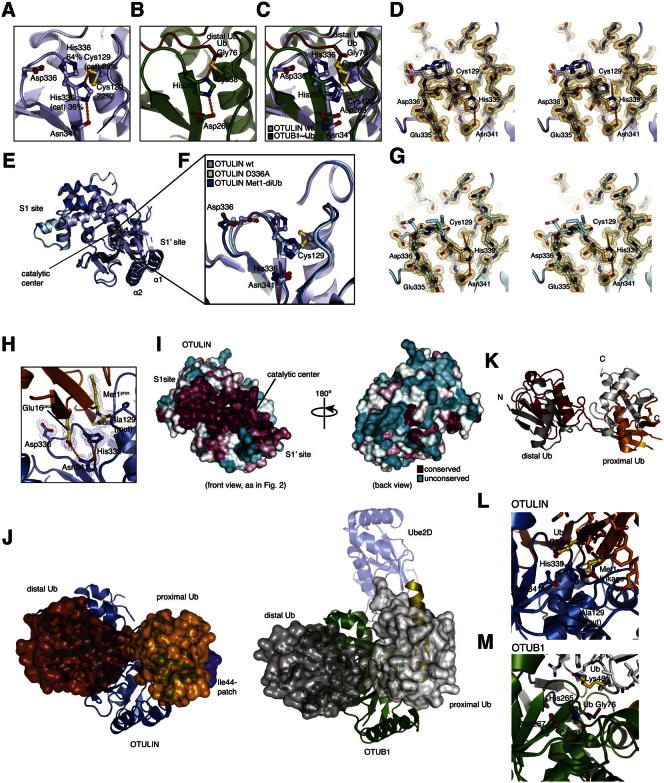
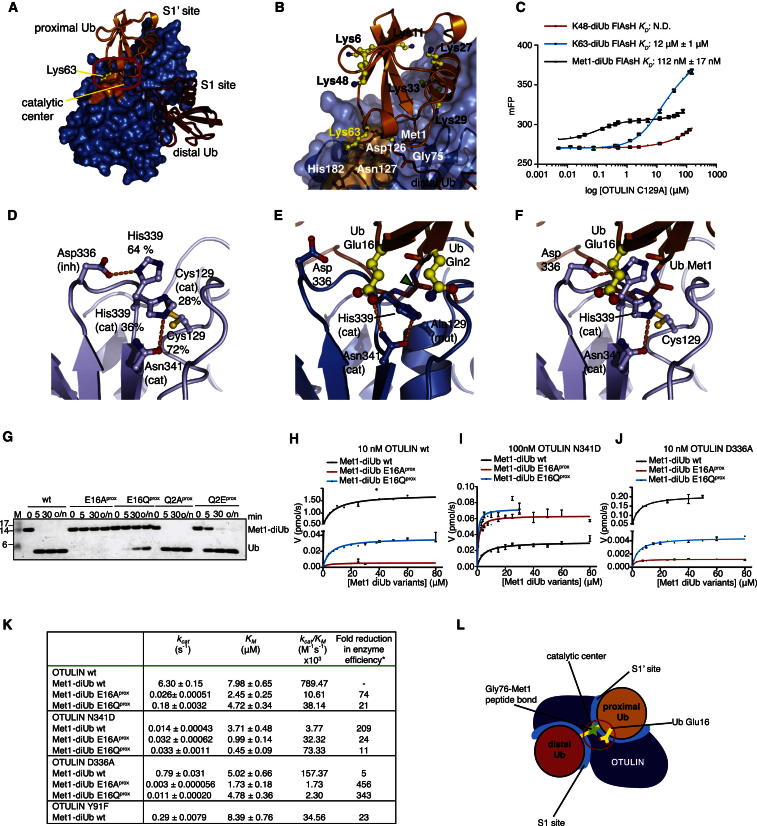
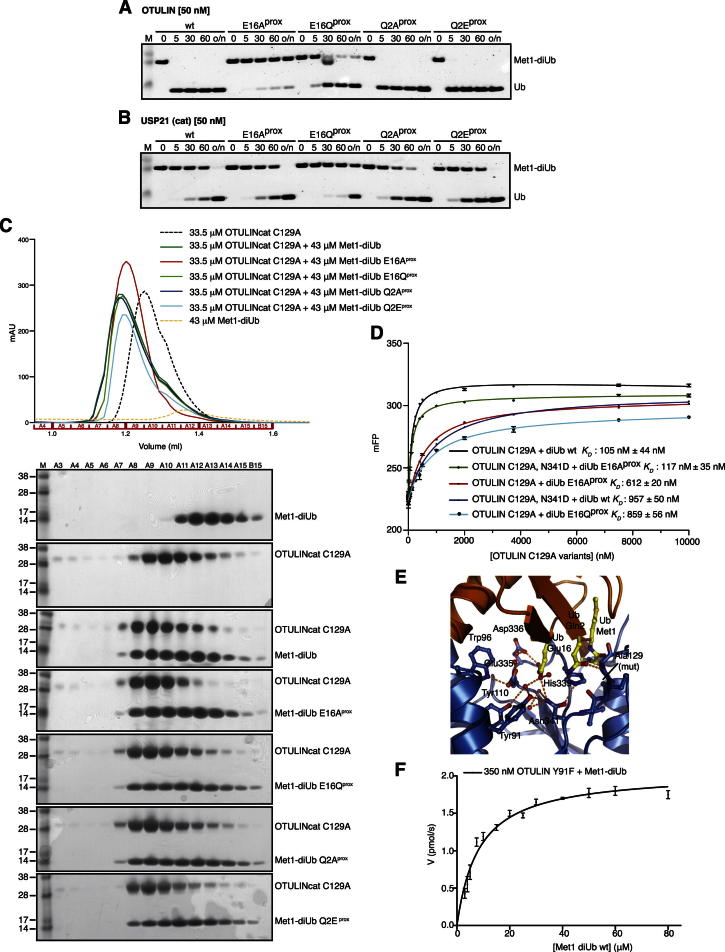
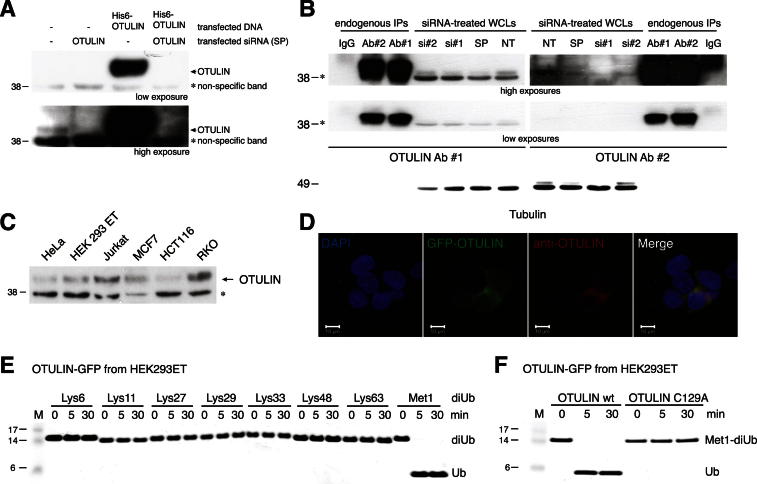
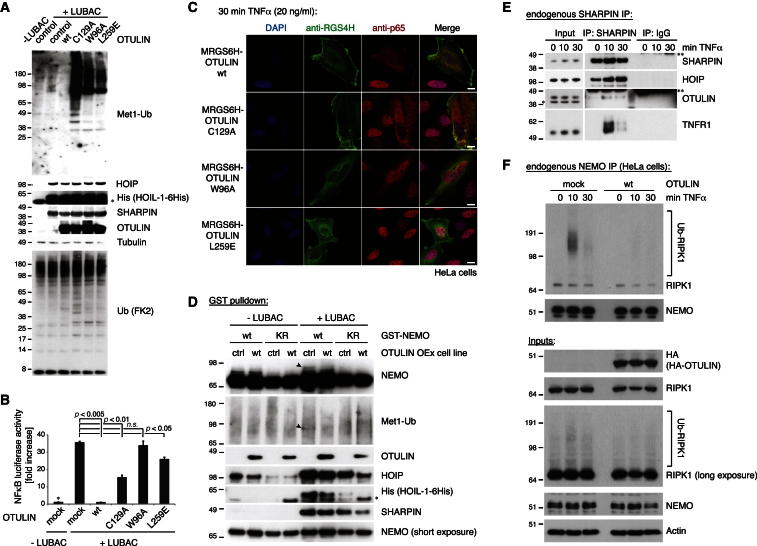
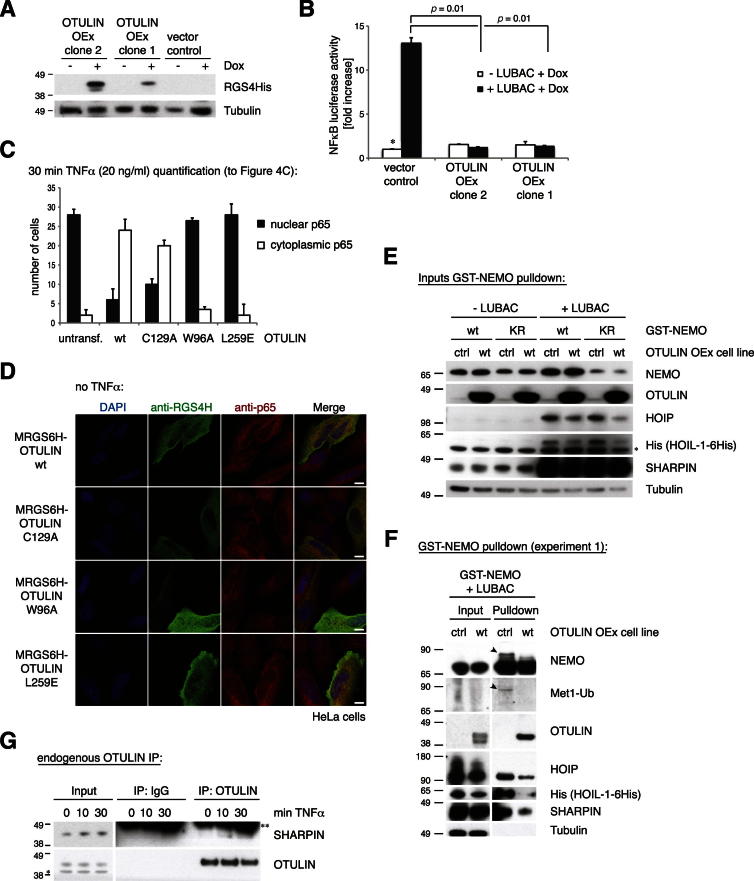
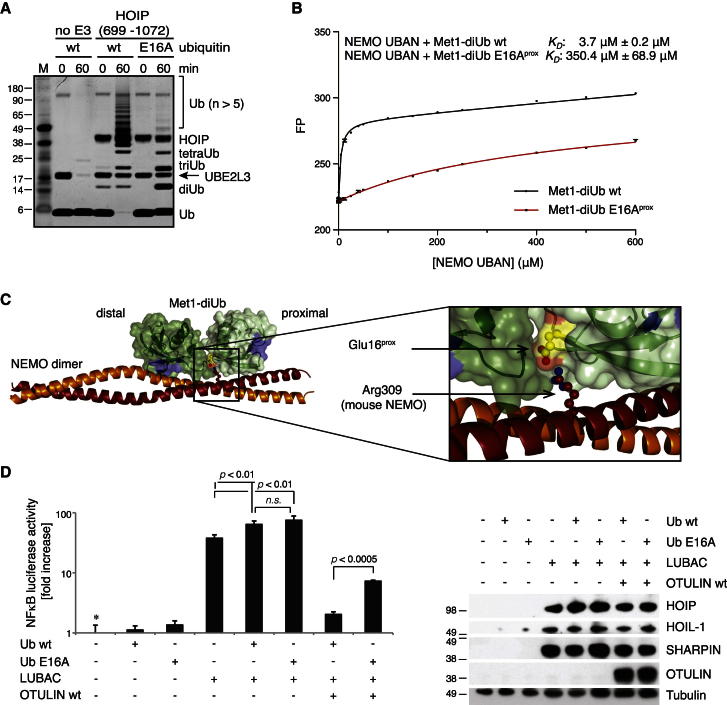
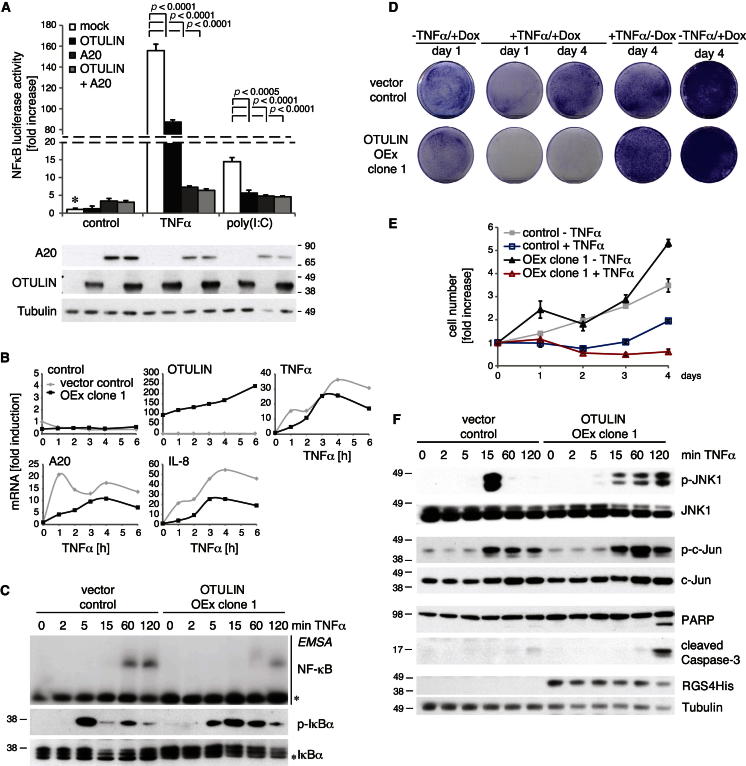
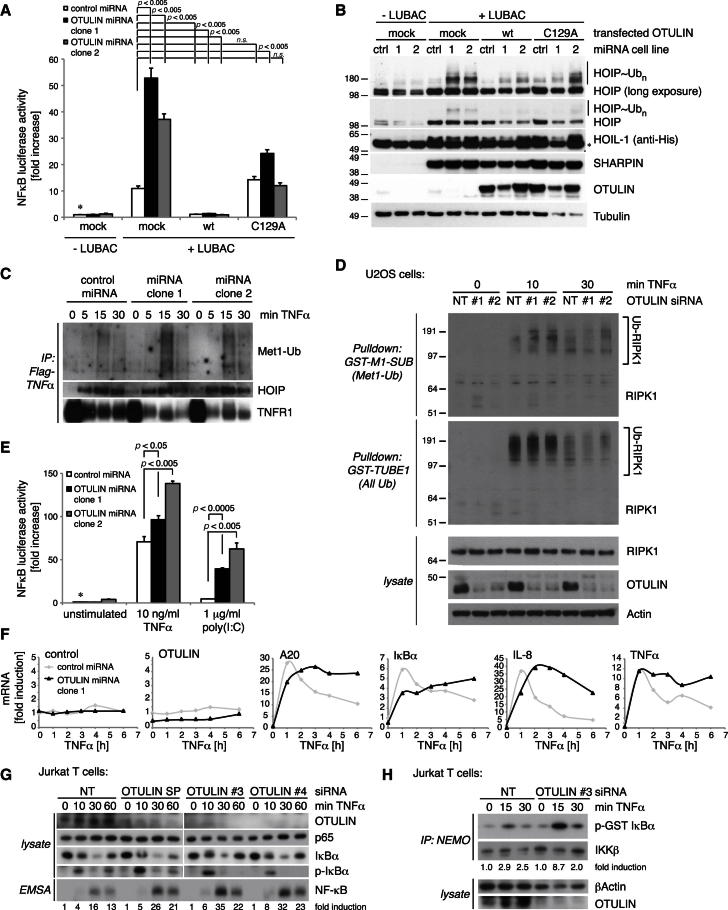
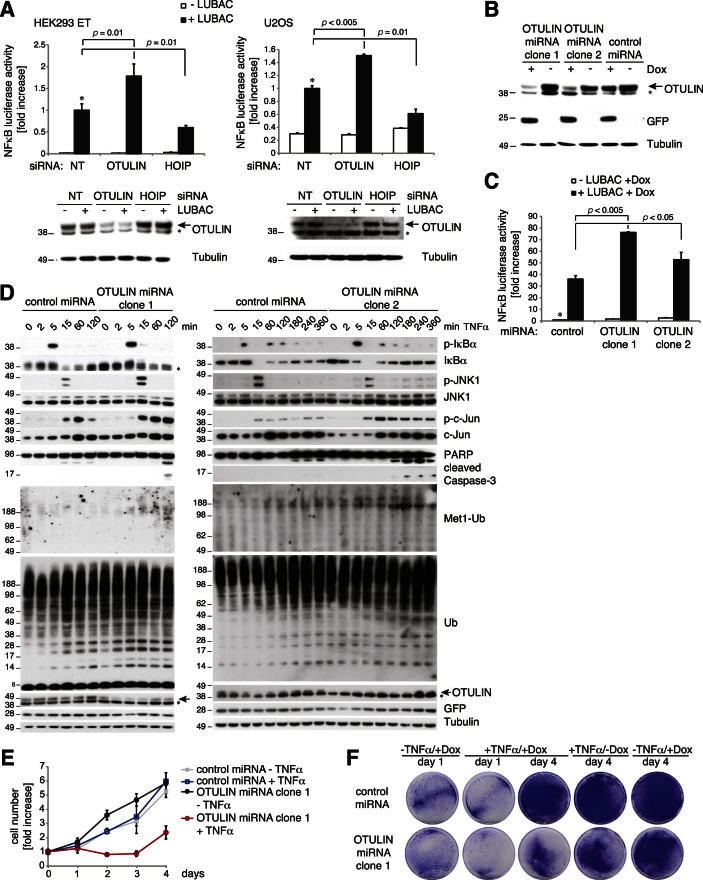
The linear ubiquitin (Ub) chain assembly complex (LUBAC) is an E3 ligase that specifically assembles Met1-linked (also known as linear) Ub chains that regulate nuclear factor κB (NF-κB) signaling. Deubiquitinases (DUBs) are key regulators of Ub signaling, but a dedicated DUB for Met1 linkages has not been identified. Here, we reveal a previously unannotated human DUB, OTULIN (also known as FAM105B), which is exquisitely specific for Met1 linkages. Crystal structures of the OTULIN catalytic domain in complex with diubiquitin reveal Met1-specific Ub-binding sites and a mechanism of substrate-assisted catalysis in which the proximal Ub activates the catalytic triad of the protease. Mutation of Ub Glu16 inhibits OTULIN activity by reducing kcat 240-fold. OTULIN overexpression or knockdown affects NF-κB responses to LUBAC, TNFα, and poly(I:C) and sensitizes cells to TNFα-induced cell death. We show that OTULIN binds LUBAC and that overexpression of OTULIN prevents TNFα-induced NEMO association with ubiquitinated RIPK1. Our data suggest that OTULIN regulates Met1-polyUb signaling.


Figures

None
Graphical abstract
Figure 1
Figure 1
Identification and Specificity of OTULIN (A) Chemical difference between an isopeptide (left) and Met1-peptide linkage (right) in diUb. The distal Ub (top) is linked via its C-terminal Gly75-Gly76 sequence to a Lys side chain ε-amino group in another Ub or on a substrate, generating a branched peptide. In a Met1-linked chain, the C-terminal Gly76 is connected to Met1 of the distal Ub in a standard peptide linkage. The Met1 and Gln2 side chains, as well as the Met1 carbonyl (red), represent steric differences in comparison to an isopeptide linkage. A green arrow indicates the scissile bond in a DUB reaction. (B) Sequence alignment of FAM105B/OTULIN with OTUB1. Sequence identity is 18% for the catalytic domain. Secondary structure elements are shown for OTUB1. The OTU domain is indicated in blue, and catalytic residues are labeled with yellow stars. (C) The domain structure of OTULIN colored as in (B). (D) Linkage specificity of OTULIN. diUb (1 μM) of all possible linkage types is hydrolyzed over a time course by 10 nM OTULIN and visualized on silver-stained 4%–12% gradient SDS-PAGE gels. See Figure S1D for the assay at 1 μM OTULIN concentration. (E) Cleavage of tetraUb chains, as in (D). The last substrate is a Met1-tetraUb with G76S mutation in all Ub moieties. (F) Hydrolysis of Met1-diUb by OTULIN wild-type (WT) and catalytic mutants as indicated. (G) The OTU domain of OTULIN encodes Met1-linked Ub specificity. diUb specificity analysis as in (D) with OTULIN 80–352 at a 10 nM concentration. (H) Affinity measurements by fluorescence anisotropy with OTULIN (1–352) C129A or OTULIN (80–352) C129A and FlAsH-tagged Met1-diUb, as described in the Extended Experimental Procedures. Error bars represent SD from the mean of measurements performed in triplicate.
Figure S1
Figure S1
Multiple Sequence Alignment and In Vitro Analysis, Related to Figure 1 (A) Sequence alignment of FAM105B/OTULIN from various species, extracted from the Ensembl Genome Browser (http://www.ensembl.org/Homo_sapiens/Gene/Compara_Tree?g=ENSG00000154124;r=5:14664773-14699820). Several sequences (Zebrafinch, Lizard, Xenopus) lack an initiating N-terminal Met, suggesting that sequences were N-terminally truncated. Annotations of secondary structure are based on the Met1-diUb complex structure (Figure 2F). The annotation below indicates the start of the crystallized construct (black arrow), catalytic residues (yellow stars), and residues interacting with the proximal (orange circles), distal (red circles) or both Ub moieties (yellow circles) (see Figure 2G). (B) Hydrolysis of Ub-AMC by 5 pM UCH-L3 and 25 nM OTULIN WT. Error bars represent the standard deviation from the mean calculated from triplicate measurements. See Extended Experimental Procedures for details. (C) Ub-based suicide inhibitors. Ub-x, with x being a C2Cl, C2Br or C3Br warhead (Borodovsky et al., 2002), were prepared according to (Akutsu et al., 2011) and Extended Experimental Procedures and used to modify vOTU or OTULIN. A coomassie-stained SDS-PAGE gel is shown. While vOTU modification with Ub-probes results in a band shift due to the covalent modification, OTULIN is inert toward these reagents. (D) Linkage specificity is retained with 1 μM OTULIN. DiUb (1 μM) of all possible linkage types is hydrolyzed over a time course by 1 μM OTULIN, and visualized on silver stained 4%–12% gradient SDS-PAGE gels. (E) Incubation of OTULIN with Met1-linked tetraUb (Met1) or mutant Met1-linked tetraUb (Met1, GS-linked) in which Gly76 in the linkage is mutated to Ser. A silver stained SDS-PAGE gel of the indicated time course is shown. OTULIN hydrolysis of Met1-linked tetraUb immediately generates tri-, di- and monoUb, suggesting that OTULIN can cleave at any position within the tetraUb chain (endo-activity).
Figure 2
Figure 2
Structural Analysis of OTULIN (A) Structure of OTULINcat (aa 80–352). Ub-binding S1 and S1’ sites and termini are indicated. The catalytic center is boxed. (B) Superposition of OTULIN (blue) and OTUB1 (cyan, PDB 2ZFY) (Edelmann et al., 2009). (C) A close-up image of the OTULIN catalytic triad (Cys129, His339, and Asn341) showing two alternative conformations for His339 and Cys129. Dotted lines indicate hydrogen bonds. A simulated annealing composite omit map (blue, contoured at 1σ) and |Fo|-|Fc| map (red, contoured at 3σ) is shown. The active (beige) and inactive (blue) conformation of the catalytic triad are shown. Percentages represent refined occupancies from Refmac5 (Murshudov et al., 2011). (D) Catalytic center of OTULIN D336A determined at a 1.35 Å resolution (see Figures S2E and S2G) shown as in (C). (E) OTULIN variants modified by Ub suicide probes, resolved on coomassie-stained SDS-PAGE gels. An 8 kDa shift indicates formation of a covalent OTULIN∼Ub complex. See Figure S1C and the Extended Experimental Procedures. (F) Structure of OTULIN (blue) in complex with Met1-diUb (with distal Ub in red and proximal Ub in orange), shown in two orientations. The helical arm comprising the S1 and the α1 and α2 helices comprising the S1’ Ub-binding sites are labeled, and the catalytic center is indicated. (G) Surface representation of OTULIN showing S1 (dark red), and S1’ (orange) binding sites. Yellow indicates residues interacting with both moieties. Labeled residues were mutated for experiments in (I) and (J). (H) The structure of Met1-diUb indicating the interfaces with OTULIN colored as in (G). The Ile44 patch (blue) of the distal and the Phe4 patch (cyan; Gln2, Phe4, and Thr14) of the proximal Ub is indicated. Ub Glu16prox is shown in purple. (I) Met1-diUb hydrolysis assay performed as in Figure 1D with 10 nM OTULIN and OTULIN Ub-binding mutants. Mutations are annotated accordingly: cat, catalytic and Ub-binding sites; S1 and S1’, distal and proximal, respectively. (J) Affinity (KD) measurements of OTULIN C129A with or without Ub-binding mutations performed with fluorescence anisotropy with FlAsH-tagged Met1-diUb (Ye et al., 2011). Error bars represent SD from the mean of measurements performed in triplicate. WT, wild-type; ND, not determined.
Figure S2
Figure S2
Structural Analysis of OTULIN, Related to Figure 2 The catalytic triad of OTULIN is delocalized in the absence of Met1-diUb. (A) View of OTULIN catalytic triad as shown in Figure 2C, the occupancies of the catalytic cysteine (Cys129) and histidine (His339) are 28% and 36% respectively. (B) View of the catalytic triad of OTUB1 (green) bound to Ub suicide probe (red) (PDB ID: 4DHZ) (Wiener et al., 2012). (C) Superimposition of OTULIN and OTUB1 catalytic centers highlights the miss-orientation of OTULINs catalytic residues, His339 and Cys129 in the absence of Met1-diUb. (D) Stereo view of the apo OTULIN catalytic site, as viewed from Figure 2C showing all residues within the region of the catalytic center enclosed in a 2|Fo|-|Fc| map, contoured at 1σ. (E) Superimposition of OTULIN structures used within this study reveals no conformational changes between the OTULIN D336A and OTULIN WT structure (rmsd 0.24 Å) and OTULIN C129A from the Met1-diUb-containing structure and OTULIN WT (rmsd 0.76 Å). (F) Close-up view of the various OTULIN catalytic centers. The catalytic His339 exists in two occupancies within the apo structure whereas only a single, catalytic conformation is observed in the D336A mutant structure. Likewise, within the OTULIN Met1-diUb structure His339 exists only in the catalytic conformation. (G) Stereo view of the OTULIN D336A catalytic site enclosed in a 2|Fo|-|Fc| map, contoured at 1σ. (H) Catalytic center of OTULIN Met1-diUb complex as shown in Figure 3E, with a 2|Fo|-|Fc| map contoured at 1σ shown for relevant residues. (I) Surface conservation of OTULIN, based on the sequence alignment in Figure S1 generated with the Consurf server (http://consurf.tau.ac.il/). The surface of OTULIN (from the diUb complex structure, Figure 2F) is colored from green (no conservation) to dark red (fully conserved) and shown as in Figure 2G (left) as well as in a 180° rotation (right). (J) Side-by-side comparison between the OTULIN and OTUB1 -diUb complexes, with OTULIN (blue, with red (distal) and orange (proximal) Met1-diUb) on the left and OTUB1 (green, with gray Ub molecules) on the right. The N-terminal helix in OTUB1 (yellow) binds to the Ile44 hydrophobic patch (blue on all Ub molecules) of the proximal Ub molecule. In the OTULIN structure, rotation of the proximal Ub leads to an exposed Ile44 patch of the proximal Ub moiety. (K) Orientation of diUb molecules (colored as in (J) resulting from superposition of OTULIN and OTUB1. Although Ub molecules occupy similar spaces on the enzymes (see (J), both Ub molecules are rotated with respect to each other. Rotation of the proximal Ub is expected as different linkage points are involved (see position of C-termini, labeled C). The rotation of the distal Ub of ∼18° is more surprising, and reveals that the S1 binding site of the enzyme also shows significant plasticity. (L) Close-up of the OTULIN catalytic center bound to Met1-diUb. Glu16 and Gln2 of the proximal Ub are shown in yellow, and active site residues are labeled. (M) Catalytic center of OTUB1 bound to two ubiquitin molecules. Lys48 of the proximal Ub is indicated, and is the only residue in close proximity to the catalytic center, explaining OTUB1’s specificity. However, further Ub residues interacting with the catalytic triad as observed in OTULIN are not present.
Figure 3
Figure 3
Substrate-Assisted Catalysis in OTULIN (A) The OTULIN-diUb complex is shown with OTULIN under a blue surface and Met1-diUb colored as red and orange for the distal and proximal moieties, respectively. The catalytic center and Lys63-binding pocket is shown boxed. (B) A close-up view of (A) showing all Ub Lys residues on the proximal Ub (yellow). Lys63 and Met1 are spatially close. (C) Affinity measurements of OTULIN C129A with K48-, K63, and Met1-diUb linkages performed with fluorescence anisotropy (Ye et al., 2011). Error bars represent SD from the mean of measurements performed in triplicate. (D–F) A close-up image of the OTULIN catalytic center showing key residues. Dotted lines indicate hydrogen bonds. (D) Unliganded OTULIN, shown as in Figure 2C. (E) OTULIN C129A (blue) in complex with Met1-diUb (red and orange). Residues from the proximal Ub are shown in yellow. A green arrow indicates the scissile bond (compare to Figure 1A). (F) Superposition of (D) with the Met1-diUb from (E). The carbonyl of Met1 and the side chain of Glu16 of the proximal Ub disengage the autoinhibition of His339. Gln2 is omitted for clarity. (G) OTULIN hydrolysis of Met1-diUb mutated in the proximal moiety performed as in Figure 1D. o/n, overnight incubation. (H–J) Kinetic parameters of OTULIN variants measured by fluorescence anisotropy. Initial rates of hydrolysis at varying substrate concentrations containing 150 nM FlAsH-tagged Met1-diUb variants were fitted to the Michaelis-Menten kinetic model with GraphPad Prism 5. Error bars represent SDs from the mean of measurements performed in triplicate. (K) Summary of kinetic parameters measured. *, fold reduction in enzyme efficiency relative to OTULIN WT + Met1-diUb WT. (L) A schematic representation of OTULIN mechanism, which involved extensive S1 and S1’ sites and substrate-assisted catalysis mediated by Ub Glu16.
Figure S3
Figure S3
Mutant diUb Controls and Fluorescence Anisotropy Binding and Kinetic Studies, Related to Figure 3 (A) Met1-diUb and variants with point mutations in the proximal Ub moiety were hydrolyzed by OTULIN at 50 nM concentration (compared to 10 nM in Figure 3G). A time course of the reaction is resolved on a silver stained SDS-PAGE gel as in Figure 3G. (B) Same as (A), but using the Ub specific protease USP21 (Ye et al., 2011) at 50 nM concentration. (C) Analytical size exclusion chromatography (SEC) profiles of inactive OTULINcat C129A with Met1-diUb, and Met1-diUb variants containing point mutations in the proximal moiety. Experiments were performed with 33.5 μM OTULIN and 43 μM Met1-diUb mutants, giving a 1:1.3 molar ratio of OTULIN to diUb, respectively. Shifting of the SEC peak to the left indicates complex formation in all cases. Corresponding SDS-PAGE gels showing proteins in peak fractions according to the profile are shown below. (D) Binding curves derived from fluorescence anisotropy measurements for OTULIN C129A and OTULIN C129A N314D using FlAsH-tagged Met1-diUb WT, E16Aprox and E16Qprox. Error bars represent standard deviation from the mean of measurements performed in triplicate. (E) View of the catalytic center of OTULINcat C129A bound to Met1-diUb, showing the interaction of Tyr91 with the catalytic Asn341. (F) Kinetic parameters determined from hydrolysis of FlAsH-tagged Met1-diUb WT by 350 nM OTULIN Y91F used to derive the rate constants shown in Figure 3K. Error bars represent standard deviation from the mean from experiments performed in triplicate.
Figure S4
Figure S4
Reagent Validation, Cellular Localization of OTULIN, and Stable Inducible OTULIN Cell Lines, Related to Figure 4 (A) A polyclonal rabbit, anti-OTULIN antibody was generated that detects endogenous and overexpressed OTULIN in HEK 293ET cell lysates. siRNAs against OTULIN (Dharmacon pool) reduces OTULIN protein levels. Two exposures of the same western blot are shown. (B) Comparison of the two polyclonal antisera obtained from rabbit immunization. Both antibodies detect an endogenous band that is reduced in siRNA-treated samples and that is also immunoprecipitated by both antibodies from HEK 293ET cells. (C) OTULIN can be detected in all analyzed cell lines. (A–C) *, nonspecific band. (D) Localization of C-terminally GFP-tagged OTULIN in HEK 293ET cells. Left, DAPI stain of cell nuclei; second from left, GFP fluorescence; second from right, immunodetection of transfected OTULIN with anti-OTULIN antibody; right, merged image. Scale bar, 10 μm. (E) GFP-tagged OTULIN was expressed in HEK 293ET cells and purified using GFP-Trap resin. Specificity assays were performed as in Figure 1D using approximately 500 nM GFP-OTULIN bound to GFP-Trap beads. A silver-stained 4%–12% SDS-PAGE gel is shown. (F) GFP-tagged OTULIN C129A is catalytically inactive when expressed in HEK 293ET cells and purified by GFP-Trap resin.
Figure 4
Figure 4
Cellular Functions of OTULIN (A) HEK 293ET cells were transfected with plasmids for LUBAC and indicated OTULIN variants (see the Extended Experimental Procedures), and lysates were analyzed by western blotting with the indicated antibodies, including the Met1-linkage-specific antibody (Matsumoto et al., 2012). (B) NF-κB luciferase assays in HEK 293ET cells for the experiment shown in (A). Error bars represent SD from the mean of experiments performed in triplicate. p values are given to indicate significance. *, mean value set to 1; n.s., nonsignificant. (C) HeLa cells were transiently transfected with indicated plasmids, treated with TNFα (20 ng/ml) for 30 min, and analyzed by immunofluorescence with indicated antibodies (see Figure S5 for controls and quantification). The scale bar represents 10 μm. (D) Pulldown of GST-tagged NEMO wild-type (WT) or K285/309R (KR), with or without LUBAC, in control or OTULIN-overexpressing T-REx 293 cell lines. Western blotting with indicated antibodies reveals polyUb on NEMO (arrowhead), which is lost when OTULIN is coexpressed. See also Figure S5. (E) Immunoprecipitation (IP) of endogenous SHARPIN coprecipitates HOIP and OTULIN and after TNFα stimulation (100 ng/ml), also TNFR1 is shown as revealed by western blotting with the indicated antibodies. *, nonspecific band; **, heavy chain. See also Figure S5. (F) IP of endogenous NEMO coprecipitates polyubiquitinated RIPK1 (Ub-RIPK1) after TNFα stimulation (10 ng/ml) of HeLa cells. Western blotting with the indicated antibodies reveals that transient OTULIN overexpression prevents this complex formation.
Figure S5
Figure S5
Stable Inducible OTULIN Cell Lines and Controls, Related to Figure 4 (A) Western-blotting analysis of T-REx293 cells stably expressing a doxycycline-inducible MRGS6His-tagged OTULIN construct. (B) NF-κB luciferase activity of OTULIN-overexpressing cells in response to LUBAC coexpression. Error bars represent standard deviation of experiments performed in duplicate. p values are given to indicate significance and asterisks indicate mean values set to 1. (C) Quantification for the experiment shown in Figure 4C.Black bars represent the number of HeLa cells in which p65 translocated into the nucleus while white bars represent the number of cells in which p65 was excluded from the nucleus after 30 min of TNFα stimulation (20 ng/ml) in cells transfected with the indicated OTULIN variants. n = 30 for each condition. Error bars represent standard deviation from the mean from duplicate measurements. (D) Control to Figure 4C. HeLa cells were transiently transfected with indicated plasmids and analyzed in immunofluorescence with indicated antibodies without any prior TNFα stimulation (see Extended Experimental Procedures). Scale bar = 10 μm. (E) Input levels of transfected proteins for pulldown of GST-tagged NEMO variants of Figure 4D in control or OTULIN overexpressing T-REx293 cell lines (see Extended Experimental Procedures) after western blotting with the indicated antibodies. (F) Pulldown of GST-tagged wild-type NEMO after coexpression with LUBAC, in control or OTULIN overexpressing T-REx293 cell lines. Western blotting with indicated antibodies reveals polyUb on NEMO (arrowhead), which is lost when OTULIN is coexpressed. This was the first experiment showing that NEMO is modified by a Met1-linked polyubiquitin chain of a distinct length and is shown to support the results of Figure 4D. (G) Immunoprecipitation of endogenous OTULIN (see Extended Experimental Procedures) coprecipitates endogenous SHARPIN before and after TNFα stimulation (100 ng/ml) as revealed by western blotting with the indicated antibodies.*, nonspecific band; **, heavy chain.
Figure 5
Figure 5
Importance of Ub Glu16 for Met1-polyUb Biology (A) A minimal HOIP construct (aa 699–1072) that efficiently assembles Met1-Ub chains with WT Ub (Smit et al., 2012; Stieglitz et al., 2012) is less efficient with Ub E16Aprox in vitro. A silver-stained SDS-PAGE gel is shown. (B) Fluorescence anisotropy of NEMO UBAN domain binding to FlAsH-tagged Met1-diUb and Met1-diUb E16Aprox. The UBAN domain binds the mutant Ub chain with ∼100-fold lower affinity. Error bars represent SD from the mean from triplicate measurements. (C) Structural basis for decreased affinity of NEMO for Met1-diUb E16Aprox mutant. The structure of the NEMO UBAN domain dimer (orange) bound to Met1-diUb is shown (PDB 2ZVN [Rahighi et al., 2009], one diUb omitted for clarity). Ub molecules are shown under a green surface with Ile44 hydrophobic patches in blue. Glu16 and its interacting residue Arg309 (mouse NEMO, corresponding human residue Arg312) are shown in stick representation. The inset highlights this interaction. Glu16prox also bridges the two Ub moieties and interacts with the C terminus of a distal Ub (data not shown). (D) Luciferase assays performed as in Figure 4B for HEK 293ET cells transfected with or without LUBAC, WT OTULIN, and Ub WT or Ub E16A. p values are given to indicate significance. *, mean value set to 1; n.s., nonsignificant. Input levels of transfected proteins, analyzed by western blotting with the indicated antibodies, are shown on the right.
Figure 6
Figure 6
OTULIN Overexpression Inhibits TNFα Signaling (A) Luciferase assays performed as in Figure 4B in HEK 293ET cells transfected with OTULIN, A20, or both OTULIN and A20 and stimulated with TNFα (100 ng/ml) or poly(I:C) (10 μg/ml). Western blots below show transfected protein levels. Error bars represent SD from the mean for experiments performed in triplicate. p values are given to indicate significance. *, the control set to 1. (B–F) Stable doxycycline-inducible control and OTULIN-overexpressing T-REx 293 cells after treatment with 1 μg/ml doxycyclin (Dox) for 24 hr (see the Extended Experimental Procedures). (B) Quantitative PCR (qPCR) analysis of selected NF-κB target genes in control (gray) and OTULIN-overexpressing cells (black) after treatment with 10 ng/ml TNFα for the indicated times. (C) Analysis of TNFα-stimulated NF-κB activation and IκBα phosphorylation upon TNFα treatment (100 ng/ml) over the indicated time course by western blotting with indicated antibodies and EMSA. See (F) for tubulin control. (D) Clonogenic survival of indicated cell lines ± Dox and ± TNFα (50 ng/ml) for 24 hr (see the Extended Experimental Procedures). (E) Cell viability counts of cells treated as in (D). Error bars represent SD from the mean for experiments performed in triplicate. (F) Analysis of TNFα-stimulated signaling cascades upon TNFα treatment (100 ng/ml) over the indicated time course by western blotting.
Figure 7
Figure 7
OTULIN Depletion Amplifies LUBAC Signaling (A–C, E–F) Experiments in stable T-REx 293 cell lines inducibly expressing control or OTULIN-targeting miRNA (see Experimental Procedures and Figure S6). (A) NF-κB luciferase activity shown as in Figure 4B in cells transfected with LUBAC and indicated OTULIN variants. Error bars represent SD from the mean of experiments performed in duplicate. p values are given to indicate significance. *, the control set to 1; n.s., nonsignificant. (B) Western blotting analysis of lysates from (A) with indicated antibodies. *, nonspecific band. (C) Immunoprecipitation of the TNF-RSC by FLAG-TNFα (100 ng/ml) from control and OTULIN-depleted cell lines at indicated time points western blotted against Met1-polyUb, HOIP, and TNFR1. (D) Met1-Ub-specific GST-M1-SUB or general GST-TUBE1 Ub pulldown from U2OS cells stimulated with TNFα (10 ng/ml) after transfection of OTULIN siRNA or a nontargeting (NT) control siRNA. (E) NF-κB luciferase activity in control and OTULIN-depleted cell lines after treatment with TNFα (10 ng/ml) or poly(I:C) (1 μg/ml). Error bars represent SD from the mean of experiments performed in duplicate. p values are given to indicate significance. *, the control set to 1; n.s., nonsignificant. (F) Analysis of selected NF-κB target genes by qPCR in control and OTULIN-depleted cell lines over a time course of TNFα stimulation (10 ng/ml). (G) Jurkat cells transfected with nontargeting (NT) control siRNA or three different OTULIN-specific siRNAs were treated with TNFα (25 ng/ml) as indicated. EMSA signals were quantified by densitometry. SP, smart pool. (H) OTULIN or control siRNA-transfected Jurkat cells were stimulated for 15 and 30 min with TNFα (25 ng/ml). After NEMO IP, kinase assays were performed with GST-IκBα (aa 1–53) as a substrate and quantified by densitometry.
Figure S6
Figure S6
OTULIN Knockdown Studies, Related to Figure 7 (A) HEK 293ET (left) and U2OS (right) cell lines were transfected with NF-κB reporter plasmids, LUBAC and with siRNAs targeting OTULIN, HOIP or a nontargeting control siRNA. NF-κB reporter activity was measured as in Figure 4B. Error bars represent standard deviation from the mean of experiments performed in triplicate. p values are given to indicate significance and the asterisk indicate the mean value set to 1. Western blots with indicated antibodies show knockdown efficiency. Here, the asterisk indicates nonspecific bands. (B) T-REx293 cells stably transfected with an inducible nontargeting control miRNA or with an inducible OTULIN-targeting miRNA are analyzed by western blotting with indicated antibodies. Doxycycline induces the OTULIN miRNA (together with GFP expression) from the GFP mRNA 3′UTR, and expression can be monitored by expressed GFP levels following doxycycline induction. (C) LUBAC-induced NF-κB luciferase activity is increased in OTULIN-depleted cell lines. Error bars represent the standard deviation from the mean of experiments performed in duplicate. p values are given to indicate significance. (D) Control or OTULIN-depleted cell lines were stimulated with TNFα (10 ng/ml) for the indicated times, and lysates were analyzed by western blotting with the indicated antibodies. *, nonspecific band. (E) Cell viability counts of stable doxycycline-inducible control and OTULIN-miRNA expressing T-REx293 cells after treatment with and without doxycycline (+/− Dox, 1 μg/ml for 72 h) prior to TNFα treatment (+/− TNFα, 50 ng/ml for 24 hr) (see Extended Experimental Procedures). Error bars represent the standard deviation from the mean for experiments performed in triplicate. (F) Clonogenic survival of cells treated as in (E).

Comment in

Similar articles

Cited by

References

    1. Amerik AYu, Swaminathan S., Krantz B.A., Wilkinson K.D., Hochstrasser M. In vivo disassembly of free polyubiquitin chains by yeast Ubp14 modulates rates of protein degradation by the proteasome. EMBO J. 1997;16:4826–4838. - PMC - PubMed
    1. Behrends C., Harper J.W. Constructing and decoding unconventional ubiquitin chains. Nat. Struct. Mol. Biol. 2011;18:520–528. - PubMed
    1. Boisson B., Laplantine E., Prando C., Giliani S., Israelsson E., Xu Z., Abhyankar A., Israël L., Trevejo-Nunez G., Bogunovic D. Immunodeficiency, autoinflammation and amylopectinosis in humans with inherited HOIL-1 and LUBAC deficiency. Nat. Immunol. 2012;13:1178–1186. - PMC - PubMed
    1. Borodovsky A., Ovaa H., Kolli N., Gan-Erdene T., Wilkinson K.D., Ploegh H.L., Kessler B.M. Chemistry-based functional proteomics reveals novel members of the deubiquitinating enzyme family. Chem. Biol. 2002;9:1149–1159. - PubMed
    1. Bucher P., Karplus K., Moeri N., Hofmann K. A flexible motif search technique based on generalized profiles. Comput. Chem. 1996;20:3–23. - PubMed

Supplemental References

    1. Afonine P.V., Grosse-Kunstleve R.W., Echols N., Headd J.J., Moriarty N.W., Mustyakimov M., Terwilliger T.C., Urzhumtsev A., Zwart P.H., Adams P.D. Towards automated crystallographic structure refinement with phenix.refine. Acta Crystallogr. D Biol. Crystallogr. 2012;68:352–367. - PMC - PubMed
    1. Akutsu M., Ye Y., Virdee S., Chin J.W., Komander D. Molecular basis for ubiquitin and ISG15 cross-reactivity in viral ovarian tumor domains. Proc. Natl. Acad. Sci. USA. 2011;108:2228–2233. - PMC - PubMed
    1. Battye T.G.G., Kontogiannis L., Johnson O., Powell H.R., Leslie A.G.W. iMOSFLM: a new graphical interface for diffraction-image processing with MOSFLM. Acta Crystallogr. D Biol. Crystallogr. 2011;67:271–281. - PMC - PubMed
    1. Berrow N.S., Alderton D., Sainsbury S., Nettleship J., Assenberg R., Rahman N., Stuart D.I., Owens R.J. A versatile ligation-independent cloning method suitable for high-throughput expression screening applications. Nucleic Acids Res. 2007;35:e45. - PMC - PubMed
    1. Bremm A., Freund S.M.V., Komander D. Lys11-linked ubiquitin chains adopt compact conformations and are preferentially hydrolyzed by the deubiquitinase Cezanne. Nat. Struct. Mol. Biol. 2010;17:939–947. - PMC - PubMed

Publication types