

SIRT4 coordinates the balance between lipid synthesis and catabolism by repressing malonyl CoA decarboxylase
- PMID: 23746352
- PMCID: PMC3721068
- DOI: 10.1016/j.molcel.2013.05.012
SIRT4 coordinates the balance between lipid synthesis and catabolism by repressing malonyl CoA decarboxylase
Abstract
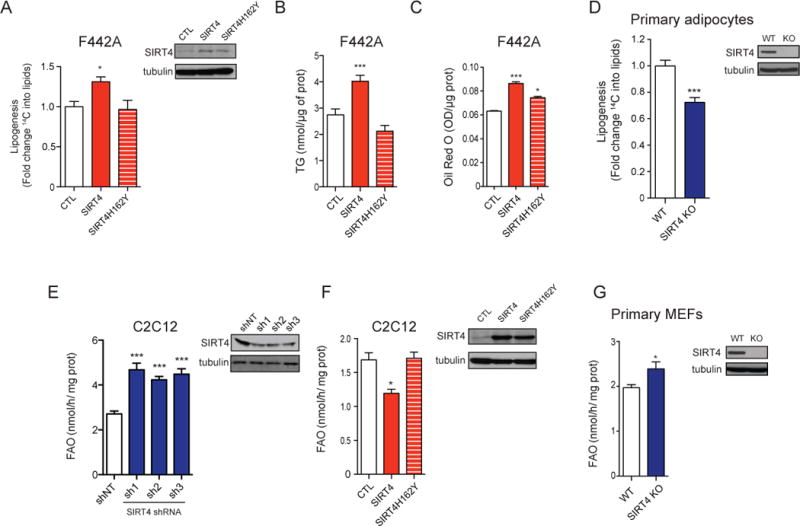
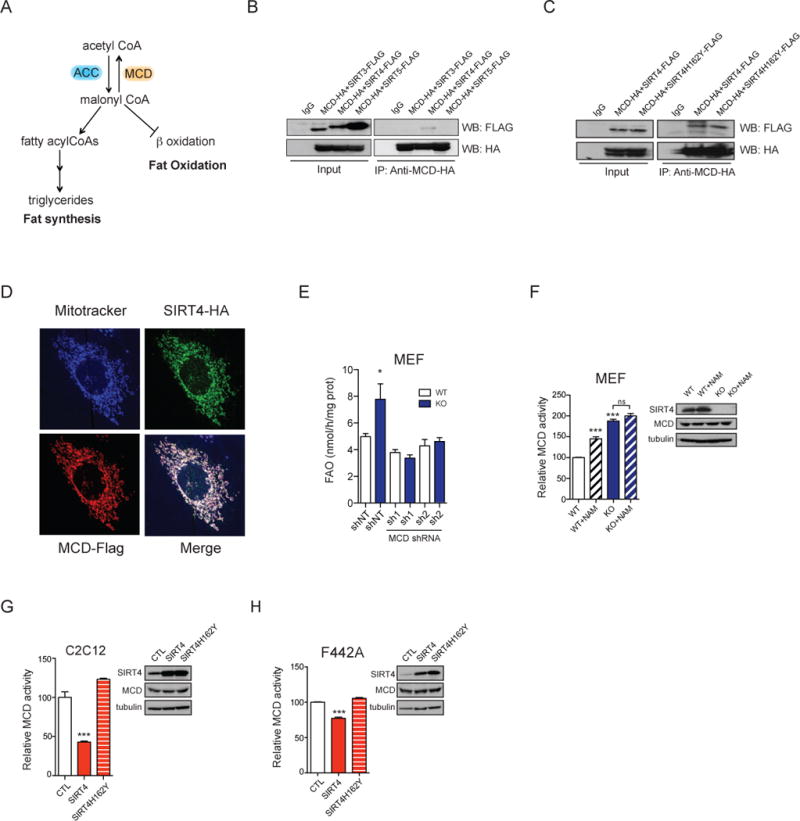
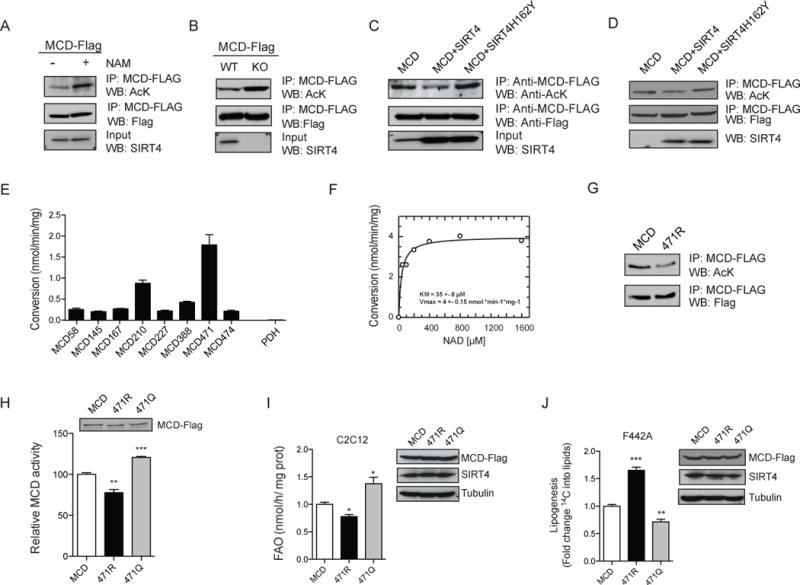
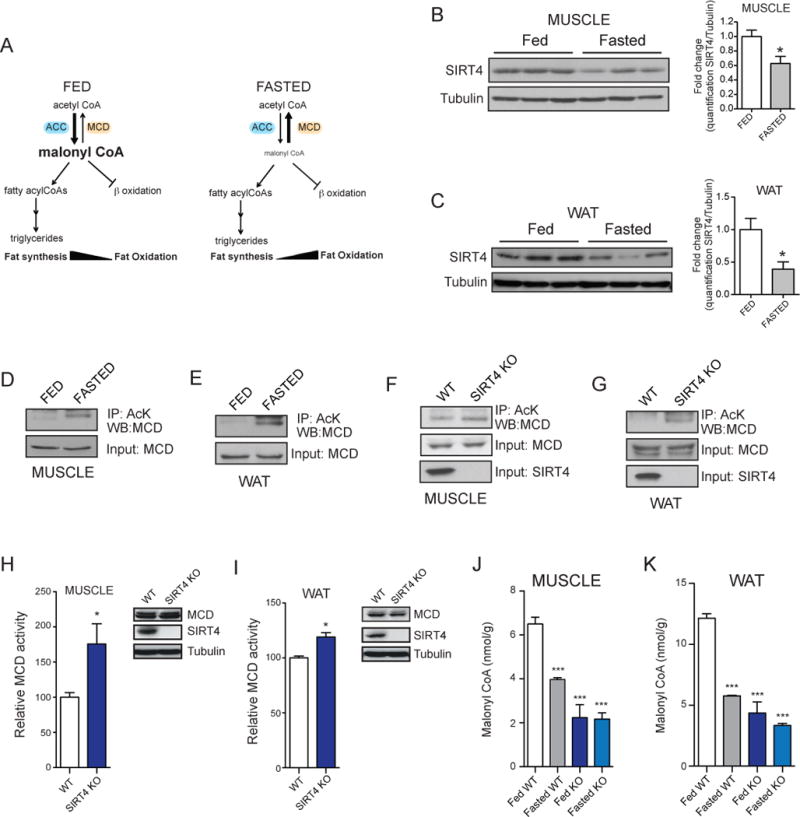
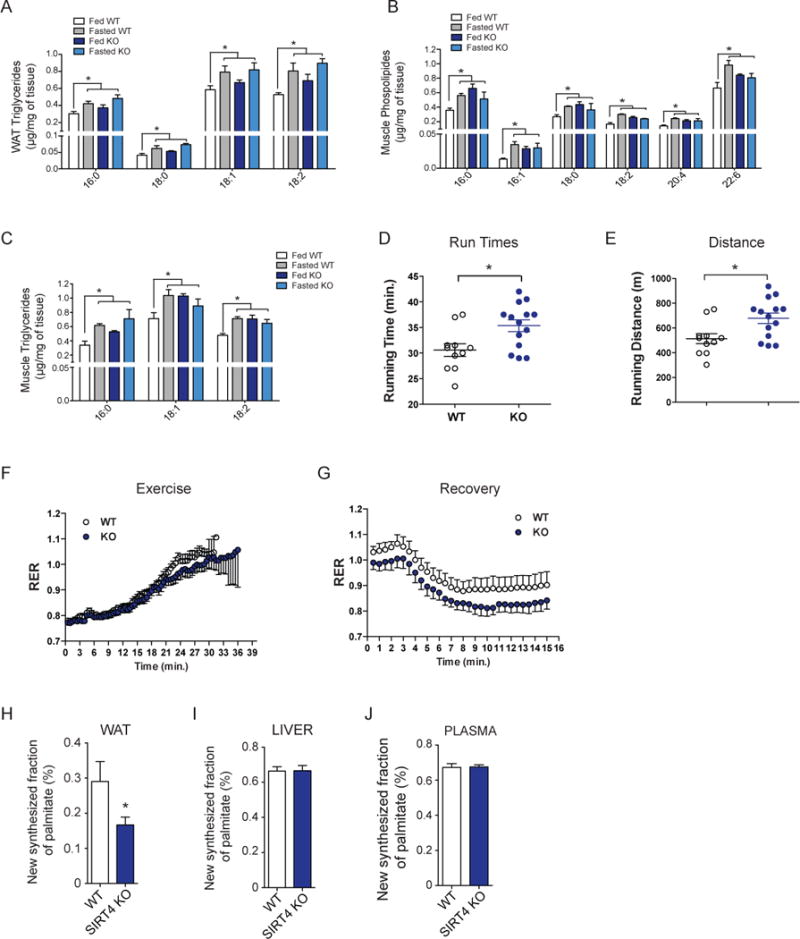
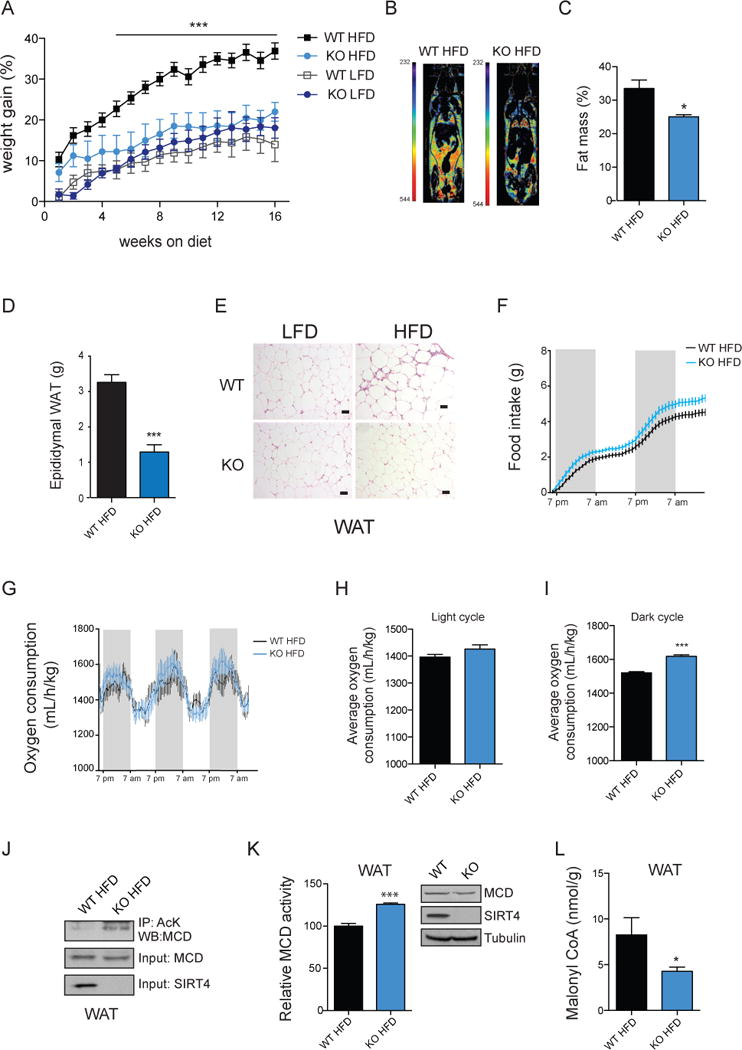
Lipid metabolism is tightly controlled by the nutritional state of the organism. Nutrient-rich conditions increase lipogenesis, whereas nutrient deprivation promotes fat oxidation. In this study, we identify the mitochondrial sirtuin, SIRT4, as a regulator of lipid homeostasis. SIRT4 is active in nutrient-replete conditions to repress fatty acid oxidation while promoting lipid anabolism. SIRT4 deacetylates and inhibits malonyl CoA decarboxylase (MCD), an enzyme that produces acetyl CoA from malonyl CoA. Malonyl CoA provides the carbon skeleton for lipogenesis and also inhibits fat oxidation. Mice lacking SIRT4 display elevated MCD activity and decreased malonyl CoA in skeletal muscle and white adipose tissue. Consequently, SIRT4 KO mice display deregulated lipid metabolism, leading to increased exercise tolerance and protection against diet-induced obesity. In sum, this work elucidates SIRT4 as an important regulator of lipid homeostasis, identifies MCD as a SIRT4 target, and deepens our understanding of the malonyl CoA regulatory axis.
Copyright © 2013 Elsevier Inc. All rights reserved.
Figures
Similar articles
-
SIRT4 represses peroxisome proliferator-activated receptor α activity to suppress hepatic fat oxidation.Mol Cell Biol. 2013 Nov;33(22):4552-61. doi: 10.1128/MCB.00087-13. Epub 2013 Sep 16. Mol Cell Biol. 2013. PMID: 24043310 Free PMC article.
-
Ribosomal protein-Mdm2-p53 pathway coordinates nutrient stress with lipid metabolism by regulating MCD and promoting fatty acid oxidation.Proc Natl Acad Sci U S A. 2014 Jun 10;111(23):E2414-22. doi: 10.1073/pnas.1315605111. Epub 2014 May 28. Proc Natl Acad Sci U S A. 2014. PMID: 24872453 Free PMC article.
-
Identification of Sirtuin4 (SIRT4) Protein Interactions: Uncovering Candidate Acyl-Modified Mitochondrial Substrates and Enzymatic Regulators.Methods Mol Biol. 2016;1436:213-39. doi: 10.1007/978-1-4939-3667-0_15. Methods Mol Biol. 2016. PMID: 27246218 Free PMC article.
-
Malonyl-CoA decarboxylase is a major regulator of myocardial fatty acid oxidation.Curr Hypertens Rep. 2005 Dec;7(6):407-11. doi: 10.1007/s11906-005-0034-z. Curr Hypertens Rep. 2005. PMID: 16386195 Review.
-
Regulation of food intake and energy expenditure by hypothalamic malonyl-CoA.Int J Obes (Lond). 2008 Sep;32 Suppl 4:S49-54. doi: 10.1038/ijo.2008.123. Int J Obes (Lond). 2008. PMID: 18719599 Review.
Cited by
-
Potent and Specific Activators for Mitochondrial Sirtuins Sirt3 and Sirt5.J Med Chem. 2022 Oct 27;65(20):14015-14031. doi: 10.1021/acs.jmedchem.2c01215. Epub 2022 Oct 13. J Med Chem. 2022. PMID: 36228194 Free PMC article.
-
NAMPT-Mediated NAD(+) Biosynthesis Is Essential for Vision In Mice.Cell Rep. 2016 Sep 27;17(1):69-85. doi: 10.1016/j.celrep.2016.08.073. Cell Rep. 2016. PMID: 27681422 Free PMC article.
-
Knockout of SIRT4 decreases chemosensitivity to 5-FU in colorectal cancer cells.Oncol Lett. 2018 Aug;16(2):1675-1681. doi: 10.3892/ol.2018.8850. Epub 2018 May 31. Oncol Lett. 2018. PMID: 30008852 Free PMC article.
-
SIRT4 Is Highly Expressed in Retinal Müller Glial Cells.Front Neurosci. 2022 Feb 4;16:840443. doi: 10.3389/fnins.2022.840443. eCollection 2022. Front Neurosci. 2022. PMID: 35185463 Free PMC article.
-
Granulosa-Lutein Cell Sirtuin Gene Expression Profiles Differ between Normal Donors and Infertile Women.Int J Mol Sci. 2019 Dec 31;21(1):295. doi: 10.3390/ijms21010295. Int J Mol Sci. 2019. PMID: 31906251 Free PMC article. Clinical Trial.
References
-
- Ahuja N, Schwer B, Carobbio S, Waltregny D, North BJ, Castronovo V, Maechler P, Verdin E. Regulation of insulin secretion by SIRT4, a mitochondrial ADP-ribosyltransferase. J Biol Chem. 2007;282:33583–33592. - PubMed
-
- Bassel-Duby R, Olson EN. Signaling pathways in skeletal muscle remodeling. Annu Rev Biochem. 2006;75:19–37. - PubMed
-
- Dean D, Daugaard JR, Young ME, Saha A, Vavvas D, Asp S, Kiens B, Kim KH, Witters L, Richter EA, et al. Exercise diminishes the activity of acetyl-CoA carboxylase in human muscle. Diabetes. 2000;49:1295–1300. - PubMed
-
- Djian P, Phillips M, Green H. The activation of specific gene transcription in the adipose conversion of 3T3 cells. J Cell Physiol. 1985;124:554–556. - PubMed
Publication types
MeSH terms
Substances
Grants and funding
- R01 DK067509/DK/NIDDK NIH HHS/United States
- R01DK19514/DK/NIDDK NIH HHS/United States
- AG-NS-0573-09/AG/NIA NIH HHS/United States
- 1R01HL101189/HL/NHLBI NIH HHS/United States
- U19AI091175-01/AI/NIAID NIH HHS/United States
- DK59637/DK/NIDDK NIH HHS/United States
- DK58132-01A2/DK/NIDDK NIH HHS/United States
- R01 DK019514/DK/NIDDK NIH HHS/United States
- R01 HL101189/HL/NHLBI NIH HHS/United States
- U19 AI091175/AI/NIAID NIH HHS/United States
- R01 DK058132/DK/NIDDK NIH HHS/United States
- F32 DK093256/DK/NIDDK NIH HHS/United States
- 2P01DK05398/DK/NIDDK NIH HHS/United States
- P60DK020541/DK/NIDDK NIH HHS/United States
- R01DK67509/DK/NIDDK NIH HHS/United States
- 1F32DK093256-01/DK/NIDDK NIH HHS/United States
- R01 AG032375/AG/NIA NIH HHS/United States
- P60 DK020541/DK/NIDDK NIH HHS/United States
- U24 DK059637/DK/NIDDK NIH HHS/United States
- AG032375/AG/NIA NIH HHS/United States
LinkOut - more resources
Full Text Sources
Other Literature Sources
Molecular Biology Databases
Research Materials
