Differential contribution of insulin and amino acids to the mTORC1-autophagy pathway in the liver and muscle
- PMID: 23744068
- PMCID: PMC3774374
- DOI: 10.1074/jbc.M113.456228
Differential contribution of insulin and amino acids to the mTORC1-autophagy pathway in the liver and muscle
Abstract
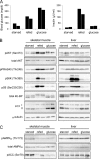
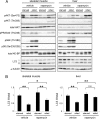
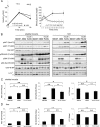
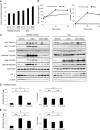
Autophagy is a highly inducible intracellular degradation process. It is generally induced by nutrient starvation and suppressed by food intake. Mammalian (or mechanistic) target of rapamycin complex 1 (mTORC1) is considered to be the major regulator of autophagy, but the precise mechanism of in vivo regulation remains to be fully characterized. Here, we examined the autophagy-suppressive effect of glucose, insulin, and amino acids in the liver and muscle in mice starved for 1 day. Refeeding after starvation with a standard mouse chow rapidly suppressed autophagy in both tissues, and this suppression was inhibited by rapamycin administration almost completely in the liver and partially in muscle, confirming that mTORC1 is indeed a crucial regulator in vivo. As glucose administration showed no major suppressive effect on autophagy, we examined the role of insulin and amino acids using hyperinsulinemic-euglycemic clamp and intravenous amino acid infusion techniques. Insulin administration showed a clear effect on the mTORC1-autophagy pathway in muscle, but had only a very weak effect in the liver. By contrast, amino acids were able to regulate the mTORC1-autophagy pathway in the liver, but less effectively in muscle. These results suggest that autophagy is differentially regulated by insulin and amino acids in a tissue-dependent manner.
Keywords: Amino Acid; Autophagy; Insulin; Protein Degradation; mTOR Complex (mTORC).
Figures


Similar articles
-
Hyperactivation of mammalian target of rapamycin complex 1 (mTORC1) promotes breast cancer progression through enhancing glucose starvation-induced autophagy and Akt signaling.J Biol Chem. 2014 Jan 10;289(2):1164-73. doi: 10.1074/jbc.M113.526335. Epub 2013 Nov 25. J Biol Chem. 2014. PMID: 24275666 Free PMC article.
-
Let-7 coordinately suppresses components of the amino acid sensing pathway to repress mTORC1 and induce autophagy.Cell Metab. 2014 Oct 7;20(4):626-38. doi: 10.1016/j.cmet.2014.09.001. Cell Metab. 2014. PMID: 25295787 Free PMC article.
-
Suppression of the mTORC1/STAT3/Notch1 pathway by activated AMPK prevents hepatic insulin resistance induced by excess amino acids.Am J Physiol Endocrinol Metab. 2014 Jan 15;306(2):E197-209. doi: 10.1152/ajpendo.00202.2013. Epub 2013 Dec 3. Am J Physiol Endocrinol Metab. 2014. Retraction in: Am J Physiol Endocrinol Metab. 2022 Oct 1;323(4):E403. doi: 10.1152/ajpendo.00202.2013_ret PMID: 24302004 Free PMC article. Retracted.
-
Integration of signals generated by nutrients, hormones, and exercise in skeletal muscle.Am J Clin Nutr. 2014 Jan;99(1):237S-242S. doi: 10.3945/ajcn.113.068387. Epub 2013 Nov 27. Am J Clin Nutr. 2014. PMID: 24284445 Free PMC article. Review.
-
Amino acid homeostasis and signalling in mammalian cells and organisms.Biochem J. 2017 May 25;474(12):1935-1963. doi: 10.1042/BCJ20160822. Biochem J. 2017. PMID: 28546457 Free PMC article. Review.
Cited by
-
Relationship Between Oxidative Stress, ER Stress, and Inflammation in Type 2 Diabetes: The Battle Continues.J Clin Med. 2019 Sep 4;8(9):1385. doi: 10.3390/jcm8091385. J Clin Med. 2019. PMID: 31487953 Free PMC article. Review.
-
Autophagy mediates hepatic GRK2 degradation to facilitate glucagon-induced metabolic adaptation to fasting.FASEB J. 2020 Jan;34(1):399-409. doi: 10.1096/fj.201901444R. Epub 2019 Nov 22. FASEB J. 2020. PMID: 31914606 Free PMC article.
-
Importance of Serum Amino Acid Profile for Induction of Hepatic Steatosis under Protein Malnutrition.Sci Rep. 2018 Apr 3;8(1):5461. doi: 10.1038/s41598-018-23640-8. Sci Rep. 2018. PMID: 29615653 Free PMC article.
-
Regulation of autophagy by amino acids and MTOR-dependent signal transduction.Amino Acids. 2015 Oct;47(10):2037-63. doi: 10.1007/s00726-014-1765-4. Epub 2014 Jun 1. Amino Acids. 2015. PMID: 24880909 Free PMC article. Review.
-
Methods for Measuring Autophagy in Mice.Cells. 2017 Jun 8;6(2):14. doi: 10.3390/cells6020014. Cells. 2017. PMID: 28594368 Free PMC article. Review.
References
-
- Tooze S. A., Yoshimori T. (2010) The origin of the autophagosomal membrane. Nat. Cell Biol. 12, 831–835 - PubMed
-
- Mizushima N., Yoshimori T., Ohsumi Y. (2011) The Role of Atg Proteins in Autophagosome Formation. Annu. Rev. Cell Dev. Biol. 27, 107–132 - PubMed
-
- Mizushima N., Komatsu M. (2011) Autophagy: renovation of cells and tissues. Cell 147, 728–741 - PubMed
Publication types
MeSH terms
Substances
LinkOut - more resources
Full Text Sources
Other Literature Sources
Medical
Research Materials
Miscellaneous

