MHCII is required for α-synuclein-induced activation of microglia, CD4 T cell proliferation, and dopaminergic neurodegeneration
- PMID: 23739956
- PMCID: PMC3903980
- DOI: 10.1523/JNEUROSCI.5610-12.2013
MHCII is required for α-synuclein-induced activation of microglia, CD4 T cell proliferation, and dopaminergic neurodegeneration
Abstract
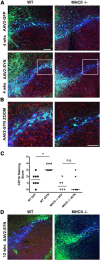
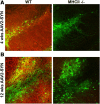
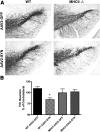
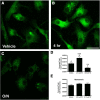
Accumulation of α-synuclein (α-syn) in the brain is a core feature of Parkinson disease (PD) and leads to microglial activation, production of inflammatory cytokines and chemokines, T-cell infiltration, and neurodegeneration. Here, we have used both an in vivo mouse model induced by viral overexpression of α-syn as well as in vitro systems to study the role of the MHCII complex in α-syn-induced neuroinflammation and neurodegeneration. We find that in vivo, expression of full-length human α-syn causes striking induction of MHCII expression by microglia, while knock-out of MHCII prevents α-syn-induced microglial activation, antigen presentation, IgG deposition, and the degeneration of dopaminergic neurons. In vitro, treatment of microglia with aggregated α-syn leads to activation of antigen processing and presentation of antigen sufficient to drive CD4 T-cell proliferation and to trigger cytokine release. These results indicate a central role for microglial MHCII in the activation of both the innate and adaptive immune responses to α-syn in PD and suggest that the MHCII signaling complex may be a target of neuroprotective therapies for the disease.
Figures


Similar articles
-
Allelic difference in Mhc2ta confers altered microglial activation and susceptibility to α-synuclein-induced dopaminergic neurodegeneration.Neurobiol Dis. 2017 Oct;106:279-290. doi: 10.1016/j.nbd.2017.07.016. Epub 2017 Jul 20. Neurobiol Dis. 2017. PMID: 28736195
-
Inhibition of the JAK/STAT Pathway Protects Against α-Synuclein-Induced Neuroinflammation and Dopaminergic Neurodegeneration.J Neurosci. 2016 May 4;36(18):5144-59. doi: 10.1523/JNEUROSCI.4658-15.2016. J Neurosci. 2016. PMID: 27147665 Free PMC article.
-
T cell infiltration and upregulation of MHCII in microglia leads to accelerated neuronal loss in an α-synuclein rat model of Parkinson's disease.J Neuroinflammation. 2020 Aug 15;17(1):242. doi: 10.1186/s12974-020-01911-4. J Neuroinflammation. 2020. PMID: 32799878 Free PMC article.
-
Alpha-Synuclein as a Prominent Actor in the Inflammatory Synaptopathy of Parkinson's Disease.Int J Mol Sci. 2021 Jun 17;22(12):6517. doi: 10.3390/ijms22126517. Int J Mol Sci. 2021. PMID: 34204581 Free PMC article. Review.
-
Pathological α-synuclein exacerbates the progression of Parkinson's disease through microglial activation.Toxicol Lett. 2017 Jan 4;265:30-37. doi: 10.1016/j.toxlet.2016.11.002. Epub 2016 Nov 16. Toxicol Lett. 2017. PMID: 27865851 Review.
Cited by
-
Identification of Multiple QTLs Linked to Neuropathology in the Engrailed-1 Heterozygous Mouse Model of Parkinson's Disease.Sci Rep. 2016 Aug 23;6:31701. doi: 10.1038/srep31701. Sci Rep. 2016. PMID: 27550741 Free PMC article.
-
Ex vivo expansion of dysfunctional regulatory T lymphocytes restores suppressive function in Parkinson's disease.NPJ Parkinsons Dis. 2021 May 13;7(1):41. doi: 10.1038/s41531-021-00188-5. NPJ Parkinsons Dis. 2021. PMID: 33986285 Free PMC article.
-
Neurons and Glia Interplay in α-Synucleinopathies.Int J Mol Sci. 2021 May 8;22(9):4994. doi: 10.3390/ijms22094994. Int J Mol Sci. 2021. PMID: 34066733 Free PMC article. Review.
-
Effect of chemokine CC ligand 2 (CCL2) on α‑synuclein‑induced microglia proliferation and neuronal apoptosis.Mol Med Rep. 2018 Nov;18(5):4213-4218. doi: 10.3892/mmr.2018.9468. Epub 2018 Sep 10. Mol Med Rep. 2018. PMID: 30221727 Free PMC article.
-
Investigating the Convergent Mechanisms between Major Depressive Disorder and Parkinson's Disease.Complex Psychiatry. 2021 Feb;6(3-4):47-61. doi: 10.1159/000512657. Epub 2020 Oct 29. Complex Psychiatry. 2021. PMID: 34883500 Free PMC article. Review.
References
Publication types
MeSH terms
Substances
Grants and funding
LinkOut - more resources
Full Text Sources
Other Literature Sources
Molecular Biology Databases
Research Materials
Miscellaneous
