

High glucose induces upregulation of scavenger receptors and promotes maturation of dendritic cells
- PMID: 23718574
- PMCID: PMC3685538
- DOI: 10.1186/1475-2840-12-80
High glucose induces upregulation of scavenger receptors and promotes maturation of dendritic cells
Abstract
Background: Both hyperglycaemia and dendritic cells (DCs) play causative roles in atherosclerosis. However, whether they interact in atherosclerosis remains uncertain. Therefore, we examined whether high glucose could regulate the expression of scavenger receptors responsible for oxidised low-density lipoprotein (oxLDL) uptake in DCs, a critical step in atherogenesis. In addition, we investigated the impact of glucose on DC maturation regarding changes in phenotype and cytokine secretion.
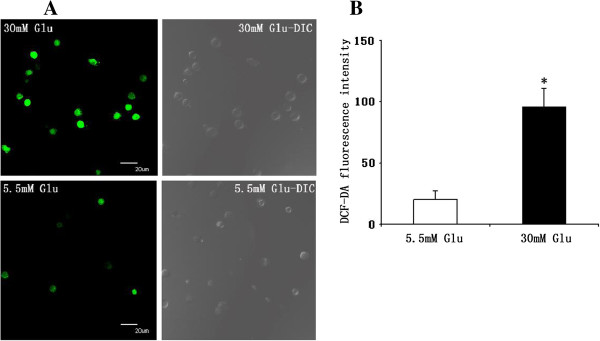
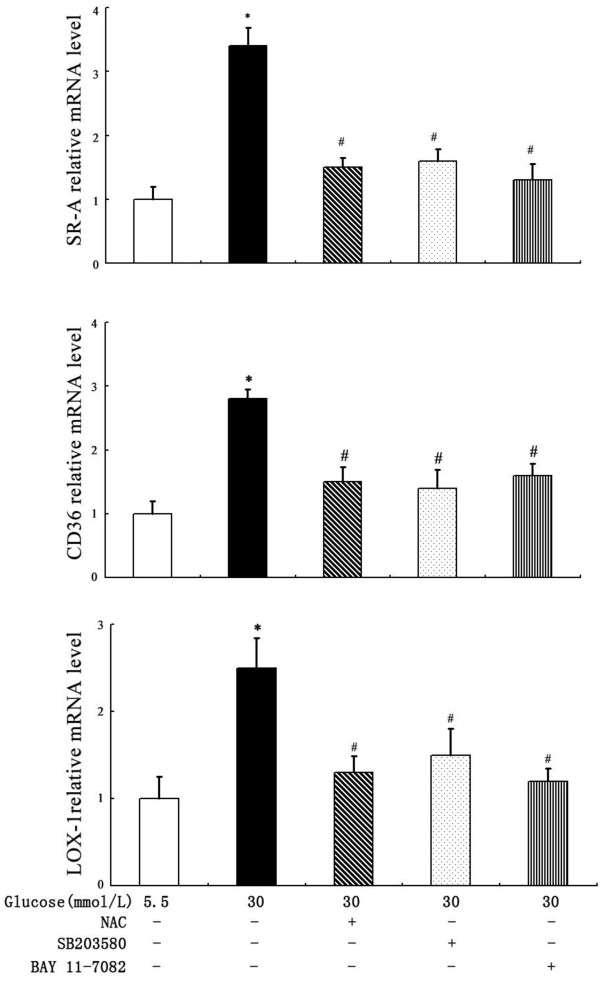
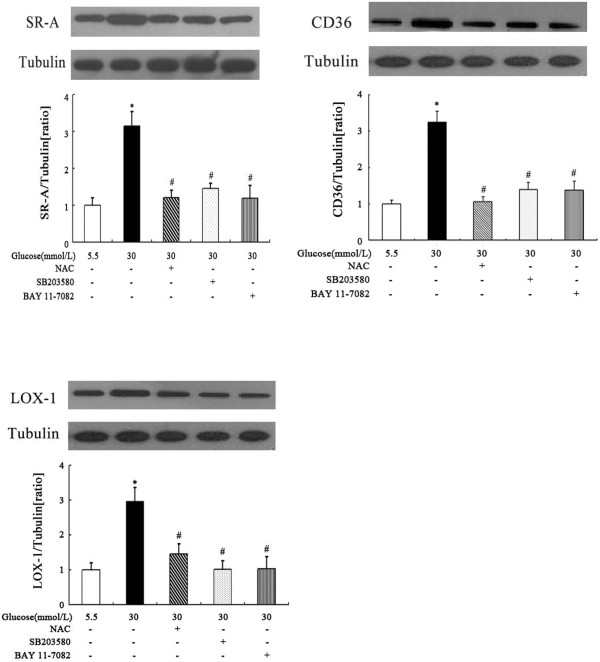
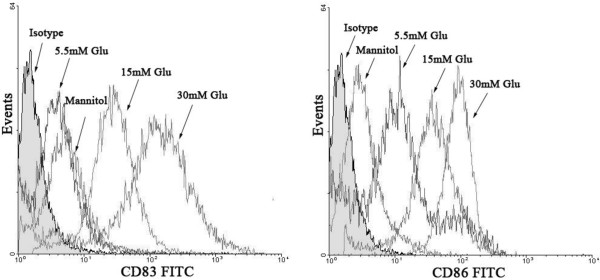
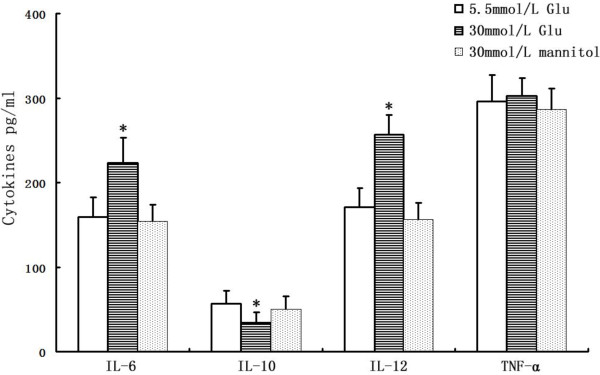
Methods: Immature DCs were cultured with different concentrations of glucose (5.5 mmol/L, 15 mmol/L, 30 mmol/L) in the absence or presence of N-acetylcysteine (NAC), SB203580 or Bay11-7082 for 24 hours. We used 30 mmol/L mannitol as a high-osmolarity control treatment. The expression of the scavenger receptors SR-A, CD36 and LOX-1 was determined by real-time PCR and western blot analysis. Furthermore, DCs were incubated with DiI-labelled oxLDL. The DiI-oxLDL-incorporated fraction was investigated by flow cytometry analysis. The intracellular production of ROS in DCs was measured by dichlorodihydrofluorescein (DCF) fluorescence using confocal microscopy. Finally, flow cytometry analysis was used to investigate immunophenotypic protein expression (CD83 and CD86). Supernatant cytokine measurements were used for immune function assays.
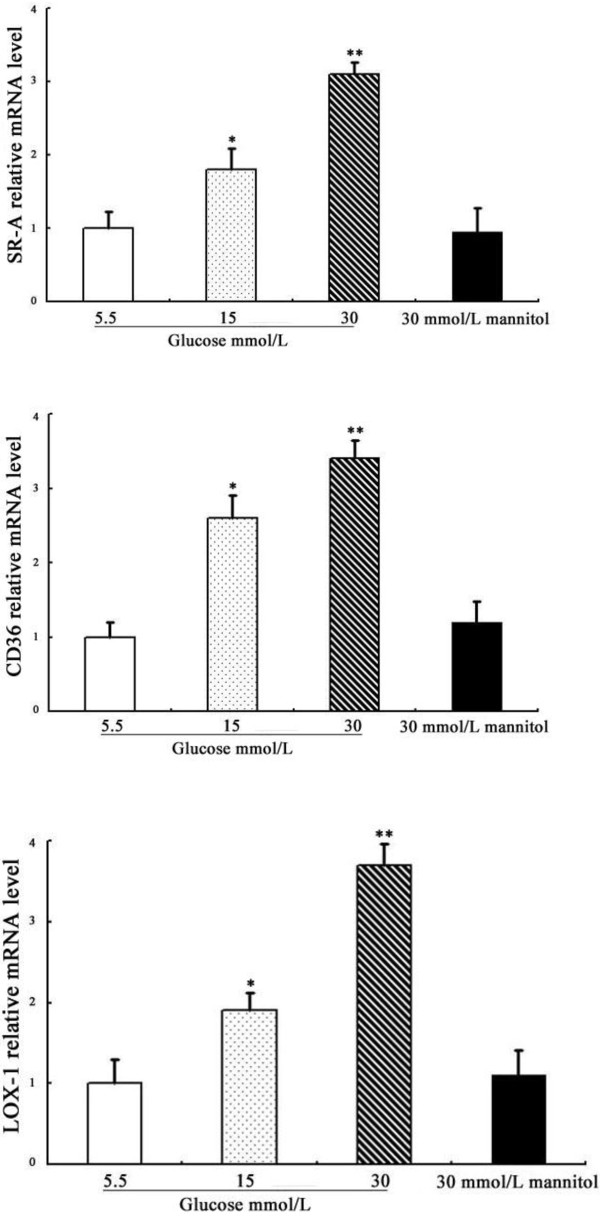
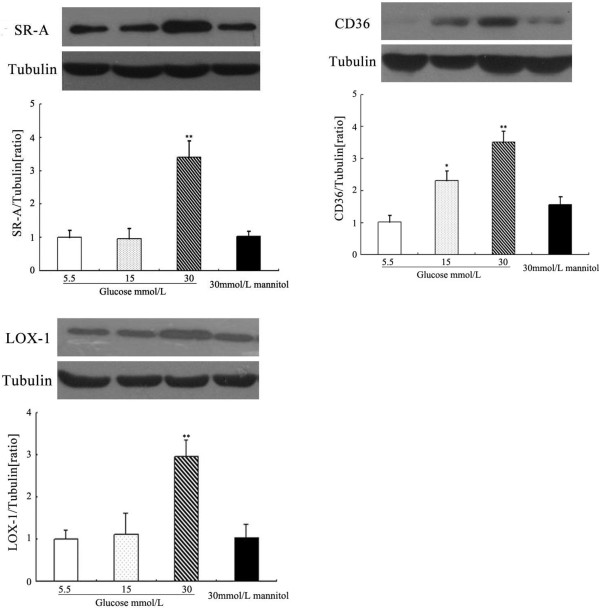
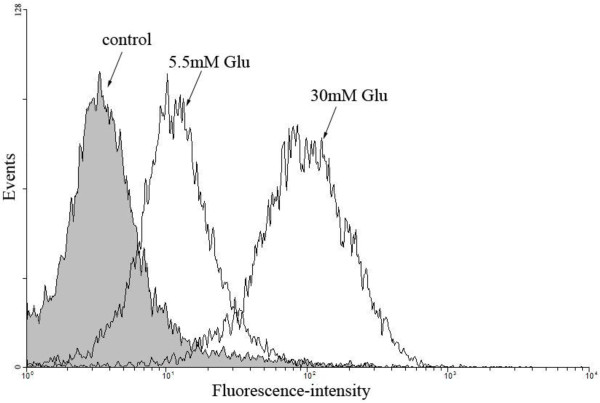
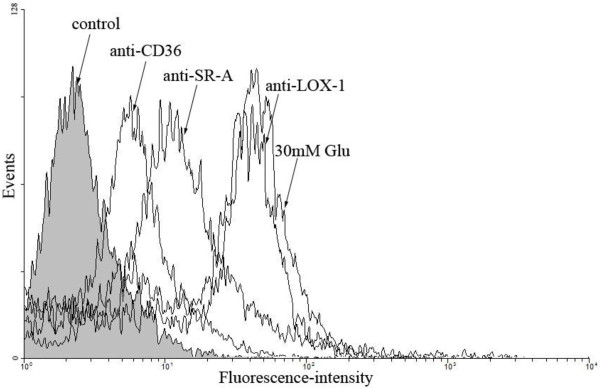
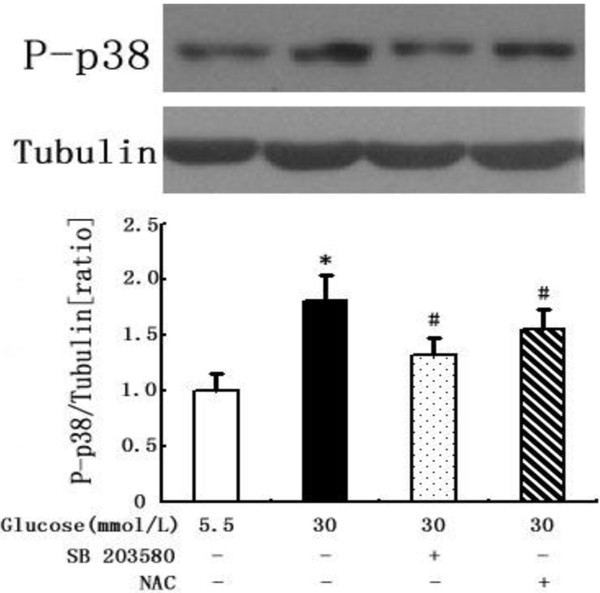
Results: The incubation of DCs with glucose enhanced, in a dose-dependent manner, the gene and protein expression of SR-A, CD36 and LOX-1. This effect was partially abolished by NAC, SB203580 and Bay11-7082. Incubation of DCs with mannitol (30 mmol/L) did not enhance these scavenger receptors' expression. High glucose upregulated the production of ROS and expression of p38 MAPK in DCs. NAC partially reversed p38 MAPK upregulation. High glucose increased the oxLDL-uptake capacity of DCs. Blockage of the scavenger receptors SR-A and CD36 reduced oxLDL uptake, but blockage of LOX-1 did not. Furthermore, high-glucose (15 mmol/L or 30 mmol/L) treatment increased CD86 and CD83 in DCs. High glucose also increased IL-6 and IL-12 secretion and decreased IL-10 secretion.
Conclusion: High glucose can increase the expression of the scavenger receptors SR-A, CD36 and LOX-1, which can increase the oxLDL-uptake capacity of DCs. High glucose induces a proinflammatory cytokine profile in human DCs, leading to DC maturation. These results support the hypothesis that atherosclerosis is aggravated by hyperglycaemia-induced DC activation and oxLDL uptake.
Figures
Similar articles
-
Dioscin attenuates oxLDL uptake and the inflammatory reaction of dendritic cells under high glucose conditions by blocking p38 MAPK.Mol Med Rep. 2020 Jan;21(1):304-310. doi: 10.3892/mmr.2019.10806. Epub 2019 Nov 6. Mol Med Rep. 2020. PMID: 31746382 Free PMC article.
-
Insulin enhances dendritic cell maturation and scavenger receptor-mediated uptake of oxidised low-density lipoprotein.J Diabetes Complications. 2015 May-Jun;29(4):465-71. doi: 10.1016/j.jdiacomp.2015.03.005. Epub 2015 Mar 16. J Diabetes Complications. 2015. PMID: 25813675
-
oxLDL uptake by dendritic cells induces upregulation of scavenger-receptors, maturation and differentiation.Atherosclerosis. 2009 Aug;205(2):442-50. doi: 10.1016/j.atherosclerosis.2009.01.002. Epub 2009 Jan 9. Atherosclerosis. 2009. PMID: 19203752
-
Scavenger receptors and oxidized low density lipoproteins.Clin Chim Acta. 1999 Aug;286(1-2):191-205. doi: 10.1016/s0009-8981(99)00101-1. Clin Chim Acta. 1999. PMID: 10511292 Review.
-
Upregulated LOX-1 Receptor: Key Player of the Pathogenesis of Atherosclerosis.Curr Atheroscler Rep. 2019 Jul 27;21(10):38. doi: 10.1007/s11883-019-0801-y. Curr Atheroscler Rep. 2019. PMID: 31350594 Review.
Cited by
-
Characteristics of immunogenic and tolerogenic dendritic cells within the arterial wall in atherosclerosis and in vitro.Int J Clin Exp Med. 2014 Dec 15;7(12):4846-56. eCollection 2014. Int J Clin Exp Med. 2014. PMID: 25663981 Free PMC article.
-
CD36 Promotes Podocyte Apoptosis by Activating the Pyrin Domain-Containing-3 (NLRP3) Inflammasome in Primary Nephrotic Syndrome.Med Sci Monit. 2018 Sep 27;24:6832-6839. doi: 10.12659/MSM.909810. Med Sci Monit. 2018. PMID: 30258045 Free PMC article.
-
CD36 overexpression: a possible etiopathogenic mechanism of atherosclerosis in patients with prediabetes and diabetes.Diabetol Metab Syndr. 2017 Jul 18;9:55. doi: 10.1186/s13098-017-0253-x. eCollection 2017. Diabetol Metab Syndr. 2017. PMID: 28729885 Free PMC article.
-
p38 mitogen-activated protein kinase is involved in arginase-II-mediated eNOS-uncoupling in obesity.Cardiovasc Diabetol. 2014 Jul 18;13:113. doi: 10.1186/s12933-014-0113-z. Cardiovasc Diabetol. 2014. PMID: 25034973 Free PMC article.
-
Dioscin attenuates oxLDL uptake and the inflammatory reaction of dendritic cells under high glucose conditions by blocking p38 MAPK.Mol Med Rep. 2020 Jan;21(1):304-310. doi: 10.3892/mmr.2019.10806. Epub 2019 Nov 6. Mol Med Rep. 2020. PMID: 31746382 Free PMC article.
References
-
- UK prospective Diabetes Study (UKPDS) group. Intensive blood-glucose control with sulphonyureas or insulin compared with conventional treatment and risk of complications in patients with type 2 diabetes. Lancet. 1998;352:837–853. - PubMed
Publication types
MeSH terms
Substances
LinkOut - more resources
Full Text Sources
Other Literature Sources
Medical
Research Materials
