Serum miR-21 as a diagnostic and prognostic biomarker in colorectal cancer
- PMID: 23704278
- PMCID: PMC3687369
- DOI: 10.1093/jnci/djt101
Serum miR-21 as a diagnostic and prognostic biomarker in colorectal cancer
Abstract
Background: The oncogenic microRNAs (miRNAs) miR-21 and miR-31 negatively regulate tumor-suppressor genes. Their potential as serum biomarkers has not been determined in human colorectal cancer (CRC).
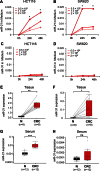
Methods: To determine whether miR-21 and miR-31 are secretory miRNAs, we screened expression in medium from 2 CRC cell lines, which was followed by serum analysis from 12 CRC patients and 12 control subjects. We validated expression of candidate miRNAs in serum samples from an independent cohort of 186 CRC patients, 60 postoperative patients, 43 advanced adenoma patients, and 53 control subjects. We analyzed miR-21 expression in 166 matched primary CRC tissues to determine whether serum miRNAs reflect expression in CRC. Patient survival analyses were performed by Kaplan-Meier analyses and Cox regression models. All statistical tests were two-sided.
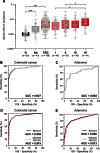
Results: Although miR-21 was secreted from CRC cell lines and upregulated in serum of CRC patients, no statistically significant differences were observed in serum miR-31 expression between CRC patients and control subjects. In the validation cohort, miR-21 levels were statistically significantly elevated in preoperative serum from patients with adenomas (P < .001) and CRCs (P < .001). Importantly, miR-21 expression dropped in postoperative serum from patients who underwent curative surgery (P < .001). Serum miR-21 levels robustly distinguished adenoma (area under the curve [AUC] = 0.813; 95% confidence interval [CI] = 0.691 to 0.910) and CRC (AUC = 0.919; 95% CI = 0.867 to 0.958) patients from control subjects. High miR-21 expression in serum and tissue was statistically significantly associated with tumor size, distant metastasis, and poor survival. Moreover, serum miR-21 was an independent prognostic marker for CRC (hazard ratio = 4.12; 95% CI = 1.10 to 15.4; P = .03).
Conclusions: Serum miR-21 is a promising biomarker for the early detection and prognosis of CRC.
Figures


Comment in
-
MicroRNA-21 in colorectal cancer: "Just another brick in the wall"?J Natl Cancer Inst. 2013 Jun 19;105(12):840-1. doi: 10.1093/jnci/djt128. Epub 2013 May 23. J Natl Cancer Inst. 2013. PMID: 23704279 No abstract available.
-
Response.J Natl Cancer Inst. 2014 Mar;106(3):djt458. doi: 10.1093/jnci/djt458. Epub 2014 Mar 1. J Natl Cancer Inst. 2014. PMID: 24586104 No abstract available.
-
Re: Serum miR-21 as a diagnostic and prognostic biomarker in colorectal cancer.J Natl Cancer Inst. 2014 Mar;106(3):djt457. doi: 10.1093/jnci/djt457. Epub 2014 Mar 1. J Natl Cancer Inst. 2014. PMID: 24586105 No abstract available.
Similar articles
-
Circulating microRNA-1290 as a novel diagnostic and prognostic biomarker in human colorectal cancer.Ann Oncol. 2016 Oct;27(10):1879-86. doi: 10.1093/annonc/mdw279. Epub 2016 Aug 8. Ann Oncol. 2016. PMID: 27502702
-
Identification of a metastasis-specific MicroRNA signature in human colorectal cancer.J Natl Cancer Inst. 2015 Feb 6;107(3):dju492. doi: 10.1093/jnci/dju492. Print 2015 Mar. J Natl Cancer Inst. 2015. PMID: 25663689 Free PMC article.
-
Serum miR-200c is a novel prognostic and metastasis-predictive biomarker in patients with colorectal cancer.Ann Surg. 2014 Apr;259(4):735-43. doi: 10.1097/SLA.0b013e3182a6909d. Ann Surg. 2014. PMID: 23982750 Free PMC article.
-
A Systematic Review of Diagnostic Performance of Circulating MicroRNAs in Colorectal Cancer Detection with a Focus on Early-Onset Colorectal Cancer.Int J Mol Sci. 2024 Sep 3;25(17):9565. doi: 10.3390/ijms25179565. Int J Mol Sci. 2024. PMID: 39273512 Free PMC article. Review.
-
MicroRNA-92a as a potential biomarker in diagnosis of colorectal cancer: a systematic review and meta-analysis.PLoS One. 2014 Feb 14;9(2):e88745. doi: 10.1371/journal.pone.0088745. eCollection 2014. PLoS One. 2014. PMID: 24551148 Free PMC article. Review.
Cited by
-
Advances in microRNAs as Emerging Biomarkers for Colorectal Cancer Early Detection and Diagnosis.Int J Mol Sci. 2024 Oct 15;25(20):11060. doi: 10.3390/ijms252011060. Int J Mol Sci. 2024. PMID: 39456841 Free PMC article. Review.
-
Daple is a novel non-receptor GEF required for trimeric G protein activation in Wnt signaling.Elife. 2015 Jun 30;4:e07091. doi: 10.7554/eLife.07091. Elife. 2015. PMID: 26126266 Free PMC article.
-
Stromal expression of miR-21 in T3-4a colorectal cancer is an independent predictor of early tumor relapse.BMC Gastroenterol. 2015 Jan 22;15:2. doi: 10.1186/s12876-015-0227-0. BMC Gastroenterol. 2015. PMID: 25609245 Free PMC article. Review.
-
Cross-Kingdom Interaction of miRNAs and Gut Microbiota with Non-Invasive Diagnostic and Therapeutic Implications in Colorectal Cancer.Int J Mol Sci. 2023 Jun 23;24(13):10520. doi: 10.3390/ijms241310520. Int J Mol Sci. 2023. PMID: 37445698 Free PMC article. Review.
-
MicroRNA-21 Plays Multiple Oncometabolic Roles in Colitis-Associated Carcinoma and Colorectal Cancer via the PI3K/AKT, STAT3, and PDCD4/TNF-α Signaling Pathways in Zebrafish.Cancers (Basel). 2021 Nov 6;13(21):5565. doi: 10.3390/cancers13215565. Cancers (Basel). 2021. PMID: 34771727 Free PMC article.
References
-
- Siegel R, Naishadham D, Jemal A. Cancer statistics, 2012. CA Cancer J Clin. 2012;62(1):10–29 - PubMed
-
- Weizman AV, Nguyen GC. Colon cancer screening in 2010: an up-date. Minerva Gastroenterol Dietol. 2010;56(2):181–188 - PubMed
-
- Hewitson P, Glasziou P, Watson E, Towler B, Irwig L. Cochrane systematic review of colorectal cancer screening using the fecal occult blood test (hemoccult): an update. Am J Gastroenterol. 2008;103(6):1541–1549 - PubMed
-
- Walsh JM, Terdiman JP. Colorectal cancer screening: scientific review. JAMA. 2003;289(10):1288–1296 - PubMed
Publication types
MeSH terms
Substances
Grants and funding
LinkOut - more resources
Full Text Sources
Other Literature Sources
Medical

