

Mapping HIV clustering: a strategy for identifying populations at high risk of HIV infection in sub-Saharan Africa
- PMID: 23692994
- PMCID: PMC3669110
- DOI: 10.1186/1476-072X-12-28
Mapping HIV clustering: a strategy for identifying populations at high risk of HIV infection in sub-Saharan Africa
Abstract
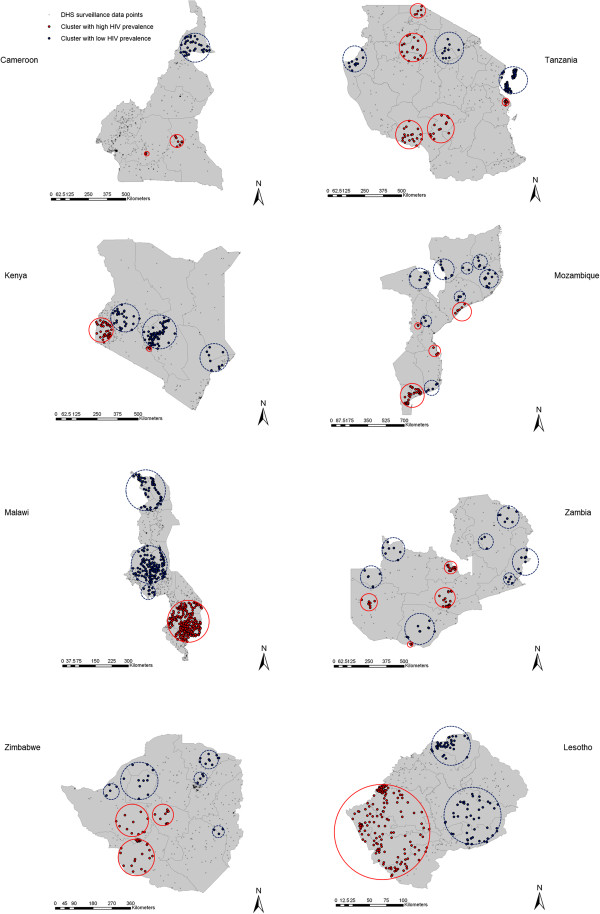
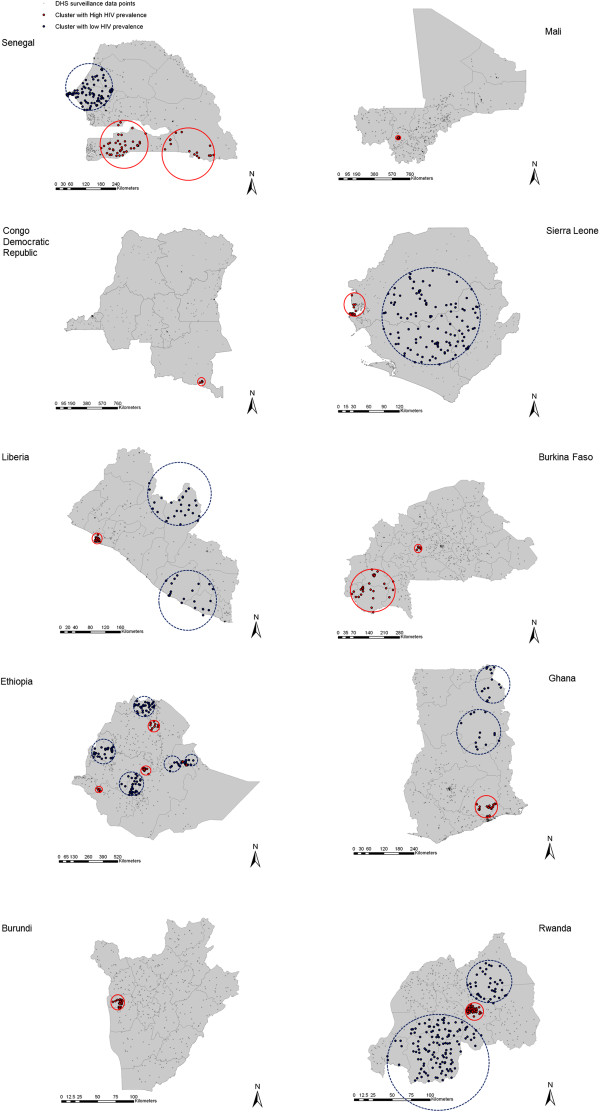
Background: The geographical structure of an epidemic is ultimately a consequence of the drivers of the epidemic and the population susceptible to the infection. The 'know your epidemic' concept recognizes this geographical feature as a key element for identifying populations at higher risk of HIV infection where prevention interventions should be targeted. In an effort to clarify specific drivers of HIV transmission and identify priority populations for HIV prevention interventions, we conducted a comprehensive mapping of the spatial distribution of HIV infection across sub-Saharan Africa (SSA).
Methods: The main source of data for our study was the Demographic and Health Survey conducted in 20 countries from SSA. We identified and compared spatial clusters with high and low numbers of HIV infections in each country using Kulldorff spatial scan test. The test locates areas with higher and lower numbers of HIV infections than expected under spatial randomness. For each identified cluster, a likelihood ratio test was computed. A P-value was determined through Monte Carlo simulations to evaluate the statistical significance of each cluster.
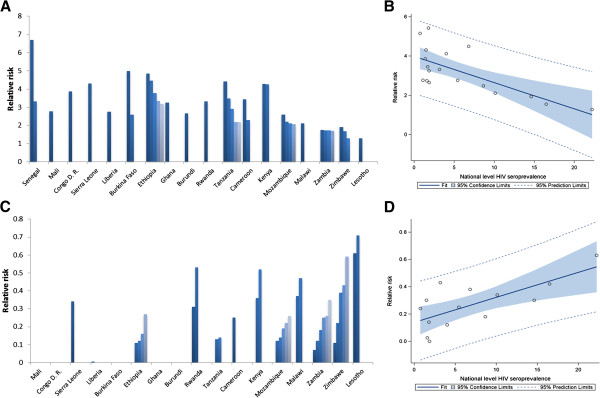
Results: Our results suggest stark geographic variations in HIV transmission patterns within and across countries of SSA. About 14% of the population in SSA is located in areas of intense HIV epidemics. Meanwhile, another 16% of the population is located in areas of low HIV prevalence, where some behavioral or biological protective factors appear to have slowed HIV transmission.
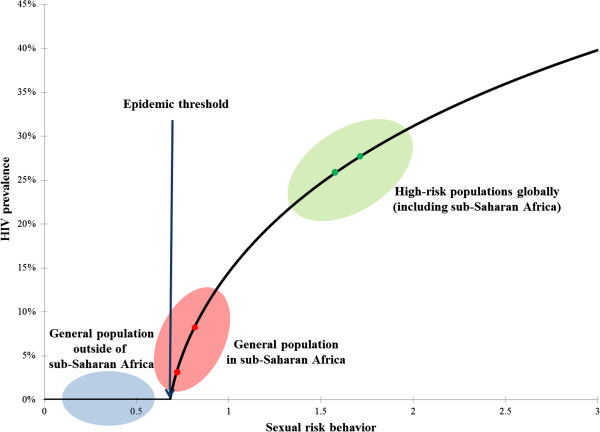
Conclusions: Our study provides direct evidence for strong geographic clustering of HIV infection across SSA. This striking pattern of heterogeneity at the micro-geographical scale might reflect the fact that most HIV epidemics in the general population in SSA are not far from their epidemic threshold. Our findings identify priority geographic areas for HIV programming, and support the need for spatially targeted interventions in order to maximize the impact on the epidemic in SSA.
Figures
Similar articles
-
Mapping and characterising areas with high levels of HIV transmission in sub-Saharan Africa: A geospatial analysis of national survey data.PLoS Med. 2020 Mar 6;17(3):e1003042. doi: 10.1371/journal.pmed.1003042. eCollection 2020 Mar. PLoS Med. 2020. PMID: 32142509 Free PMC article.
-
Geographical Patterns of HIV Sero-Discordancy in High HIV Prevalence Countries in Sub-Saharan Africa.Int J Environ Res Public Health. 2016 Aug 31;13(9):865. doi: 10.3390/ijerph13090865. Int J Environ Res Public Health. 2016. PMID: 27589776 Free PMC article.
-
Spatial variability in HIV prevalence declines in several countries in sub-Saharan Africa.Health Place. 2014 Jul;28:45-9. doi: 10.1016/j.healthplace.2014.03.007. Epub 2014 Apr 17. Health Place. 2014. PMID: 24747195
-
The potential impact of country-level migration networks on HIV epidemics in sub-Saharan Africa: the case of Botswana.Lancet HIV. 2021 Dec;8(12):e787-e792. doi: 10.1016/S2352-3018(21)00267-8. Epub 2021 Nov 10. Lancet HIV. 2021. PMID: 34774183 Free PMC article. Review.
-
"In the fell clutch of circumstance": HIV and men who have sex with men in sub-Saharan Africa.Curr HIV/AIDS Rep. 2015 Mar;12(1):164-72. doi: 10.1007/s11904-014-0249-1. Curr HIV/AIDS Rep. 2015. PMID: 25637162 Review.
Cited by
-
Social determinants of HIV infection, hotspot areas and subpopulation groups in Ethiopia: evidence from the National Demographic and Health Survey in 2011.BMJ Open. 2015 Nov 20;5(11):e008669. doi: 10.1136/bmjopen-2015-008669. BMJ Open. 2015. PMID: 26589427 Free PMC article.
-
Mapping the spatial variability of HIV infection in Sub-Saharan Africa: Effective information for localized HIV prevention and control.Sci Rep. 2017 Aug 22;7(1):9093. doi: 10.1038/s41598-017-09464-y. Sci Rep. 2017. PMID: 28831171 Free PMC article.
-
Role of social organization engagement in high-risk groups intervention against HIV/AIDS: a case study from 176 cities of China.Infect Dis Poverty. 2022 Dec 28;11(1):126. doi: 10.1186/s40249-022-01048-x. Infect Dis Poverty. 2022. PMID: 36575532 Free PMC article.
-
Spatial distribution and characteristics of HIV clusters in Ethiopia.Trop Med Int Health. 2020 Mar;25(3):301-307. doi: 10.1111/tmi.13356. Epub 2020 Jan 12. Trop Med Int Health. 2020. PMID: 31808592 Free PMC article.
-
Capturing the spatial variability of HIV epidemics in South Africa and Tanzania using routine healthcare facility data.Int J Health Geogr. 2018 Jul 11;17(1):27. doi: 10.1186/s12942-018-0146-8. Int J Health Geogr. 2018. PMID: 29996876 Free PMC article.
References
-
- UNAIDS/WHO. AIDS epidemic update 2010: UNAIDS fact sheet. available at http://www.unaids.org/documents/20101123_FS_SSA_em_en.pdf, accessed 23 July 2012.
-
- UNAIDS. Practical guidelines for intensifying HIV prevention: towards universal acces. Book Practical guidelines for intensifying HIV prevention: towards universal acces. 2007.
Publication types
MeSH terms
LinkOut - more resources
Full Text Sources
Other Literature Sources
Medical
Research Materials
