. 2013 Aug;41(14):6793-807.
doi: 10.1093/nar/gkt421. Epub 2013 May 18.

Prediction of clustered RNA-binding protein motif sites in the mammalian genome

Affiliations

Prediction of clustered RNA-binding protein motif sites in the mammalian genome

Chaolin Zhang et al. Nucleic Acids Res. 2013 Aug.

Abstract

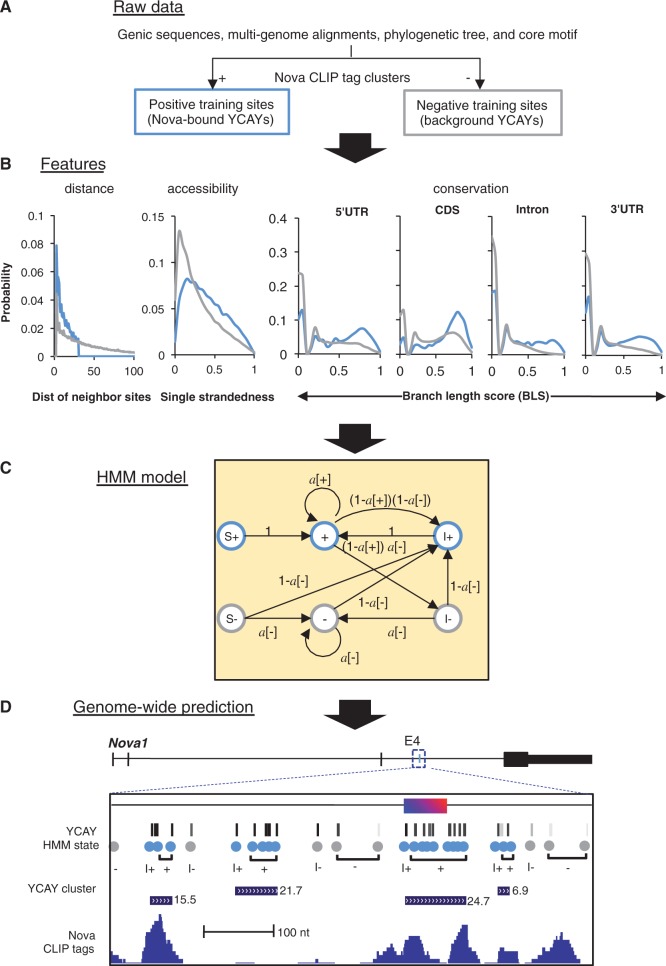
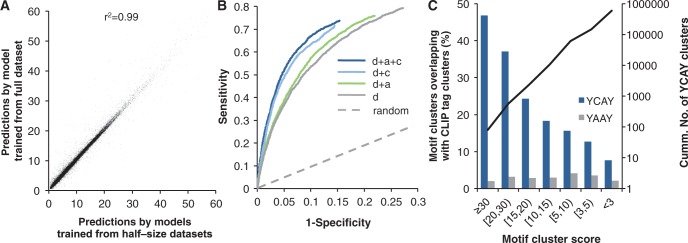
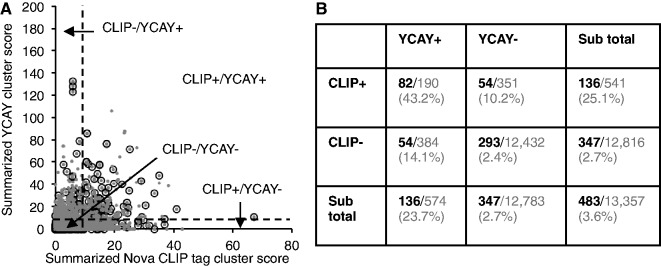
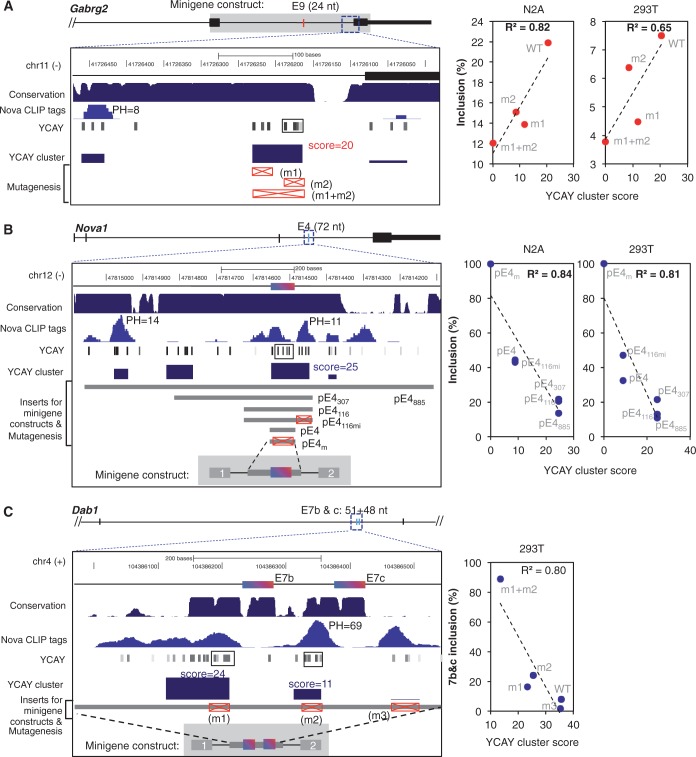
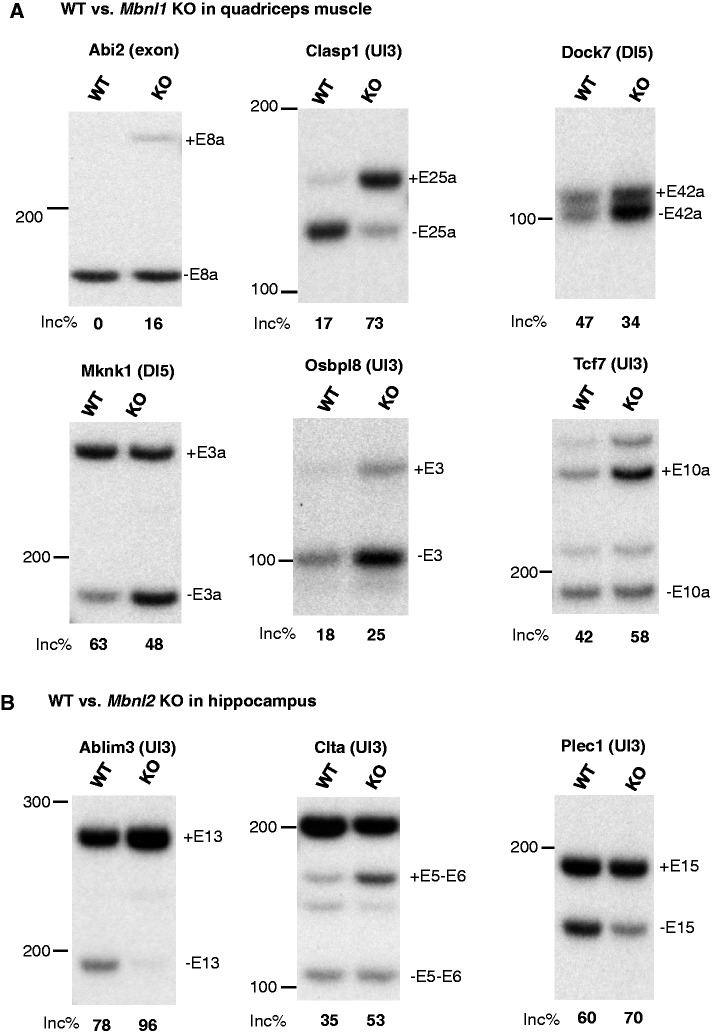
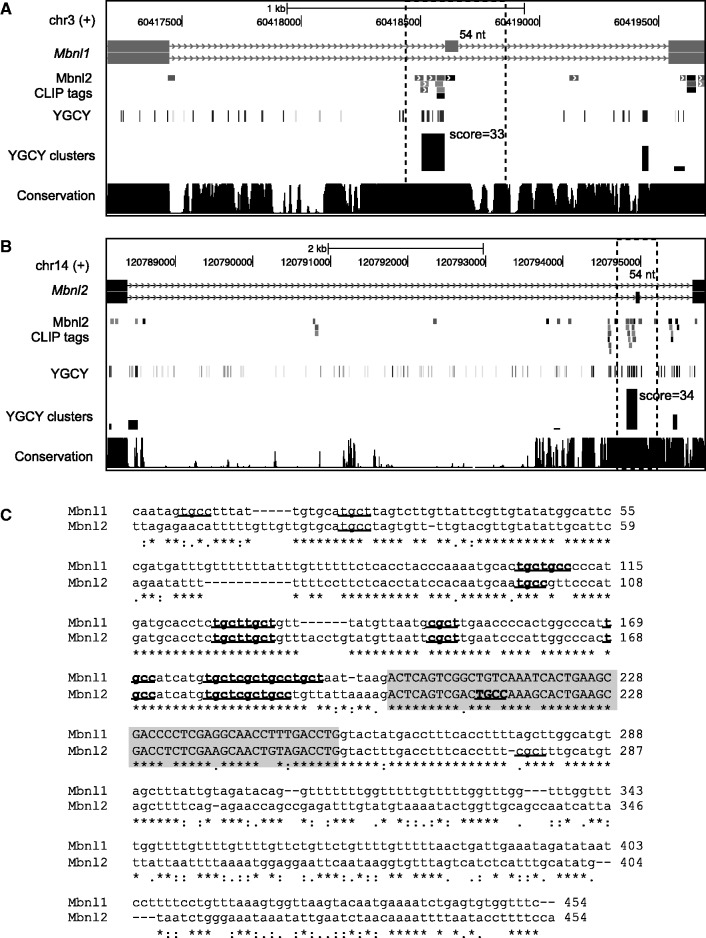
Sequence-specific interactions of RNA-binding proteins (RBPs) with their target transcripts are essential for post-transcriptional gene expression regulation in mammals. However, accurate prediction of RBP motif sites has been difficult because many RBPs recognize short and degenerate sequences. Here we describe a hidden Markov model (HMM)-based algorithm mCarts to predict clustered functional RBP-binding sites by effectively integrating the number and spacing of individual motif sites, their accessibility in local RNA secondary structures and cross-species conservation. This algorithm learns and quantifies rules of these features, taking advantage of a large number of in vivo RBP-binding sites obtained from cross-linking and immunoprecipitation data. We applied this algorithm to study two representative RBP families, Nova and Mbnl, which regulate tissue-specific alternative splicing through interacting with clustered YCAY and YGCY elements, respectively, and predicted their binding sites in the mouse transcriptome. Despite the low information content in individual motif elements, our algorithm made specific predictions for successful experimental validation. Analysis of predicted sites also revealed cases of extensive and distal RBP-binding sites important for splicing regulation. This algorithm can be readily applied to other RBPs to infer their RNA-regulatory networks. The software is freely available at http://zhanglab.c2b2.columbia.edu/index.php/MCarts.


Figures

Figure 1.
Figure 1.
Overview of mCarts to predict clustered RBP motif sites using sequence, accessibility and conservation information. Prediction of Nova-bound YCAY clusters is used for illustration. (A) The proposed method uses motif sites in the CLIP tag clusters and sequences without CLIP tags as positive and negative training datasets, respectively. Motif sites are searched in these regions, and their distance to the preceding sites, accessibility and conservation are evaluated. (B) The distribution of each feature for sites in the positive (blue curves) or negative (gray curves) training dataset is estimated using a nonparametric representation. The distance between YCAYs in an RBP bound cluster (blue curve in the left panel) is censored at 30 nt, to impose an implicit limit of spacing allowed in a YCAY cluster. Conservation is modeled using BLS separately for different genomic regions. (C) The graphic representation of the HMM. Three states represent motif sites in an RBP-bound motif site cluster (blue), and the other three states represent motif sites in background sequences (gray). Detailed definition of each state, and their emission probability distribution, is summarized in (B) and Table 1. (D) The HMM model is used to predict RBP-bound motif site clusters in the whole transcriptome. The predicted clusters near Nova1 exon4, a validated Nova target alternative exon, are shown as an example. In the zoom-in view, tracks shown are coordinates of YCAY elements with gray scale representing their conservation (BLS), the inferred HMM states, and predicted YCAY clusters and their scores, and Nova CLIP tags.
Figure 2.
Figure 2.
Evaluation of predicted YCAY clusters using CLIP data. (A) Correlation of YCAY cluster scores predicted by 2-fold cross-validation models (x-axis) and cluster scores predicted by the HMM trained on the full-size training dataset (y-axis). The squared Pearson correlation is indicated. (B) Comparison of cross-validation HMMs using all or subsets of features for the accuracy of Nova-bound YCAY cluster prediction. HMMs were trained on half-size training sets and evaluated on the independent test sets, as in x-axis in (A). Specificity and sensitivity were estimated from the presence of predicted YCAY clusters in the footprint region of robust CLIP tag clusters (±50 nt of peaks, PH ≥ 15) or background sequences of the same size, and the resulting ROC curves are shown. Models using different subsets of features are compared: d, distance; a, accessibility; c, conservation. (C) The overlap between the footprints of CLIP tag clusters and predicted YCAY clusters with varying scores. Nonrepetitive YCAY clusters are binned into groups according to their scores. For each bin, the proportion of YCAY clusters overlapping with all CLIP tag cluster footprints (±50 nt of peaks) is shown (blue bars, left axis). YAAY clusters predicted by the same model are shown (gray bars) as a control. The cumulative number of nonrepetitive YCAY clusters is shown as the black curve (right axis).
Figure 3.
Figure 3.
Nova-regulated alternative exons predicted from CLIP data and those predicted from YCAY clusters are complementary to each other. (A) Target exon scores predicted from CLIP data (x-axis) are plot against scores predicted from YCAY clusters (y-axis). Each gray dot is a cassette exon. All cassette exons are shown in gray, and exons with Nova-dependent splicing as determined by Affymetrix exon or exon-junction microarray data are overlaid in empty circles. A somewhat arbitrary threshold of summarized CLIP tag cluster score (10) or YCAY cluster score (10) is indicated by the dotted lines. (B) Breakdown of exons according to their summarized CLIP tag cluster score or YCAY cluster score above or below the threshold. The number (black and bold font) of exons currently with evidence of Nova-dependent splicing over the total (gray) in each category are also shown. The percentage is indicated in the parentheses.
Figure 4.
Figure 4.
Mutagenesis validates predicted YCAY clusters. Mutagenesis analyses of Nova-binding YCAY clusters were previously performed in 293T or N2A cells for three splicing reporters. In each case, coordinates and schematic representation of the exon and intron structure, sequence conservation, CLIP tags and predicted YCAY clusters, as well as mutations introduced in the reporters are shown in the left panel. YCAY clusters predicted by our previous analysis (22) is indicated by a solid box in the YCAY track. The splicing of each reporter with WT or mutant YCAY clusters, in combination with transfection of Nova plasmids in N2A and/or 293T cells, was quantified by RT-PCR. Exon inclusion level of each reporter (y-axis) is correlated with the WT or mutant YCAY cluster score (x-axis), as shown on the right. The squared Pearson correlation coefficient is indicated. (A) Gabrg2 exon 9 (10). The minigene consists of sequences between exons 8 and 10, as shaded in gray in the schematic representation of the gene structure. Mutant minigenes were generated by point mutations in the different sets of YCAY elements (YCAY→YAAY), as indicated by the red boxes with a cross. The analysis was performed in both N2A cells and 293T cells. (B) Nova1 exon4 (9). The minigene constructs consist of Nova1 exon 4 and flanking intronic sequences inserted into the human β-globin gene backbone. Mutant minigenes were generated by truncation of intronic sequences of different sizes covering the predicted YCAY clusters, together with point mutations in the YCAY elements (YCAY→YAAY), as indicated by the red boxes with a cross. The analysis was performed in both N2A cells and 293T cells. (C) Dab1 exons 7b and c (41). The minigene constructs consist of exons 7b and c and flanking intronic sequences inserted into the human β-globin gene backbone. Mutant minigenes were generated by point mutations in different sets of YCAY elements (YCAY→YAAY), as indicated by the red boxes with cross. The analysis was performed in 293T cells. Inclusion of both exons 7b and c is shown.
Figure 5.
Figure 5.
Semi-quantitative RT-PCR validation of predicted Mbnl target alternative exons. (A) Six exons showing Mbnl1-dependent exon inclusion or exclusion in comparison of WT and Mbnl1 KO quadriceps muscles. (B) Three exons showing Mbnl2-dependent exon inclusion or exclusion in comparison of WT and Mbnl2 KO hippocampus. For each exon, three biological replicates of WT and three biological replicates of Mbnl1 or Mbnl2 KO samples were used. The typical gel image is shown with the average percent exon inclusion indicated below. The band representing the inclusion or skipping isoform is labeled on the right, with the sizes of molecular markers indicated on the left. The position of the major YGCY clusters predicted by mCarts is indicated in the parentheses following the gene symbol (UI3: 3′ end of the upstream intron, DI5: 5′ end of the downstream intron). In all cases, the splicing changes on Mbnl1 or Mbnl2 depletion are statistically significant (P < 0.05; t-test).
Figure 6.
Figure 6.
Mbnl1 and Mbnl2 are autoregulated through alternative splicing. (A, B) Both Mbnl1 (A) and Mbnl2 (B) have a 54 nt alternative exon, which showed Mbnl-dependent splicing. In both cases, a strong YGCY cluster was predicted in the upstream intron near the 3′ splice site, where robust CLIP tags were mapped. (C) Alignment of the alternative exon (shaded) and flanking intronic sequences in Mbnl1 and Mbnl2 (dotted boxes in A and B) are shown. YGCY elements are highlighted by underscores, and those in predicted YGCY clusters are shown in bold.

Similar articles

Cited by

References

    1. McKee A, Minet E, Stern C, Riahi S, Stiles C, Silver P. A genome-wide in situ hybridization map of RNA-binding proteins reveals anatomically restricted expression in the developing mouse brain. BMC Dev. Biol. 2005;5:14. - PMC - PubMed
    1. Licatalosi DD, Darnell RB. RNA processing and its regulation: global insights into biological networks. Nat. Rev. Genet. 2010;11:75–87. - PMC - PubMed
    1. Kalsotra A, Cooper TA. Functional consequences of developmentally regulated alternative splicing. Nat. Rev. Genet. 2011;12:715–729. - PMC - PubMed
    1. Cooper TA, Wan L, Dreyfuss G. RNA and disease. Cell. 2009;136:777–793. - PMC - PubMed
    1. Licatalosi DD, Darnell RB. Splicing regulation in neurologic disease. Neuron. 2006;52:93–101. - PubMed

Publication types

MeSH terms