

Fetal deficiency of lin28 programs life-long aberrations in growth and glucose metabolism
- PMID: 23666760
- PMCID: PMC3775935
- DOI: 10.1002/stem.1423
Fetal deficiency of lin28 programs life-long aberrations in growth and glucose metabolism
Abstract
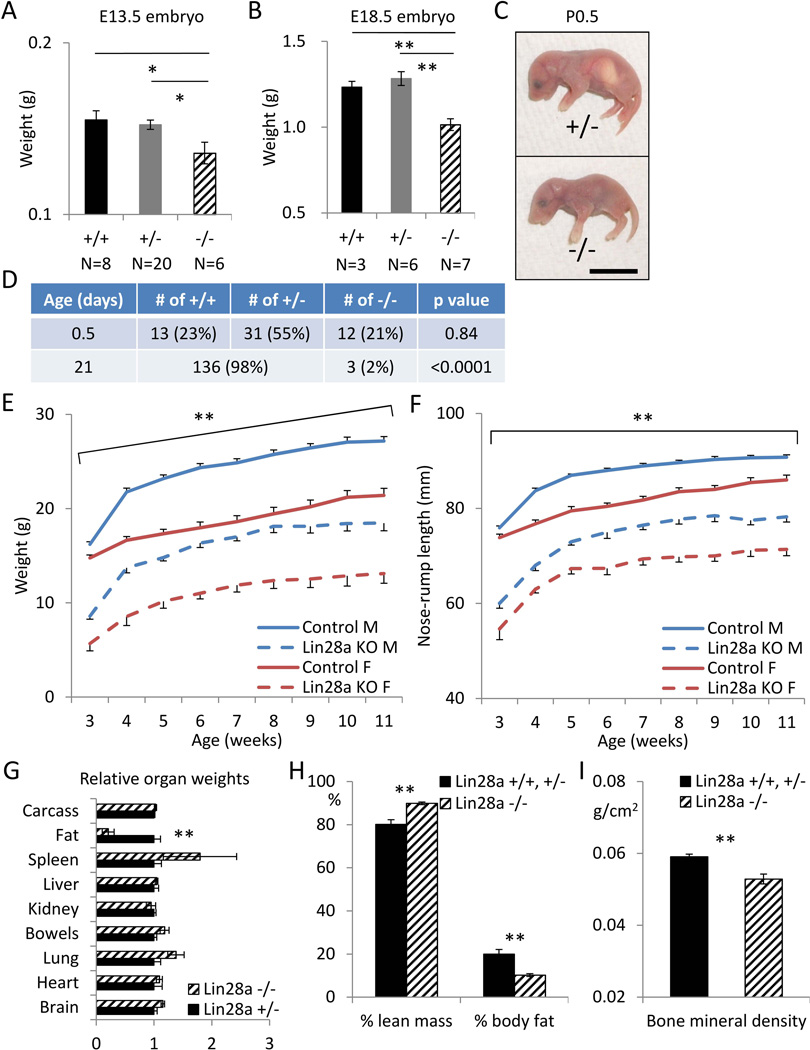
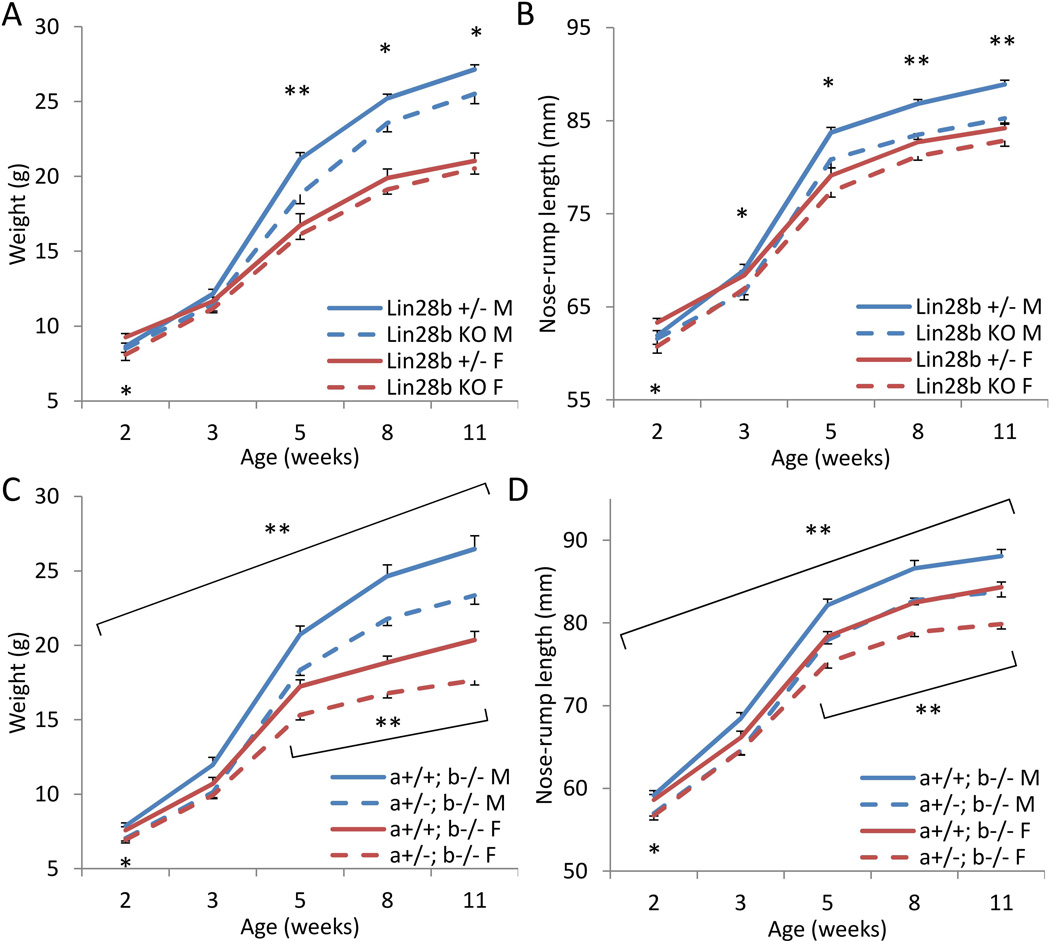
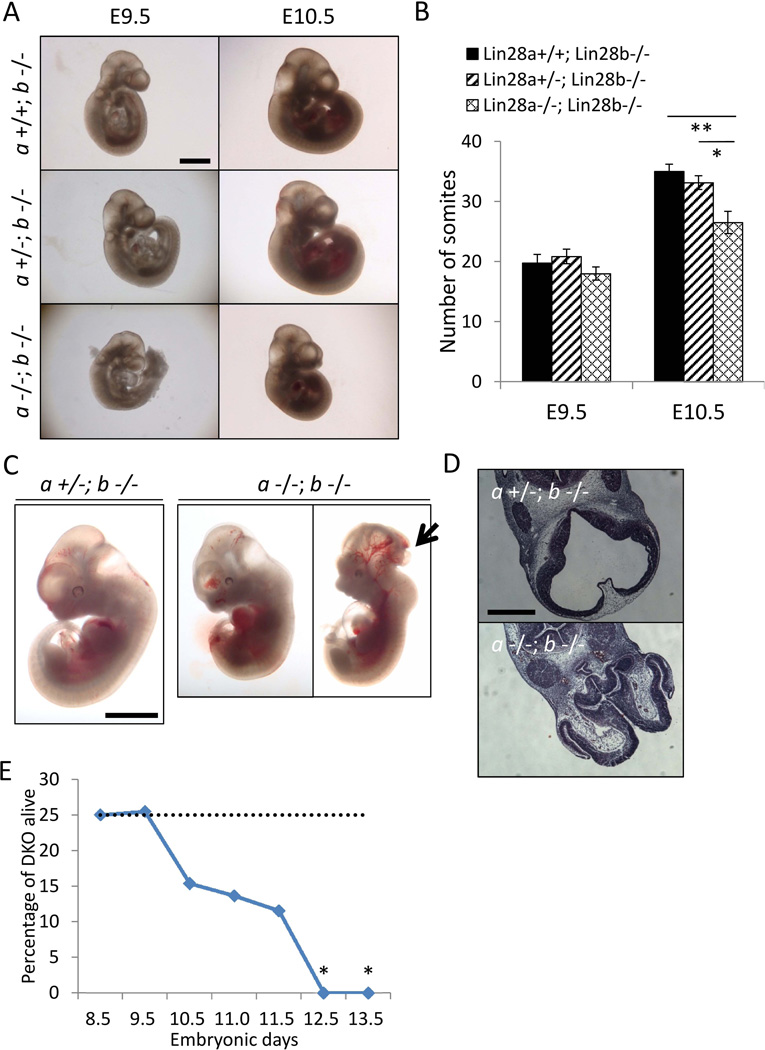
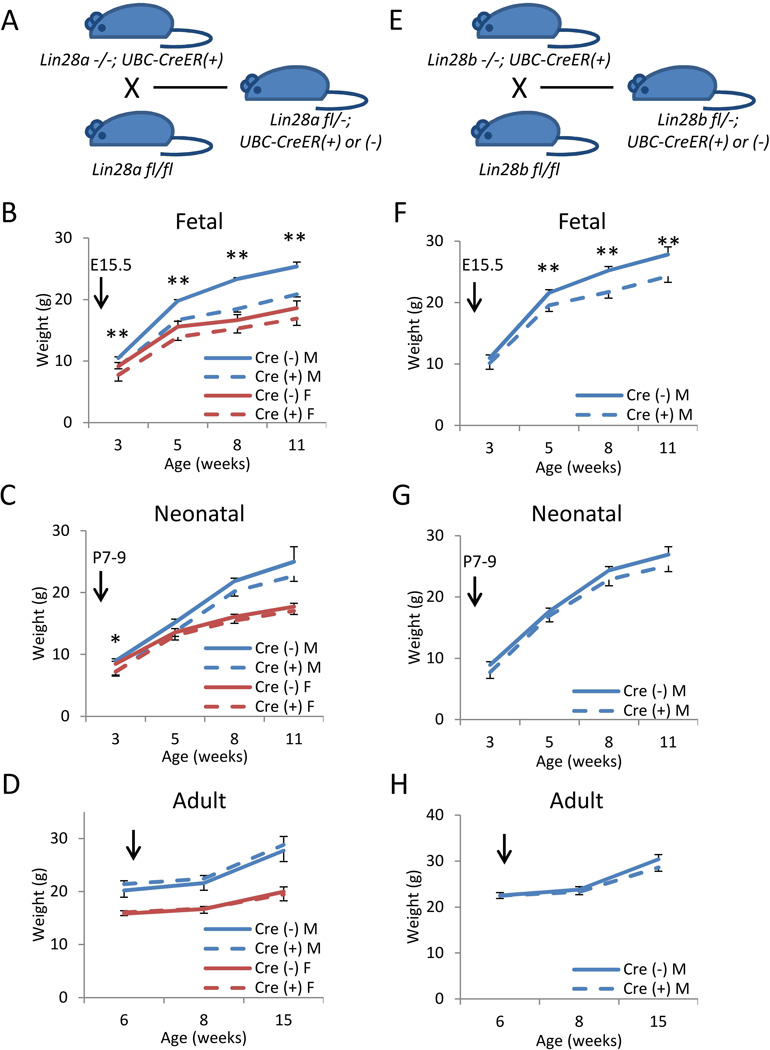
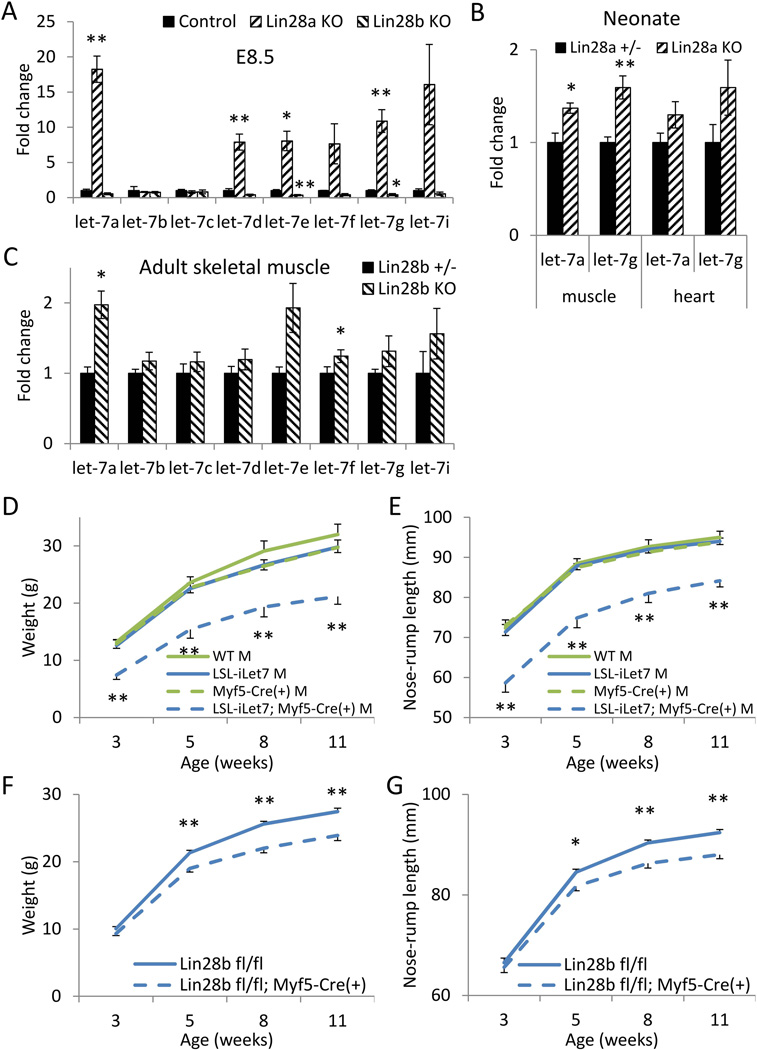
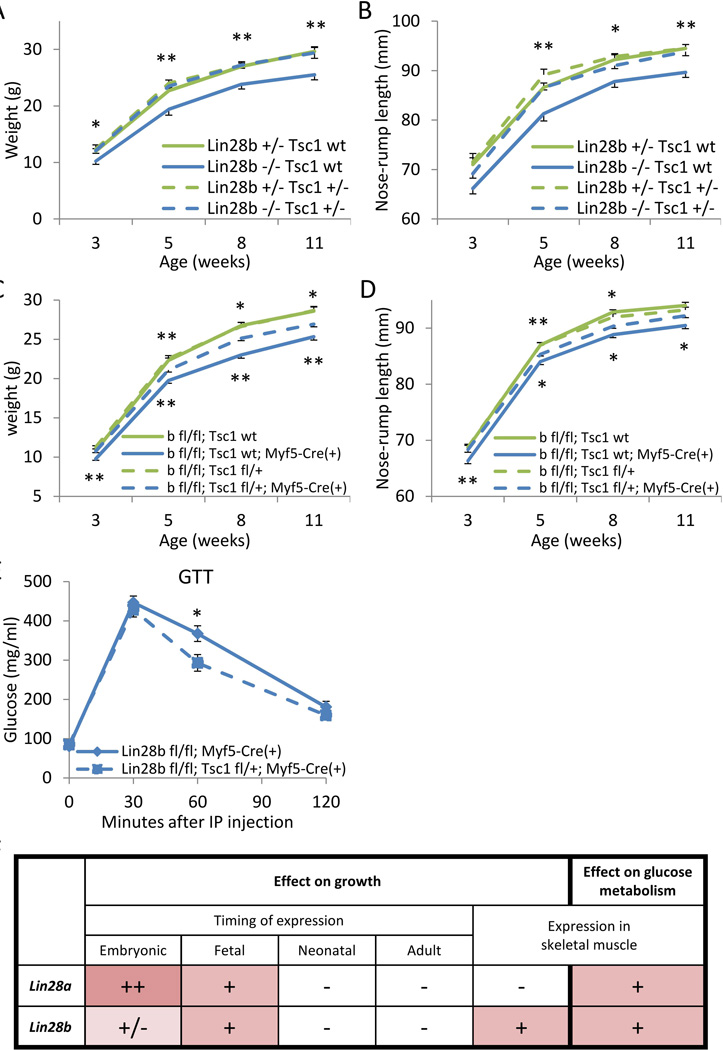
LIN28A/B are RNA binding proteins implicated by genetic association studies in human growth and glucose metabolism. Mice with ectopic over-expression of Lin28a have shown related phenotypes. Here, we describe the first comprehensive analysis of the physiologic consequences of Lin28a and Lin28b deficiency in knockout (KO) mice. Lin28a/b-deficiency led to dwarfism starting at different ages, and compound gene deletions showed a cumulative dosage effect on organismal growth. Conditional gene deletion at specific developmental stages revealed that fetal but neither neonatal nor adult deficiency resulted in growth defects and aberrations in glucose metabolism. Tissue-specific KO mice implicated skeletal muscle-deficiency in the abnormal programming of adult growth and metabolism. The effects of Lin28b KO could be rescued by Tsc1 haplo-insufficiency in skeletal muscles. Our data implicate fetal expression of Lin28a/b in the regulation of life-long effects on metabolism and growth, and demonstrate that fetal Lin28b acts at least in part via mTORC1 signaling.
Keywords: Diabetes; Dwarfism; Glucose metabolism; Growth; Lin28a; Lin28b; let-7; mTOR.
Copyright © 2013 AlphaMed Press.
Conflict of interest statement
The authors declare no competing financial interests.
Figures
Similar articles
-
Sex-specific regulation of weight and puberty by the Lin28/let-7 axis.J Endocrinol. 2016 Mar;228(3):179-91. doi: 10.1530/JOE-15-0360. Epub 2015 Dec 23. J Endocrinol. 2016. PMID: 26698568 Free PMC article.
-
Distinct expression patterns predict differential roles of the miRNA-binding proteins, Lin28 and Lin28b, in the mouse testis: studies during postnatal development and in a model of hypogonadotropic hypogonadism.Endocrinology. 2013 Mar;154(3):1321-36. doi: 10.1210/en.2012-1745. Epub 2013 Jan 21. Endocrinology. 2013. PMID: 23337528
-
Investigation of peripubertal expression of Lin28a and Lin28b in C57BL/6 female mice.Mol Cell Endocrinol. 2013 Jan 30;365(2):241-8. doi: 10.1016/j.mce.2012.10.025. Epub 2012 Nov 5. Mol Cell Endocrinol. 2013. PMID: 23138112 Free PMC article.
-
Aberrant regulation of the LIN28A/LIN28B and let-7 loop in human malignant tumors and its effects on the hallmarks of cancer.Mol Cancer. 2015 Jun 30;14:125. doi: 10.1186/s12943-015-0402-5. Mol Cancer. 2015. PMID: 26123544 Free PMC article. Review.
-
Lin28 gene and mammalian puberty.Mol Reprod Dev. 2020 May;87(5):525-533. doi: 10.1002/mrd.23347. Epub 2020 May 3. Mol Reprod Dev. 2020. PMID: 32363678 Review.
Cited by
-
A Transcriptome-wide Translational Program Defined by LIN28B Expression Level.Mol Cell. 2019 Jan 17;73(2):304-313.e3. doi: 10.1016/j.molcel.2018.10.041. Epub 2018 Dec 6. Mol Cell. 2019. PMID: 30527666 Free PMC article.
-
Lin28a overexpression reveals the role of Erk signaling in articular cartilage development.Development. 2018 Aug 2;145(15):dev162594. doi: 10.1242/dev.162594. Development. 2018. PMID: 30042178 Free PMC article.
-
Lin28 and let-7 regulate the timing of cessation of murine nephrogenesis.Nat Commun. 2019 Jan 11;10(1):168. doi: 10.1038/s41467-018-08127-4. Nat Commun. 2019. PMID: 30635573 Free PMC article.
-
LIN28 phosphorylation by MAPK/ERK couples signalling to the post-transcriptional control of pluripotency.Nat Cell Biol. 2017 Jan;19(1):60-67. doi: 10.1038/ncb3453. Epub 2016 Dec 19. Nat Cell Biol. 2017. PMID: 27992407 Free PMC article.
-
3' RNA Uridylation in Epitranscriptomics, Gene Regulation, and Disease.Front Mol Biosci. 2018 Jul 13;5:61. doi: 10.3389/fmolb.2018.00061. eCollection 2018. Front Mol Biosci. 2018. PMID: 30057901 Free PMC article. Review.
References
-
- Heo I, Joo C, Cho J, et al. Lin28 mediates the terminal uridylation of let-7 precursor MicroRNA. Mol Cell. 2008;32:276–284. - PubMed
Publication types
MeSH terms
Substances
Grants and funding
LinkOut - more resources
Full Text Sources
Other Literature Sources
Molecular Biology Databases
Research Materials
Miscellaneous
