. 2013 May 1;27(9):1016-31.
doi: 10.1101/gad.212282.112.

Global genomic profiling reveals an extensive p53-regulated autophagy program contributing to key p53 responses

Affiliations

Global genomic profiling reveals an extensive p53-regulated autophagy program contributing to key p53 responses

Daniela Kenzelmann Broz et al. Genes Dev. .

Abstract

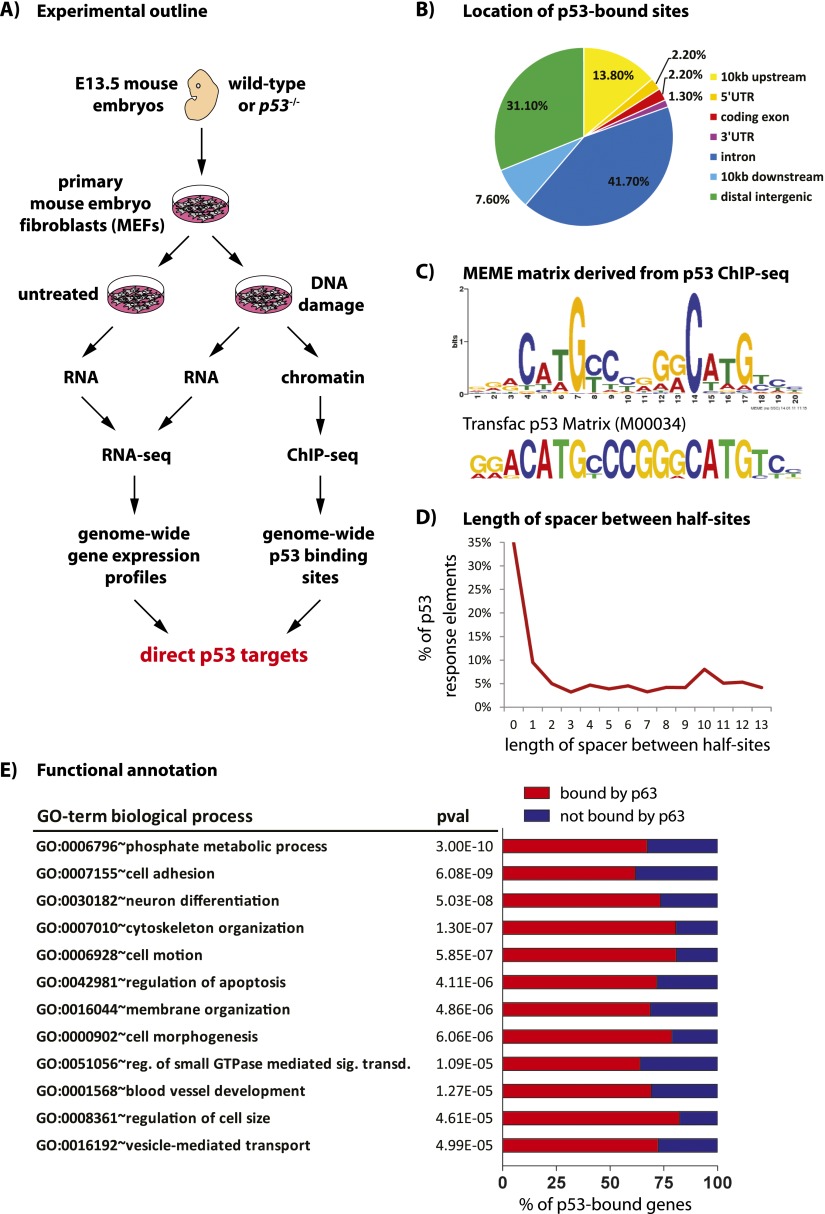
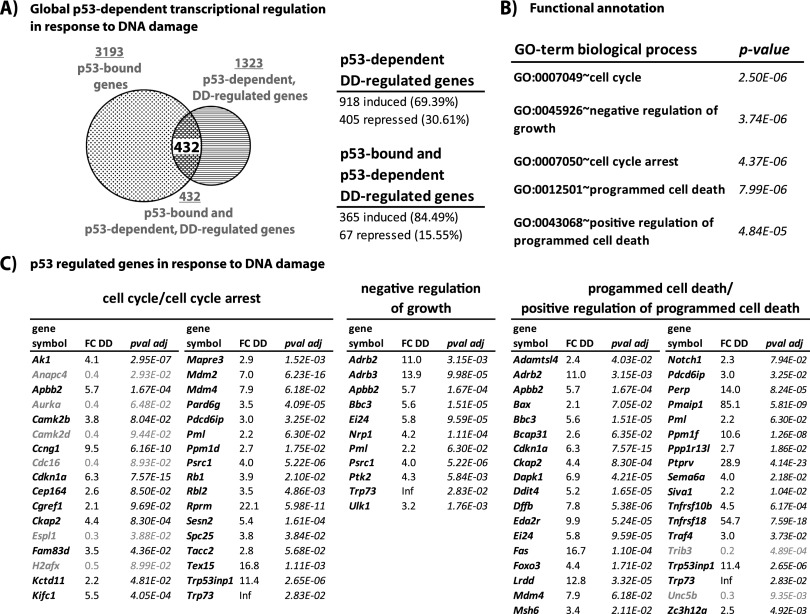
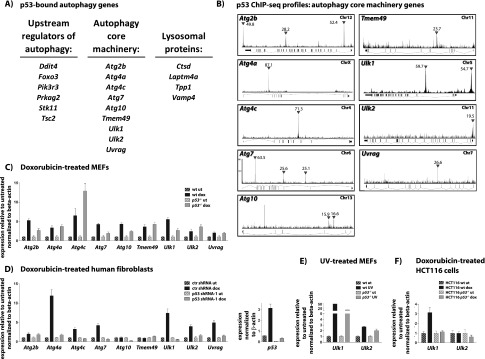
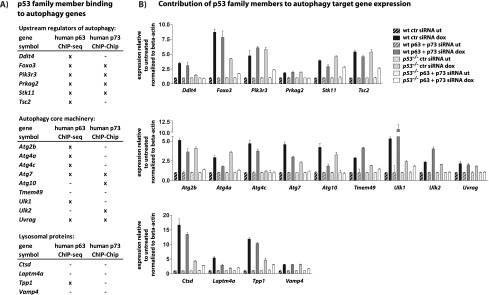
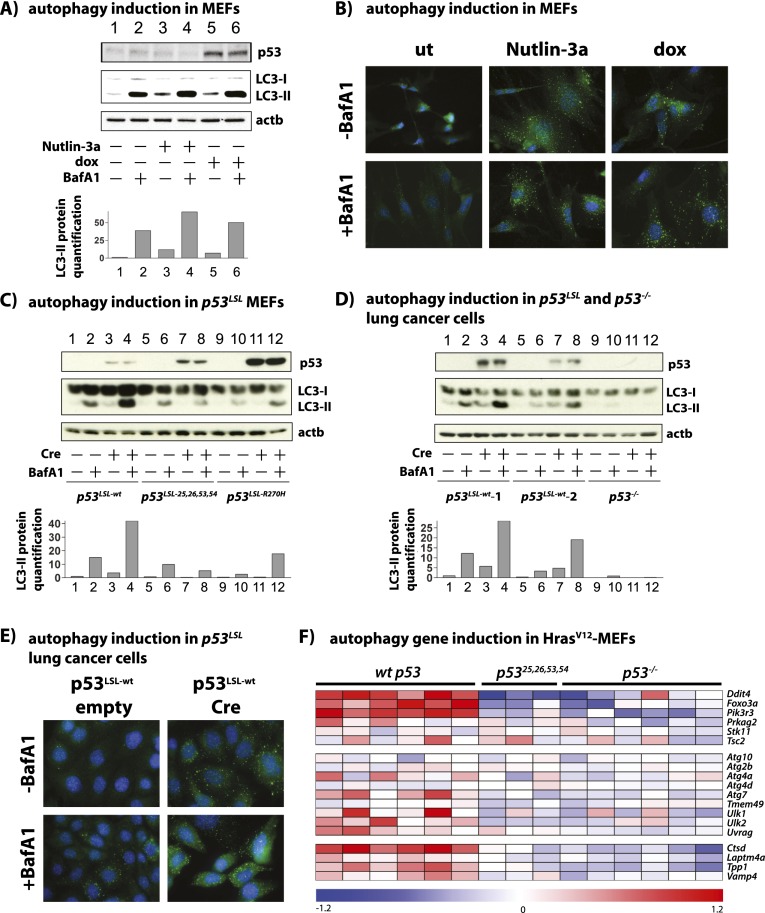
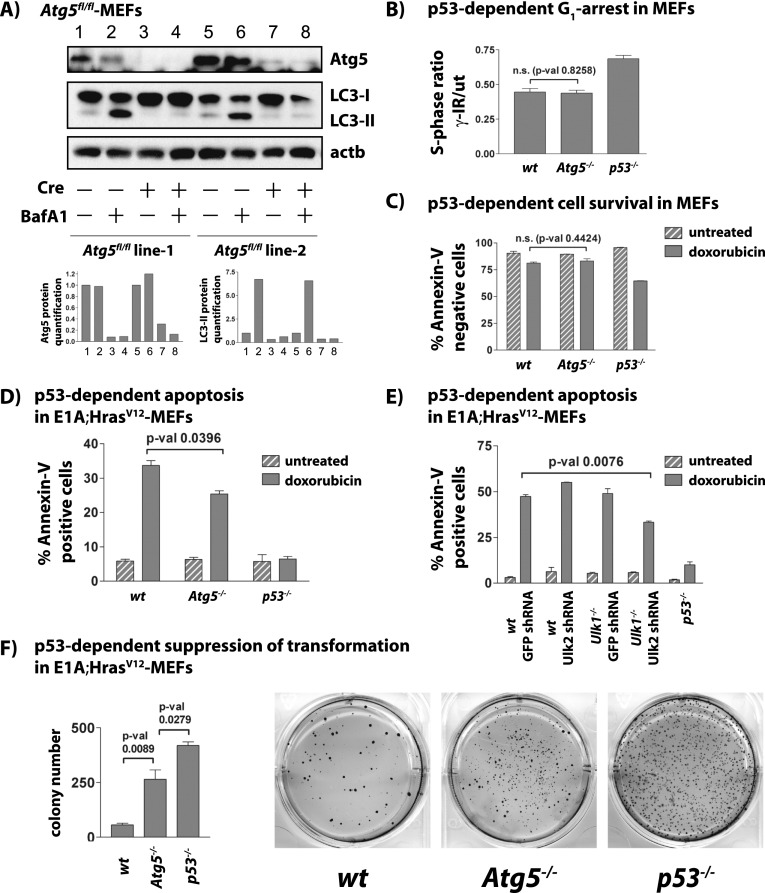
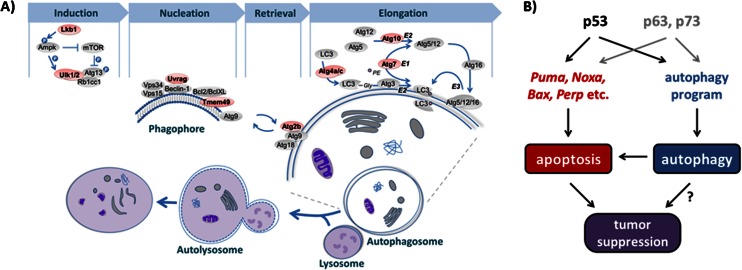
The mechanisms by which the p53 tumor suppressor acts remain incompletely understood. To gain new insights into p53 biology, we used high-throughput sequencing to analyze global p53 transcriptional networks in primary mouse embryo fibroblasts in response to DNA damage. Chromatin immunoprecipitation sequencing reveals 4785 p53-bound sites in the genome located near 3193 genes involved in diverse biological processes. RNA sequencing analysis shows that only a subset of p53-bound genes is transcriptionally regulated, yielding a list of 432 p53-bound and regulated genes. Interestingly, we identify a host of autophagy genes as direct p53 target genes. While the autophagy program is regulated predominantly by p53, the p53 family members p63 and p73 contribute to activation of this autophagy gene network. Induction of autophagy genes in response to p53 activation is associated with enhanced autophagy in diverse settings and depends on p53 transcriptional activity. While p53-induced autophagy does not affect cell cycle arrest in response to DNA damage, it is important for both robust p53-dependent apoptosis triggered by DNA damage and transformation suppression by p53. Together, our data highlight an intimate connection between p53 and autophagy through a vast transcriptional network and indicate that autophagy contributes to p53-dependent apoptosis and cancer suppression.

Keywords: ChIP-seq; RNA-seq; autophagy; p53; tumor suppression.


Figures

Figure 1.
Figure 1.
Genome-wide analysis of p53 binding in response to DNA damage. (A) Experimental outline. Wild-type and p53−/− MEFs were derived from embryonic day 13.5 (E13.5) embryos and either left untreated or treated with doxorubicin to induce DNA damage. RNA extracted from these cells was used for expression profiling by RNA-seq (3SEQ), and chromatin was used for genome-wide analysis of p53 binding to DNA by ChIP-seq. The overlap in genes identified from these analyses will reveal direct p53 target genes. (B) Genomic location of the p53 ChIP-seq peaks with respect to annotated genes. (C) p53 consensus motif derived from MEME de novo motif analysis compared with the TRANSFAC p53 matrix. Our motif shows a strong preference for the “core” C and G but more variability in the A and T residues in the “CATG” core as well as more degeneracy in the flanking nucleotides. (D) Distribution of spacer lengths between p53 response element half-sites, suggesting that many p53-binding sites have spacers >3 nt. (E) Biological process GO terms enriched in our p53-bound gene data set, with P-values as calculated by DAVID using a modified Fisher exact test. Percentages of genes bound by p63 are indicated, as determined by analysis of a published p63 ChIP-seq data set (Kouwenhoven et al. 2010).
Figure 2.
Figure 2.
p53-bound and regulated genes in response to DNA damage. (A, left) Overlap between all p53-bound genes and genes differentially expressed in a p53-dependent manner in response to DNA damage (DD), with the overlap defining a set of 432 p53-bound and regulated, direct p53 target genes. (Right) Summary of percentages of induced and repressed p53-dependent, DNA damage-regulated genes and p53-bound and p53-dependent DNA damage-regulated genes. (B) Biological process GO terms enriched in our p53-bound and regulated gene data set, with P-values as calculated by DAVID using a modified Fisher exact test. (C) Lists of genes within the categories shown in B, with fold changes in wild-type MEFs in response to DNA damage (FC DD) and adjusted P-values (pval adj) derived from DEseq analysis. Repressed genes are highlighted in gray. Inf denotes infinitely induced genes, reflecting lack of expression in untreated cells.
Figure 3.
Figure 3.
p53 regulates a program of autophagy genes. (A) Lists of p53-bound genes encoding proteins involved in the upstream regulation of autophagy, autophagy core machinery function, and lysosomal function. Peak enrichment for Atg10 and Ulk2 is slightly below our threshold for peak calling at 20, but they were still judged reliable upon inspection of the ChIP-seq binding profile and were therefore included in our list. (B) p53 ChIP-seq profiles showing p53 binding to autophagy core machinery component-encoding genes. The schematics show the p53 ChIP-seq profile and the gene organization, with the direction of transcription indicated by the orientation of the exon connectors: upward for the 5′ end of gene to the left, and downward for the 5′ end of gene to the right. Inverted triangles mark “called” peaks, and the numbers indicate ChIP enrichment. (C) qRT–PCR analysis of wild-type (wt) and p53−/− MEFs shows induction of p53-bound core autophagy genes after 24 h of doxorubicin treatment, with varying extents of p53-dependent contribution. Expression levels represent the average ± SD of technical triplicates after normalization to expression in untreated cells and to β-actin. (D, left) qRT–PCR analysis of human fibroblasts transduced with control (ctr) or p53 shRNAs shows p53-dependent induction of p53-bound core autophagy genes after 24 h of doxorubicin treatment. Expression levels represent the average ± SD of technical triplicates after normalization to expression in untreated cells and to β-actin. (Right) Analysis of average p53 expression levels ± SD of technical triplicates after normalization to β-actin confirms efficient p53 knockdown. (E) qRT–PCR analysis of Ulk1 and Ulk2 expression in UVC-treated wild-type and p53−/− MEFs after 24 h. Expression levels represent the average ± SD of technical triplicates after normalization to expression in untreated cells and to β-actin. (F) qRT–PCR analysis of Ulk1 and Ulk2 expression in doxorubicin-treated wild-type and p53-deficient HCT116 human colon carcinoma cells after 24 h. Expression levels represent the average ± SD of technical triplicates after normalization to expression in untreated cells and to β-actin.
Figure 4.
Figure 4.
p53 family members contribute to regulation of the autophagy program. (A) Table showing which of the p53-bound autophagy genes are bound by p63, based on a ChIP-seq study in primary human keratinocytes (Kouwenhoven et al. 2010), and by p73, based on a ChIP–Chip study in human rhabdomyosarcoma cells (Rosenbluth et al. 2011). (B) qRT–PCR analysis of autophagy gene expression in untreated (ut) or doxorubicin-treated (dox) wild-type and p53−/− MEFs transfected with either control (ctr) or p63 and p73 siRNAs. Expression levels represent the average ± SD of technical triplicates after normalization to expression in untreated cells and to β-actin.
Figure 5.
Figure 5.
Activation of p53 promotes autophagy in a transactivation-dependent manner. (A, top) Western blot analysis of p53-induced autophagy in wild-type MEFs in response to Nutlin-3a and DNA damage (dox) at 24 h using modified LC3 (LC3-II) levels as a marker for autophagic vesicles and BafA1 treatment to determine autophagic flux. One representative Western blot from at least two independent experiments using at least two independently derived primary MEF lines is shown. p53 is shown as a control, and β-actin (actb) serves as a loading control. (Bottom) Quantification of LC3-II levels normalized to β-actin levels. (B) Immunostaining for endogenous LC3 in wild-type MEFs treated with Nutlin-3a or DNA damage (dox), where the formation of autophagic vesicles is indicated by LC3 puncta. DAPI marks cell nuclei. (C, top) Western blot analysis of MEFs homozygous for conditional p53 alleles. Ad-Cre-induced excision of a transcriptional STOP cassette activated p53 expression, and Ad-empty was used as control. Autophagy induction in response to activation of wild-type p53 (lanes 14), a transactivation-dead p53 mutant (p5325,26,53,54; lanes 58), and a human cancer-derived p53 mutant (p53R270H; lanes 912) was assessed by LC3-II blotting 48 h after Ad-Cre infection. β-Actin (actb) serves as a loading control, and p53 expression in Ad-Cre-infected cells was verified by Western blot. One representative Western blot from three independent experiments is shown. (Bottom) Quantification of LC3-II levels normalized to β-actin levels. (D, top) Western blot analysis of KRasG12D lung cancer cells homozygous for conditional p53 alleles. Ad-Cre-induced excision of a transcriptional STOP cassette activated p53 expression, and Ad-empty was used as control. Autophagy induction in response to activation of wild-type p53 in two independent KRasG12D;p53LSL-wt/LSL-wt cell lines (lanes 18) and one p53−/− lung cancer cell line (lanes 912) was assessed by LC3-II blotting 48 h after Ad-Cre infection. β-Actin (actb) serves as a loading control, and p53 expression in Ad-Cre-infected cells was verified by Western blot. Shown is one representative Western blot from three independent experiments. (Bottom) Quantification of LC3-II levels normalized to β-actin levels. (E) Immunostaining for endogenous LC3 in lung cancer cells with (Cre) or without (empty) activation of a conditional p53 allele. (F) Heat map showing expression of p53-bound autophagy genes using microarray data generated from HrasV12;p53+/+ MEFs undergoing senescence or HrasV12 MEFs either lacking p53 (p53−/−) or homozygous for a transactivation-dead p53 mutant allele (p5325,26,53,54/25,26,53,54), both of which fail to undergo senescence. Induced genes appear red on the heat map, and repressed genes appear blue.
Figure 6.
Figure 6.
Autophagy deficiency does not compromise DNA damage-induced cell cycle arrest and survival but impairs p53-dependent apoptosis and suppression of transformation. All experiments were performed with two independent Atg5fl/fl MEF cell lines and at least in duplicate. (A, top) Western blot analysis confirming decreased Atg5 protein levels and inhibition of autophagy as assessed by LC3-II 48 h after Ad-Cre (+Cre) or Ad-empty (−Cre) infection. β-Actin serves as a loading control. (Bottom) Quantification of Atg5 and LC3-II is shown relative to β-actin. (B) Graph showing the average S-phase ratios of γ-irradiated/untreated MEFs for each genotype. The P-value was calculated by the Student's t-test. (C) p53-dependent cell survival in primary MEFs upon exposure to DNA damage (dox) for 72 h. Shown are the average percentages ± SD of technical replicates of AnnexinV-negative cells from a representative experiment. (D) p53-dependent apoptosis in E1A;HrasV12 MEFs of different genotypes after 18 h of DNA damage treatment (dox). Shown are the average percentages ± SD of AnnexinV-positive cells from a representative experiment using two MEF lines per genotype. The P-value was calculated by the Student's t-test. (E) p53-dependent apoptosis in E1A;HrasV12;wild-type and E1A;HrasV12;Ulk1−/− MEFs transduced with negative control GFP shRNAs or Ulk2 shRNAs after 18 h of DNA damage treatment (dox). Shown are the average percentages ± SD of AnnexinV-positive cells from one representative of more than three independent experiments, with error bars indicating technical replicates, and P-values calculated by the Student's t-test. (F) Soft agar assay for p53-dependent suppression of transformation in E1A;HrasV12 MEFs. Quantification shows average colony number ± SD. The P-values were calculated by the Student's t-test. Shown are representative wells of 3-wk Giemsa-stained colonies from one experiment of four, each with technical triplicates.
Figure 7.
Figure 7.
Summary and model. (A) Schematic drawing of the autophagic process, showing proteins involved in different steps of autophagy. Autophagy core proteins encoded by genes that we identified as p53-bound are highlighted in red. Induction of autophagy is regulated by mTor and Ampk, which phopshorylate the Ulk1 complex to regulate autophagy. Subsequently, a Beclin-1 complex induces formation of the phagophore by recruiting the LC3 conjugation machinery. Two ubiquitin-like conjugation systems mediate the attachment of a phosphatidylethanolamine moiety (PE) to LC3 for recruitment to the autophagic membrane. The growing autophagosome engulfs cytosolic contents, such as damaged proteins and organelles. Finally, the mature autophagosome fuses with a lysosome, resulting in the degradation of its contents and the autophagic membrane. (B) Model showing the contribution of autophagy to p53 responses. p53, in collaboration with p63 and p73, regulates apoptosis target genes to induce apoptosis, which contributes to tumor suppression. Similarly, p53 and its family members regulate the newly identified autophagy program (e.g., Atg2b, Atg4a, Atg4c, Atg7, Atg10, Tmem49, Ulk1, Ulk2, and Uvrag) to induce autophagy, which contributes to tumor suppression through apoptosis. Autophagy may also contribute directly to tumor suppression through apoptosis-independent mechanisms as indicated by the question mark next to the arrow from autophagy to tumor suppression.

Comment in

Similar articles

Cited by

References

    1. Anders S, Huber W 2010. Differential expression analysis for sequence count data. Genome Biol 11: R106. - PMC - PubMed
    1. Bailey TL, Elkan C 1994. Fitting a mixture model by expectation maximization to discover motifs in biopolymers. Proc Int Conf Intell Syst Mol Biol 2: 28–36 - PubMed
    1. Beck AH, Weng Z, Witten DM, Zhu S, Foley JW, Lacroute P, Smith CL, Tibshirani R, van de Rijn M, Sidow A, et al. 2010. 3′-End sequencing for expression quantification (3SEQ) from archival tumor samples. PLoS ONE 5: e8768. - PMC - PubMed
    1. Belyi VA, Ak P, Markert E, Wang H, Hu W, Puzio-Kuter A, Levine AJ 2010. The origins and evolution of the p53 family of genes. Cold Spring Harb Perspect Biol 2: a001198. - PMC - PubMed
    1. Bieging KT, Attardi LD 2012. Deconstructing p53 transcriptional networks in tumor suppression. Trends Cell Biol 22: 97–106 - PMC - PubMed

Publication types

Substances