Transforming growth factor-β-induced cross talk between p53 and a microRNA in the pathogenesis of diabetic nephropathy
- PMID: 23649518
- PMCID: PMC3749352
- DOI: 10.2337/db13-0305
Transforming growth factor-β-induced cross talk between p53 and a microRNA in the pathogenesis of diabetic nephropathy
Abstract
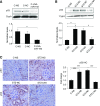
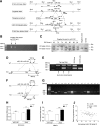
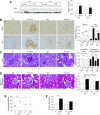
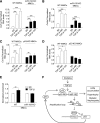
Elevated p53 expression is associated with several kidney diseases including diabetic nephropathy (DN). However, the mechanisms are unclear. We report that expression levels of transforming growth factor-β1 (TGF-β), p53, and microRNA-192 (miR-192) are increased in the renal cortex of diabetic mice, and this is associated with enhanced glomerular expansion and fibrosis relative to nondiabetic mice. Targeting miR-192 with locked nucleic acid-modified inhibitors in vivo decreases expression of p53 in the renal cortex of control and streptozotocin-injected diabetic mice. Furthermore, mice with genetic deletion of miR-192 in vivo display attenuated renal cortical TGF-β and p53 expression when made diabetic, and have reduced renal fibrosis, hypertrophy, proteinuria, and albuminuria relative to diabetic wild-type mice. In vitro promoter regulation studies show that TGF-β induces reciprocal activation of miR-192 and p53, via the miR-192 target Zeb2, leading to augmentation of downstream events related to DN. Inverse correlation between miR-192 and Zeb2 was observed in glomeruli of human subjects with early DN, consistent with the mechanism seen in mice. Our results demonstrate for the first time a TGF-β-induced feedback amplification circuit between p53 and miR-192 related to the pathogenesis of DN, and that miR-192-knockout mice are protected from key features of DN.
Figures


Similar articles
-
MicroRNA-192 in diabetic kidney glomeruli and its function in TGF-beta-induced collagen expression via inhibition of E-box repressors.Proc Natl Acad Sci U S A. 2007 Feb 27;104(9):3432-7. doi: 10.1073/pnas.0611192104. Epub 2007 Feb 20. Proc Natl Acad Sci U S A. 2007. PMID: 17360662 Free PMC article.
-
Transforming growth factor β1 (TGF-β1) enhances expression of profibrotic genes through a novel signaling cascade and microRNAs in renal mesangial cells.J Biol Chem. 2014 Oct 17;289(42):29001-13. doi: 10.1074/jbc.M114.600783. Epub 2014 Sep 9. J Biol Chem. 2014. PMID: 25204661 Free PMC article.
-
Fibroblast Growth Factor 21 Attenuates Diabetes-Induced Renal Fibrosis by Negatively Regulating TGF-β-p53-Smad2/3-Mediated Epithelial-to-Mesenchymal Transition via Activation of AKT.Diabetes Metab J. 2020 Feb;44(1):158-172. doi: 10.4093/dmj.2018.0235. Epub 2019 Oct 28. Diabetes Metab J. 2020. PMID: 31701691 Free PMC article.
-
Transforming growth factor-β/Smad signalling in diabetic nephropathy.Clin Exp Pharmacol Physiol. 2012 Aug;39(8):731-8. doi: 10.1111/j.1440-1681.2011.05663.x. Clin Exp Pharmacol Physiol. 2012. PMID: 22211842 Review.
-
TGF-Beta as a Master Regulator of Diabetic Nephropathy.Int J Mol Sci. 2021 Jul 23;22(15):7881. doi: 10.3390/ijms22157881. Int J Mol Sci. 2021. PMID: 34360646 Free PMC article. Review.
Cited by
-
Molecular Therapeutics for Diabetic Kidney Disease: An Update.Int J Mol Sci. 2024 Sep 19;25(18):10051. doi: 10.3390/ijms251810051. Int J Mol Sci. 2024. PMID: 39337537 Free PMC article. Review.
-
The Use of High-Throughput Transcriptomics to Identify Pathways with Therapeutic Significance in Podocytes.Int J Mol Sci. 2019 Dec 31;21(1):274. doi: 10.3390/ijms21010274. Int J Mol Sci. 2019. PMID: 31906131 Free PMC article.
-
MicroRNAs in Diabetic Kidney Disease.Int J Endocrinol. 2014;2014:593956. doi: 10.1155/2014/593956. Epub 2014 Jan 14. Int J Endocrinol. 2014. PMID: 24550986 Free PMC article. Review.
-
Systems biology combining human- and animal-data miRNA and mRNA data identifies new targets in ureteropelvic junction obstruction.BMC Syst Biol. 2017 Mar 1;11(1):31. doi: 10.1186/s12918-017-0411-7. BMC Syst Biol. 2017. PMID: 28249581 Free PMC article.
-
MicroRNAs and their applications in kidney diseases.Pediatr Nephrol. 2015 May;30(5):727-40. doi: 10.1007/s00467-014-2867-7. Epub 2014 Jun 14. Pediatr Nephrol. 2015. PMID: 24928414 Free PMC article. Review.
References
-
- Ziyadeh FN. The extracellular matrix in diabetic nephropathy. Am J Kidney Dis 1993;22:736–744 - PubMed
-
- Steffes MW, Osterby R, Chavers B, Mauer SM. Mesangial expansion as a central mechanism for loss of kidney function in diabetic patients. Diabetes 1989;38:1077–1081 - PubMed
-
- Declèves AE, Sharma K. New pharmacological treatments for improving renal outcomes in diabetes. Nat Rev Nephrol 2010;6:371–380 - PubMed
Publication types
MeSH terms
Substances
Grants and funding
LinkOut - more resources
Full Text Sources
Other Literature Sources
Medical
Molecular Biology Databases
Research Materials
Miscellaneous

