. 2013 Jun;19(6):695-703.
doi: 10.1038/nm.3155. Epub 2013 May 5.

Chemotherapy-induced bone marrow nerve injury impairs hematopoietic regeneration

Affiliations

Chemotherapy-induced bone marrow nerve injury impairs hematopoietic regeneration

Daniel Lucas et al. Nat Med. 2013 Jun.

Abstract

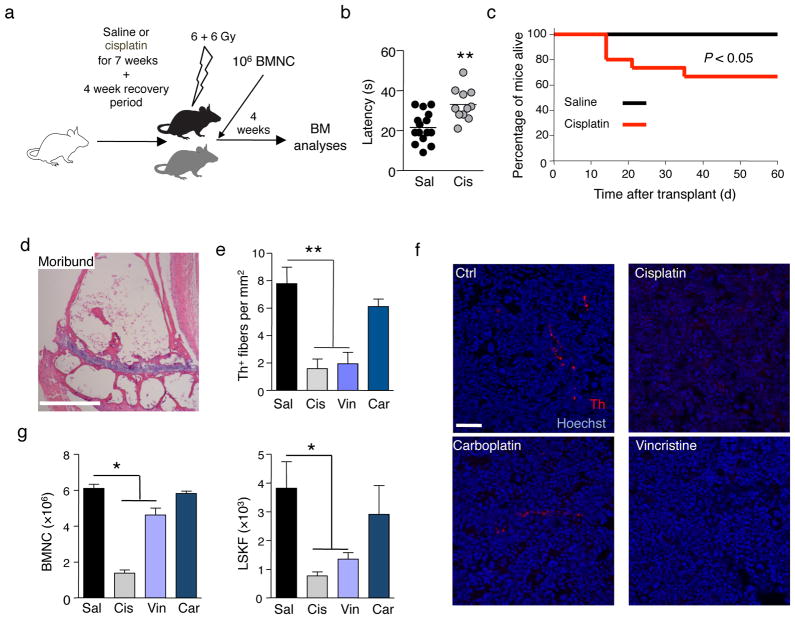
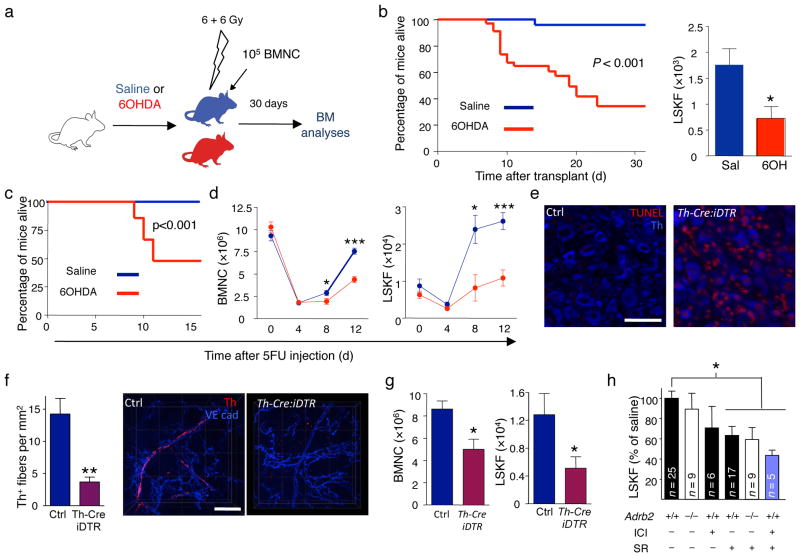
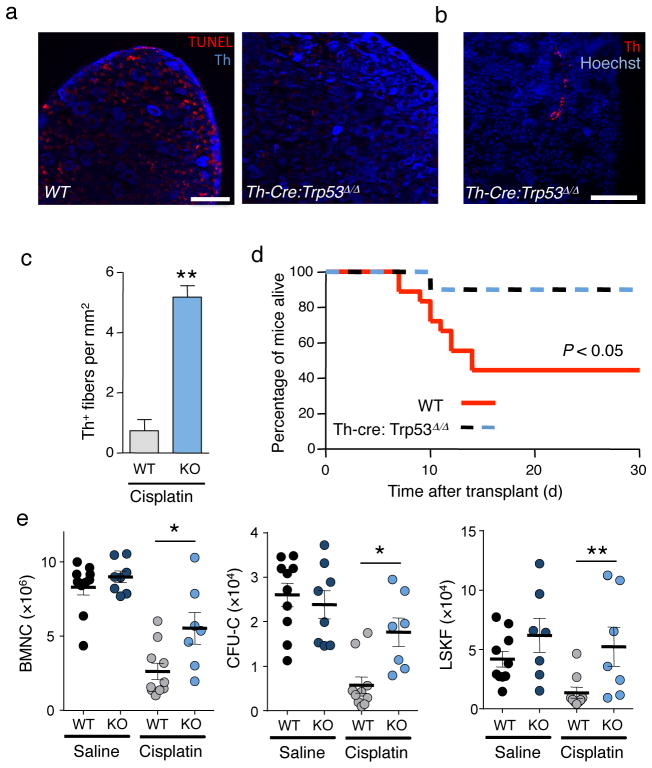
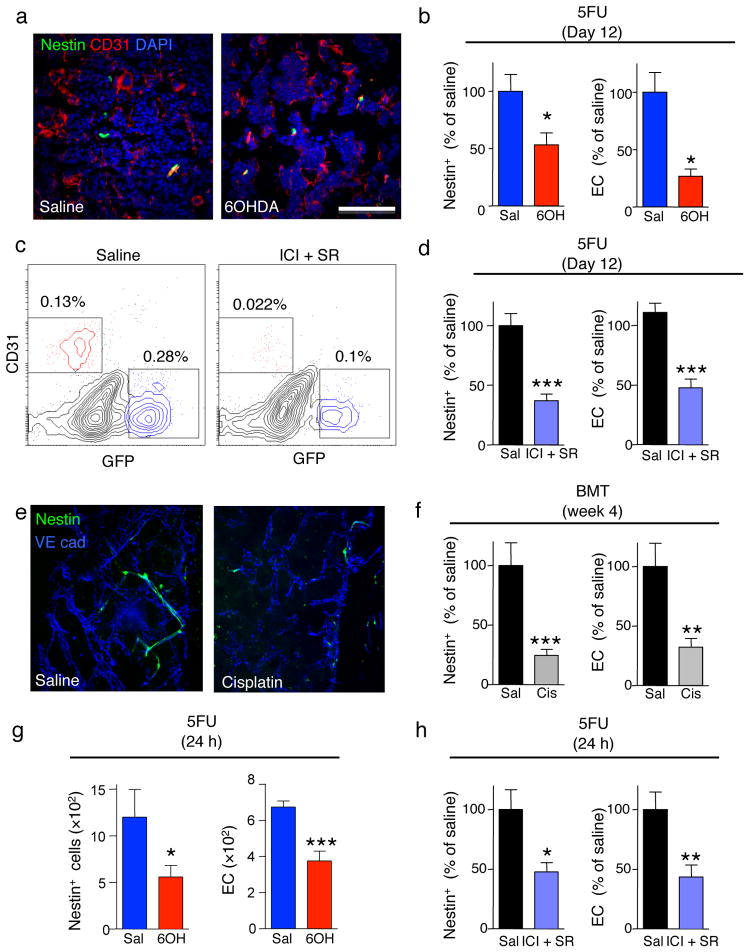
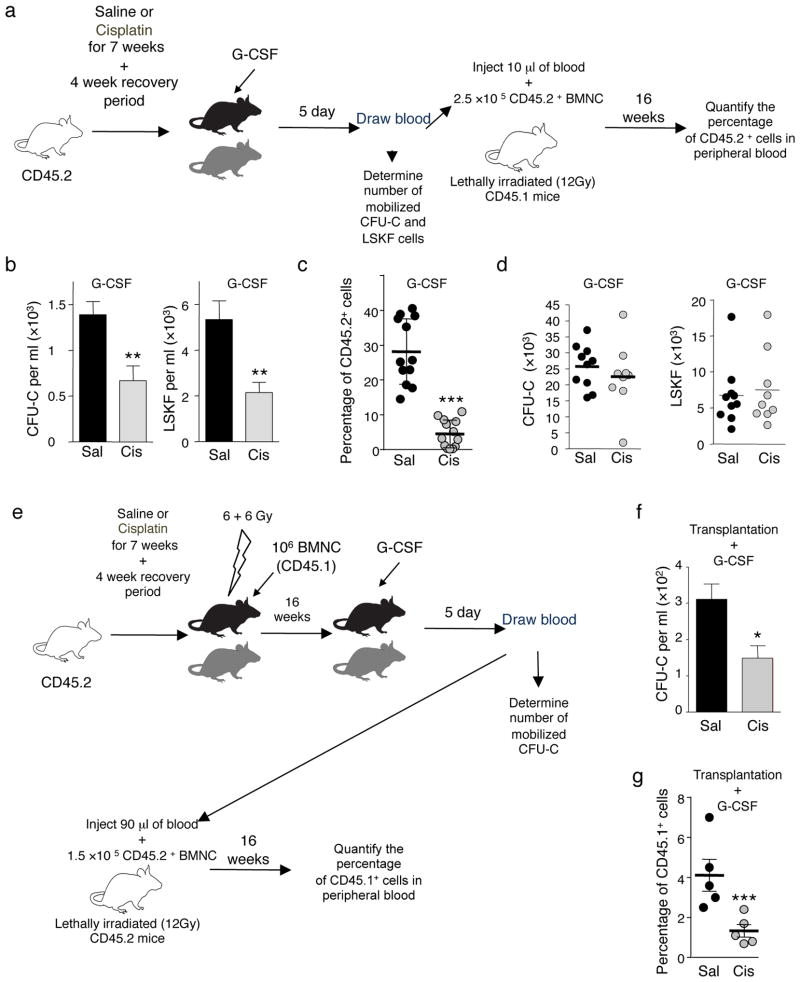
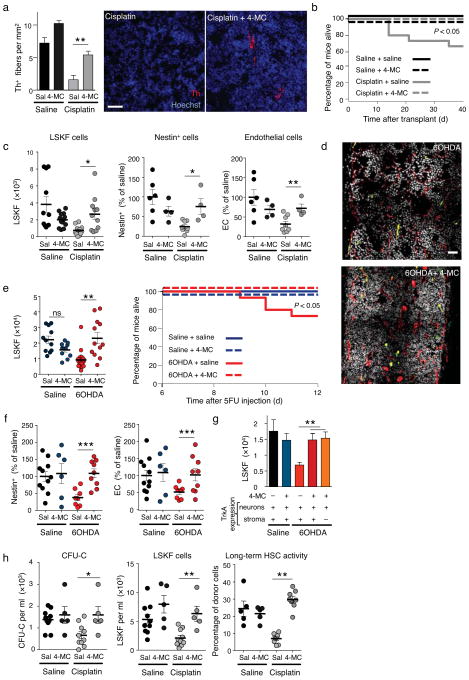
Anticancer chemotherapy drugs challenge hematopoietic tissues to regenerate but commonly produce long-term sequelae. Chemotherapy-induced deficits in hematopoietic stem or stromal cell function have been described, but the mechanisms mediating hematopoietic dysfunction remain unclear. Administration of multiple cycles of cisplatin chemotherapy causes substantial sensory neuropathy. Here we demonstrate that chemotherapy-induced nerve injury in the bone marrow of mice is a crucial lesion impairing hematopoietic regeneration. Using pharmacological and genetic models, we show that the selective loss of adrenergic innervation in the bone marrow alters its regeneration after genotoxic insult. Sympathetic nerves in the marrow promote the survival of constituents of the stem cell niche that initiate recovery. Neuroprotection by deletion of Trp53 in sympathetic neurons or neuroregeneration by administration of 4-methylcatechol or glial-derived neurotrophic factor (GDNF) promotes hematopoietic recovery. These results demonstrate the potential benefit of adrenergic nerve protection for shielding hematopoietic niches from injury.


Conflict of interest statement

COMPETING FINANCIAL INTERESTS

The authors declare no competing financial interests. Correspondence and requests for materials should be addressed to P.S.F. (paul.frenette@einstein.yu.edu)

Figures

Figure 1
Figure 1
Neurotoxic chemotherapy induces bone marrow SNS injury and reduces engraftment after transplantation. (a) Experimental design to determine the effect of cisplatin on BM regeneration after transplantation. (b) Quantification of sensory neuropathy in mice treated with cisplatin (n = 11) compared to saline control (n = 15). (c) Survival of saline (n = 15) or cisplatin-treated (n = 15) mice transplanted as in a. (d) Representative H&E staining of femoral BM of a moribund, cisplatin-treated mouse 8 days after transplantation. Scale bar, 250μm. (e) Quantification of Th+ fibers in BM of mice treated with saline (Sal), cisplatin (Cis), vincristine (Vin), or carboplatin (Car), 4 weeks after the last cisplatin injection; n = 4. (f) Representative immunofluorescence images to detect the presence of Th+ fibers in the BM; red, Th; blue, Hoechst. Scale bar, 50μm. (g) BMNC and LSKF cells per femur in BM of mice treated with saline (Sal; n = 13), cisplatin (Cis; n = 13), vincristine (Vin; n = 10), or carboplatin (Car; n = 6), 4 weeks after transplantation of 106 BMNC.
Figure 2
Figure 2
The SNS regulates BM recovery. (a) Experimental design to determine the effect of the 6OHDA-induced SNS lesion on BM regeneration after transplantation. (b) The left panel shows the survival of saline (n = 25) or 6OHDA-treated (n = 34) mice transplanted using the protocol depicted in a; the right panel shows the number of LSKF cells per femur in saline (n = 7) or 6OHDA-treated (n = 8) transplanted mice 4 weeks after transplantation. (c), Reduced survival of 6OHDA-sympathectomized mice (n = 29), compared to saline-treated controls (n = 17) following 5FU. (d) The left panel shows the number of BMNC per femur in mice treated with saline (blue) or 6OHDA (red) at days 0 (n = 5–8), 4 (n = 15–16), 8 (n = 13–15) and 12 (n = 21–22) after 5FU injection; the right panel shows the number of LSKF cells per femur in mice treated with saline (blue) or 6OHDA (red) at days 0 (n = 5–7), 4 (n = 5), 8 (n = 4–5) and 12 (n = 6–11) after 5FU injection. (e) Representative immunofluorescence images showing induction of apoptosis (TUNEL, red) in Th+ sympathetic neurons (blue) in superior cervical ganglia from WT or Th-Cre:iDTR mice 12h after diphtheria toxin injection. Scale bar 50 μm. (f) Quantification of BM Th+ fibers in WT or Th-Cre:iDTR mice 12 days after 5FU injection (n = 4); right panels show representative whole-mount immunofluorescence staining in the sternum; Th (red); VE cadherin (vessels, blue). Scale bar, 50μm. (g) BMNC and LSKF cells per femur in the BM of Th-Cre:iDTR or iDTR and Th-Cre (Ctrl) mice 12 days after DT treatment and 5FU injection (n = 6). (h) Number of LSKF cells per femur in the BM of WT or Adrb2/ mice treated with saline, SR59230A (SR; β3-AR blocker) or ICI118551 (ICI; β2-AR blocker).
Figure 3
Figure 3
Reduced BM recovery after cisplatin chemotherapy is due to SNS injury. (a) Representative immunofluorescence images of superior cervical ganglia showing apoptosis by TUNEL stain (red) in sympathetic neurons (Th, blue) of wild-type or Th-Cre:Trp53Δ/Δ mice 12h after cisplatin injection. Scale bar 25 μm (b) Representative immunofluorescence image of Th+ fibers in the BM of a Th-Cre:Trp53Δ/Δ mouse after cisplatin. Scale bar, 50 μm. (c) Quantification of Th+ fibers in the BM of cisplatin-treated control (WT) or Th-Cre:Trp53Δ/Δ (KO) mice, 4 weeks after the last cisplatin injection. (n = 3) (d) Overall survival of wild-type (WT; n = 18) or Th-Cre:Trp53Δ/Δ (n = 10) mice after cisplatin treatment and transplantation (n = 6–12). (e) BMNC, CFU-C and LSKF cells per femur in the BM of WT or Th-Cre:Trp53Δ/Δ (KO) littermates treated with saline or cisplatin 4 weeks after transplantation (n = 4–10).
Figure 4
Figure 4
β-adrenergic signals protect the niche from genotoxic insult. (a) Representative immunofluorescence BM images of saline- or 6OHDA-treated Nestin-gfp mice, 12 days after 5FU injection. Green: Nestin-GFP+ cells; red, CD31 (endothelial cells); blue, DAPI. (b) Number of Nestin-GFP+ and endothelial cells (EC) per femur in saline or 6OHDA-treated Nestin-gfp mice 24h or 12 days after 5FU injection (n = 6–8). (c) Representative flow cytometry plots (gated on live CD45Ter119 cells) showing nestin-GFP+ and CD31+ endothelial cells in mice treated with saline or ICI112851 (ICI; β2-AR blocker) and SR59230A (SR; β3-AR blocker), 12 days after 5FU injection. n = 5 (d) Number of nestin-GFP+ and endothelial cells (EC) per femur in mice treated as in c. (e) whole-mount immunofluorescence staining of the sternum; green: nestin-GFP+ cells; blue:VE cadherin (vessels); of mice treated with saline (sal) or cisplatin (cis) 4 weeks after transplantation of 106 BMNC. (f) Number of Nestin-GFP+ and endothelial cells (EC) per femur in mice treated as in e. (g, h) Number of Nestin-GFP+ and EC per femur in mice treated with saline or 6OHDA (n = 6–7) (g) or ICI112851 and SR59230A (h) 24 h after 5FU injection (n = 8).
Figure 5
Figure 5
Bone marrow SNS injury impairs progenitor mobilization. (a) Experimental design to determine whether cisplatin treatment prevents HSC mobilization. (b) CFU-C (right panel) and LSKF (left panel) counts in blood after G-CSF-induced mobilization in cisplatin or saline-treated mice (n = 10). (c) Competitive repopulation assay showing the percentage of CD45.2+ cells in the blood of CD45.1+ mice transplanted as indicated in a. (d) Number of total CFU-C (left panel) or LSKF (right panel) per femur in saline or cisplatin-treated mice, mobilized with G-CSF as indicated in a (n = 9–10). (e) Experimental design to assess whether the HSC mobilization defect in cisplatin-treated mice originates from the microenvironment. (f) CFU-C counts in blood after G-CSF-induced mobilization in cisplatin- or saline-treated mice transplanted and mobilized as indicated in e (n = 7–9). (g) Competitive repopulation assay showing the percentage of CD45.1+ cells in the blood of CD45.2+ mice transplanted as indicated in e.
Figure 6
Figure 6
Neuroprotection restores normal BM engraftment and mobilization. (a) Quantification of Th+ fibers in the BM of saline or cisplatin-treated mice after 4-MC neuroprotection, 4 weeks after the last cisplatin injection (n = 4–6). Representative immunofluorescence images showing Th+ fibers in the BM; red, Th; blue, DAPI. Scale bar, 40μm. (b) Overall survival of saline or cisplatin-treated mice after 4-MC neuroprotection and transplantation (n = 8–15). (c) The left panel shows the number of LSKF cells per femur in the BM of the mice analyzed in a (n = 11–13). Statistical comparisons were performed using the Mann Whitney method. The center and right panels show the percentage of Nestin-GFP+ or endothelial cells per femur in Nestin-Gfp mice treated with saline, cisplatin and 4-MC, 4 weeks after BM transplantation (n = 4). (d) Representative composite patchwork of femoral sections, 12 days after 5FU injection, of Nestin-gfp mice treated with saline, 6OHDA and 4-MC; red: CD31, white: DAPI, green: nestin-GFP+ cells. Scale bar, 100μm (e) Number of LSKF cells per femur in mice treated with saline, 6OHDA and 4-MC, 12 days after 5FU injection (n = 5–7). Statistical comparisons were performed using the Mann Whitney method; the right panel shows the overall survival of saline or 6OHDA-treated mice after 4-MC neuroprotection and 5FU injection (n = 8–29). (f) Percentage of nestin-GFP+ or endothelial cells per femur in Nestin-Gfp mice treated with saline, 6OHDA and 4-MC, 12 days after 5FU injection (n = 5–11). (g) Number of LSKF cells per femur in WT or Tα1-Cre:TrkANeo/Neo mice treated with 6OHDA and 4-MC, 12 days after 5FU injection (n = 3–8). (h) CFU-C and LSKF counts per ml of blood in saline (Sal) or cisplatin-treated mice after 4-MC neuroprotection and G-CSF mobilization; the right panel indicates the percentage of CD45.2+ cells in peripheral blood of CD45.1+ mice transplanted with 10μl of G-CSF mobilized blood and 2.5× 10⁵ competitor CD45.1+ BMNC.

Comment in

Similar articles

Cited by

References

    1. Hooper AT, et al. Engraftment and reconstitution of hematopoiesis is dependent on VEGFR2-mediated regeneration of sinusoidal endothelial cells. Cell Stem Cell. 2009;4:263–274. - PMC - PubMed
    1. Banfi A, et al. High-dose chemotherapy shows a dose-dependent toxicity to bone marrow osteoprogenitors: a mechanism for post-bone marrow transplantation osteopenia. Cancer. 2001;92:2419–2428. - PubMed
    1. Dominici M, et al. Restoration and reversible expansion of the osteoblastic hematopoietic stem cell niche after marrow radioablation. Blood. 2009 - PMC - PubMed
    1. Mauch P, et al. Hematopoietic stem cell compartment: acute and late effects of radiation therapy and chemotherapy. Int J Radiat Oncol Biol Phys. 1995;31:1319–1339. - PubMed
    1. Haas R, et al. Patient characteristics associated with successful mobilizing and autografting of peripheral blood progenitor cells in malignant lymphoma. Blood. 1994;83:3787–3794. - PubMed

Publication types

MeSH terms

Substances