. 2013 Jun 6;121(23):4672-83.
doi: 10.1182/blood-2012-08-453738. Epub 2013 Apr 30.

LAMP1/CD107a is required for efficient perforin delivery to lytic granules and NK-cell cytotoxicity

Affiliations

LAMP1/CD107a is required for efficient perforin delivery to lytic granules and NK-cell cytotoxicity

Konrad Krzewski et al. Blood. .

Abstract

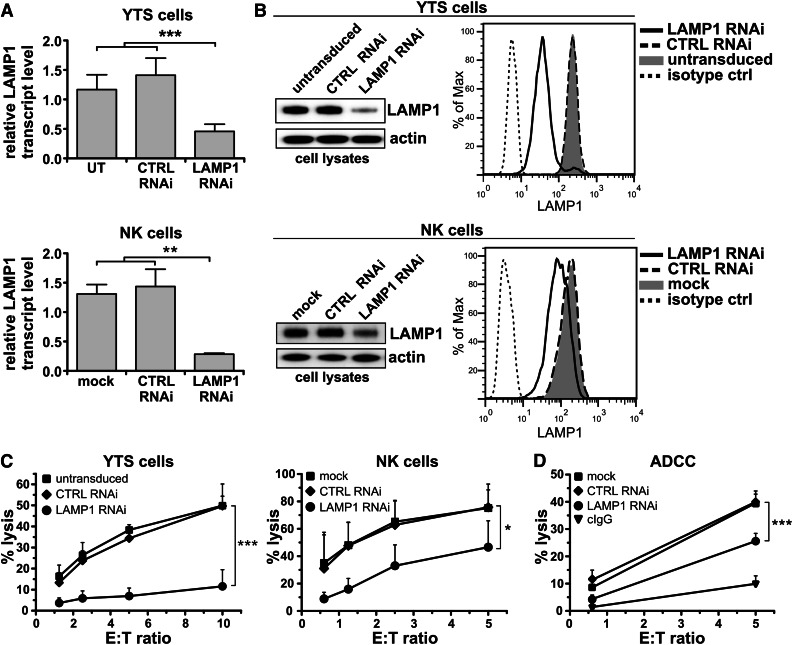
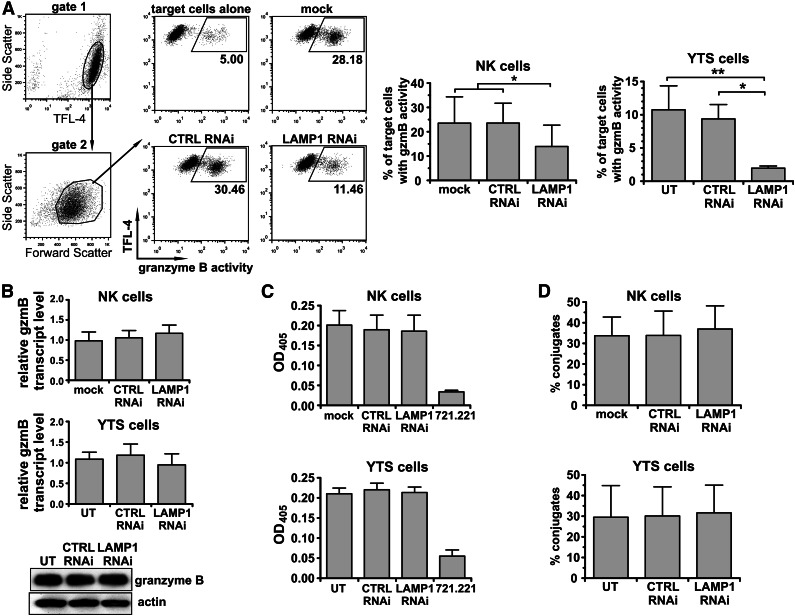
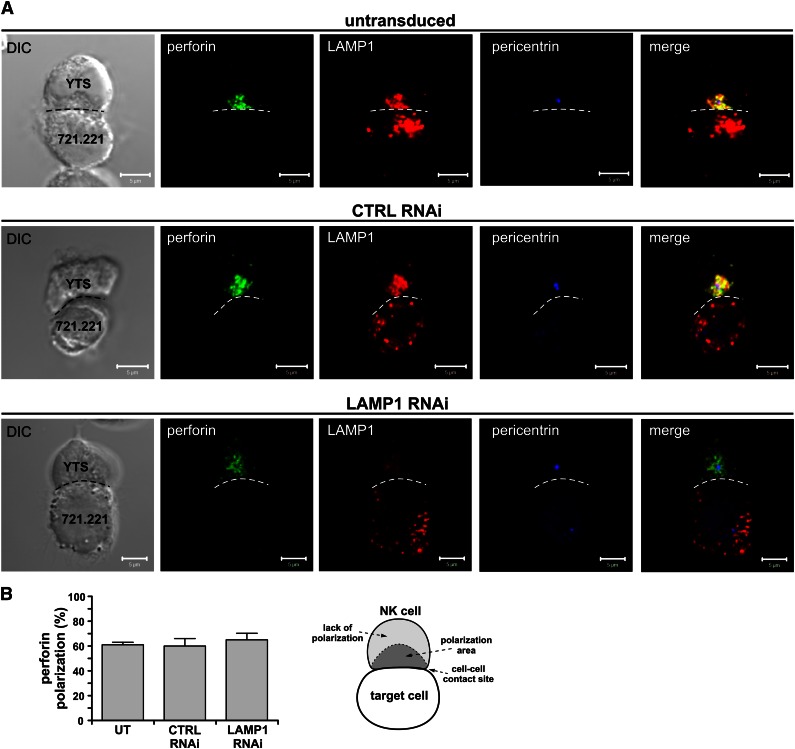
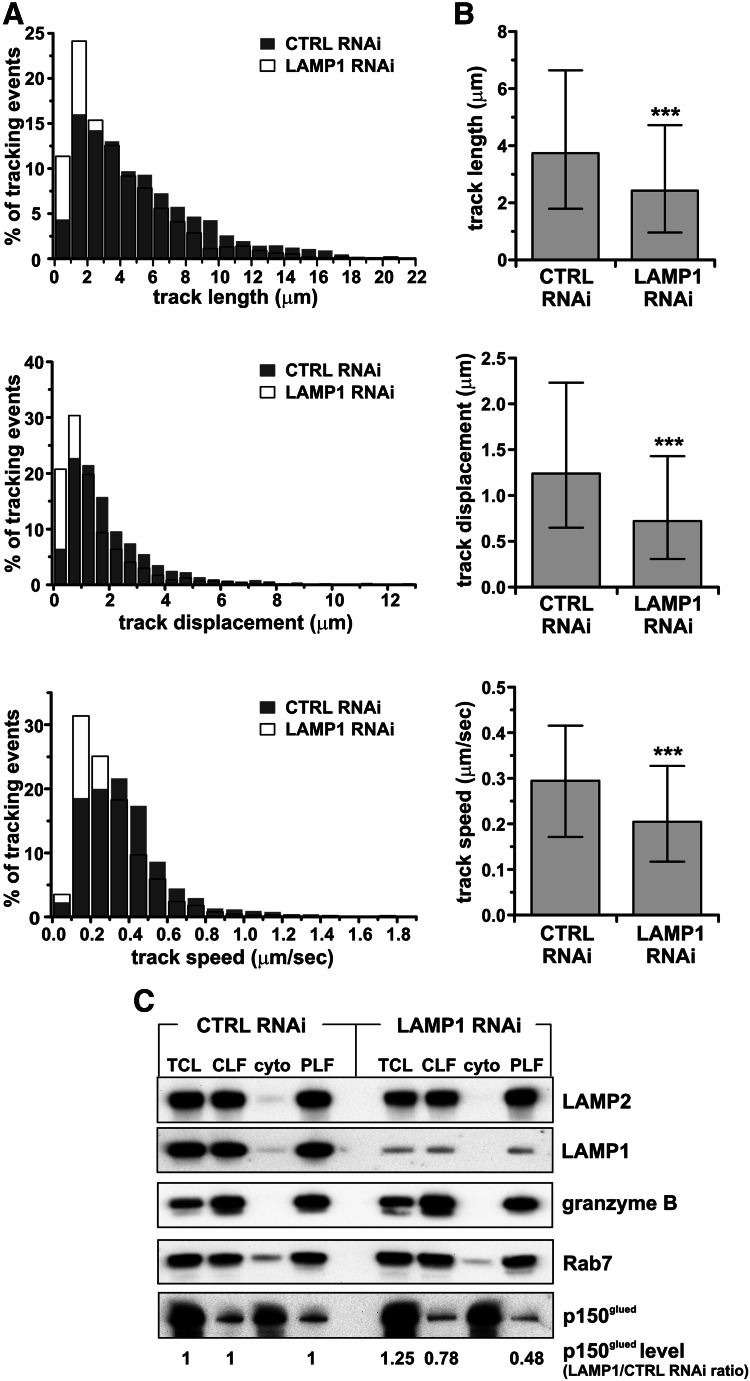
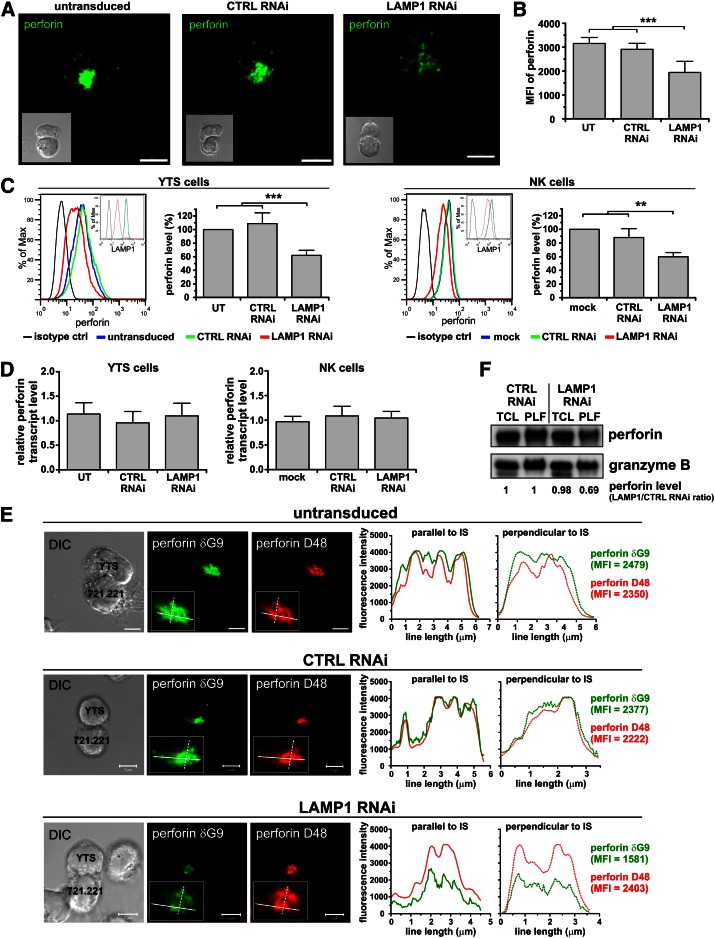
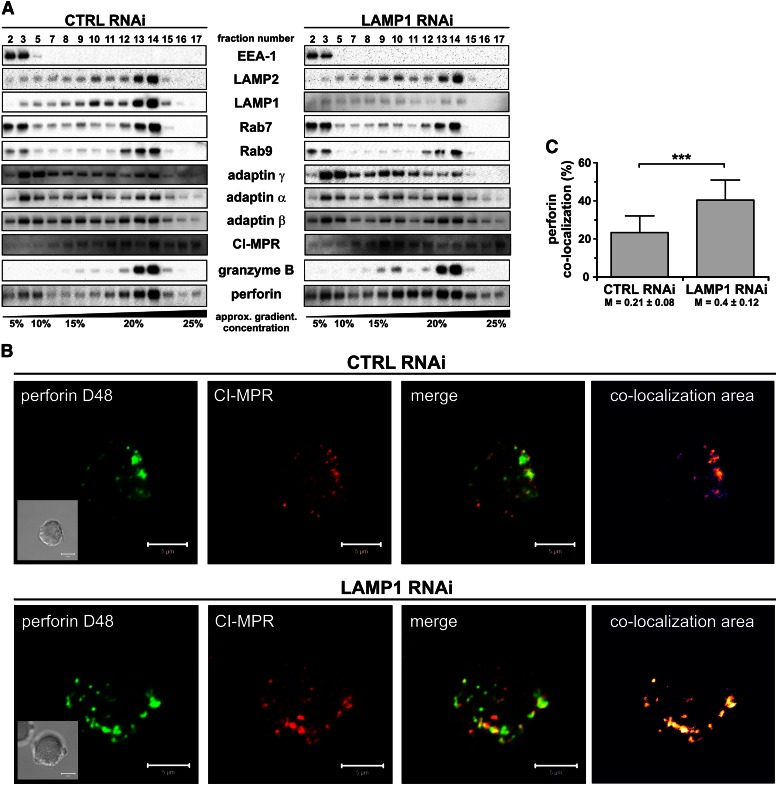
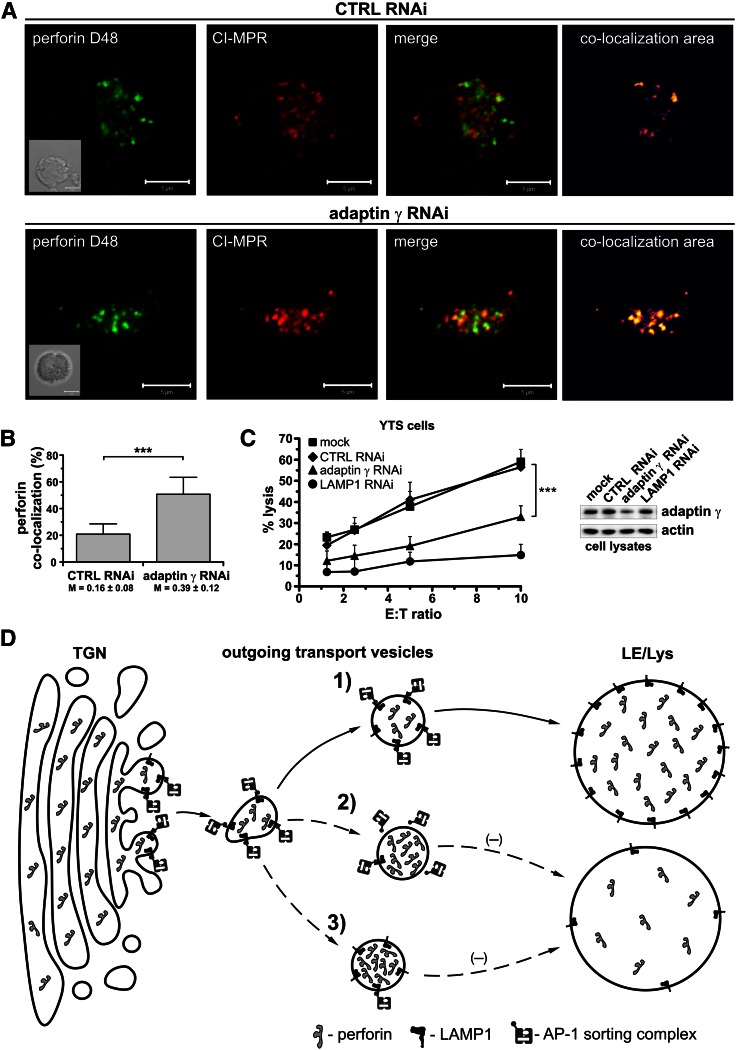
Secretory lysosomes of natural killer (NK) cells, containing perforin and granzymes, are indispensable for NK-cell cytotoxicity because their release results in the induction of target-cell apoptosis. Lysosome-associated membrane protein (LAMP) 1/CD107a is used as a marker for NK-cell degranulation, but its role in NK-cell biology is unknown. We show that LAMP1 silencing causes inhibition of NK-cell cytotoxicity, as LAMP1 RNA interference (RNAi) cells fail to deliver granzyme B to target cells. Reduction of LAMP1 expression affects the movement of lytic granules and results in decreased levels of perforin, but not granzyme B, in the granules. In LAMP1 RNAi cells, more perforin is retained outside of lysosomal compartments in trans-Golgi network-derived transport vesicles. Disruption of expression of LAMP1 binding partner, adaptor protein 1 (AP-1) sorting complex, also causes retention of perforin in the transport vesicles and inhibits cytotoxicity, indicating that the interaction between AP-1 sorting complex and LAMP1 on the surface of the transport vesicles is important for perforin trafficking to lytic granules. We conclude that the decreased level of perforin in lytic granules of LAMP1-deficient cells, combined with disturbed motility of the lytic granules, leads to the inability to deliver apoptosis-inducing granzyme B to target cells and to inhibition of NK-cell cytotoxicity.


Figures

Figure 1
Figure 1
Disruption of LAMP1 expression inhibits cytotoxic activity of NK cells. (A) YTS (top) or ex vivo isolated NK cells (bottom) were untransduced (UT; YTS cells), mock-transduced (mock; NK cells), or transduced with control (CTRL) or LAMP1 RNAi. Levels of LAMP1 transcripts in the indicated cells were analyzed by real-time PCR; relative expression of LAMP1, normalized to actin, is shown. Data are represented as mean + standard deviation (SD) from 6 (YTS) or 3 (NK) analyses. **P < .01; ***P < .001; one-way analysis of variance (ANOVA). (B) Protein level of LAMP1 in the indicated cells was analyzed by western blot (left; actin was used as a loading control) and by flow cytometry (right). (C) Cytotoxic activity of YTS and NK cells, untransduced, mock-transduced, or transduced with CTRL or LAMP1 RNAi. The percentages of 721.221 target-cell lysis for different effector-to-target (E:T) ratios are shown as mean values + SD determined from at least 5 experiments. *P < .05; ***P < .001; 2-way ANOVA. (D) Ab-dependent cell-mediated cytotoxicity. Ex vivo isolated NK cells, either mock-transduced or transduced with CTRL or LAMP1 RNAi, were incubated with SK-OV3 target cells, in the presence of either human IgG (negative control) or anti-HER2 Ab. The percentage of target-cell lysis was determined from 3 experiments with different donors and is shown as means + SD. ***P < .001; 2-way ANOVA.
Figure 2
Figure 2
Delivery of granzyme B to target cells, but not cell-cell conjugation, is impaired in LAMP1 RNAi cells. YTS or ex vivo isolated NK cells were untransduced (UT; YTS cells), mock-transduced (mock; NK cells), or transduced with control (CTRL) or LAMP1 RNAi. (A) Delivery of granzyme B to target cells. The 721.221 target cells were labeled with TFL-4 and a fluorogenic substrate of granzyme B and then mixed with NK cells for 30 minutes at 37°C. The increase of substrate fluorescence in TFL-4–positive target cells, indicating the activity of granzyme B, was monitored by flow cytometry. The dot plots show gating strategies used and illustrate an example of the results for primary NK cells. Graphs (right) show mean values + SD determined from 5 (NK) or 3 (YTS) experiments. *P < .05; **P < .01; 1-way ANOVA. (B) Levels of granzyme B. Granzyme B transcript levels for YTS and primary NK cells were analyzed by real-time PCR. Relative expression of granzyme B, normalized to actin, is shown as mean + SD from 3 (NK) or 6 (YTS) experiments. Granzyme B protein level in YTS cells was visualized by western blotting; actin was used as a loading control. (C) Granzyme B activity. YTS or primary NK cells were lysed, and the proteolytic activity of granzyme B in total cell lysates was determined by measuring the hydrolysis of the peptide substrate. The graphs show mean values + SD from 5 (NK) or 3 (YTS) experiments. Granzyme B–negative 721.221 cells served as a control. (D) Cell conjugation. YTS or primary NK cells were stained with 5-chloromethylfluorescein diacetate (CMFDA) and mixed with TFL-4–labeled 721.221 target cells for 30 minutes at 37°C. Cells were then fixed and analyzed using flow cytometry. Conjugates of NK and target cells were determined by measuring the percentage of CMFDA+TFL-4+ double-positive cells from the total pool of live CMFDA+ cells. The mean values + SD were determined from 4 experiments.
Figure 3
Figure 3
Effects of LAMP1 silencing on recruitment of perforin to the immunologic synapse. (A) YTS cells, untransduced or transduced with control (CTRL) or LAMP1 RNAi, were activated by mixing with 721.221 target cells for 30 minutes at 37°C. The cells were next fixed and stained with Ab’s against LAMP1 (red), pericentrin (MTOC marker; blue), and perforin (green). The dashed line indicates the position of the immunologic synapse. Scale bars represent 5 μm. (B) The percentages of perforin polarization to the immunologic synapse in YTS cells conjugated with 721.221 target cells, as in (A). Error bars represent SD. The values were determined by evaluation of 150 conjugates for each indicated YTS cell group in 3 experiments. The diagram (right) illustrates the scoring model. Perforin was regarded as polarized if it localized to a conical area (dark gray region in the diagram labeled as polarization area), limited by the center of the cell and the edge points of the cell-cell interface (shown as the dashed line in the illustration), and the MTOC (as determined by pericentrin staining) was adjacent to the cell-cell contact site.
Figure 4
Figure 4
Impairment of lytic granule movement caused by LAMP1 deficiency. YTS cells, stably transduced with control (CTRL) or LAMP1 RNAi, were labeled with LysoTracker Red. The cells were visualized using spinning disk confocal microscopy, and the movement of LysoTracker-labeled vesicles was recorded in 3 dimensions (x-y-z plane) for 180 seconds. The characteristics of vesicle trajectories were derived from analysis of 10 (LAMP1 RNAi) or 11 (CTRL RNAi) cells in 3 experiments. (A) Histograms of frequency distributions of the length (top), displacement (the distance in straight line between the beginning and end of the track; middle), and mean velocity (bottom) of granule trajectories in CTRL and LAMP1 RNAi cells. (B) Graphs show the median values and interquartile range of the length, displacement, and velocity of granules from CTRL and LAMP1 RNAi cells. ***P < .001; Mann-Whitney U test. Granules in LAMP1 RNAi cells formed shorter tracks, with the majority (75%) in the range of 0.96 to 4.7 μm, whereas in CTRL RNAi cells the majority of tracks were in the range of 1.8 to 6.6 μm. The median track length in LAMP1 RNAi cells was 2.43 μm, and 3.74 μm in CTRL RNAi cells. The track displacement was also decreased in LAMP1 RNAi cells: 0.3 to 1.4 μm vs 0.65 to 2.2 μm in CTRL RNAi cells; the median displacement value was 0.72 μm and 1.24 μm in LAMP1 and CTRL RNAi cells, respectively. The majority of vesicles in LAMP1 RNAi cells moved at 0.12 to 0.33 μm/s, whereas in CTRL RNAi cells they moved in the range of 0.17 to 0.42 μm/s (in agreement with Mentlik et al); the median speed was 0.2 μm/s in LAMP1 RNAi cells, compared with 0.29 μm/s in CTRL RNAi cells. (C) LAMP1 is required for proper recruitment of p150glued/dynactin to lytic granules. YTS cells, transduced with either CTRL or LAMP1 RNAi, were homogenized, and their lytic granules were purified on a 10% to 40% discontinuous gradient of iodoxanol. The presence of proteins in the total cell lysate (TCL), CLF, cytoplasmic fraction (cyto), and purified lysosomal fraction (PLF) was assessed by immunoblotting with the Ab’s specific for the indicated proteins; granzyme B and LAMP2 were used as loading controls. The result is representative of 2 separate experiments. The changes in p150glued levels, normalized to LAMP2 levels, were calculated as the ratio between p150glued band intensity from LAMP1 and CTRL RNAi cells in the appropriate samples (eg, p150glued band intensity from LAMP1 RNAi cell PLF sample divided by the band intensity from CTRL RNAi cell PLF sample).
Figure 5
Figure 5
Disruption of LAMP1 expression results in decreased association of perforin with lytic granules. YTS or ex vivo isolated NK cells were untransduced (UT; YTS cells), mock-transduced (mock; NK cells), or transduced with control (CTRL) or LAMP1 RNAi. (A) Visualization of perforin in cells. YTS cells were mixed with 721.221 target cells for 30 minutes at 37°C. The cells were fixed and stained with anti-perforin δG9 Ab. Multiple optical sections were acquired every 0.3 μm in order to visualize all the perforin in the cell. The images show two-dimensional reconstruction of overlaid optical sections of the indicated transduced YTS cells interacting with the target cells. Inserts show differential interference contrast (DIC) images of the conjugated cells (YTS cell is depicted above the target cell). Scale bars represent 5 μm. (B) The summary of perforin fluorescence intensity quantification. Perforin in YTS cells was visualized by staining with anti-perforin δG9 Ab. The intensity of main perforin cluster (as defined in the supplemental Methods and supplemental Figure 3) was measured and plotted as mean + SD. The data were determined in 2 experiments by analyzing the following cell numbers: UT, n = 21; CTRL RNAi, n = 12; LAMP1 RNAi, n = 25 cells. (C) Intracellular levels of perforin. YTS or NK cells were fixed, permeabilized, stained with anti-perforin δG9 Ab and analyzed using flow cytometry. Representative histograms of perforin staining by flow cytometry (left; inserts show the protein level of LAMP1), whereas the graphs (right) summarize mean values + SD of the median perforin fluorescence from 4 (NK) or 7 (YTS) experiments. The perforin level in mock-transduced or untransduced cells was regarded as 100%, and the changes in perforin level in relation to the mock-transduced or untransduced cells are indicated for CTRL and LAMP1 RNAi cells. Asterisks in (B) and (C) indicate statistical significance: **P < .01; ***P < .001; 1-way ANOVA. (D) Perforin mRNA levels. Transcripts of perforin in the indicated cells were measured by real-time PCR; relative expression of perforin, normalized to actin, is shown. Data are represented as mean values + SD from 4 or 7 experiments, using NK and YTS cells, respectively. (E) Decreased levels of lysosomal perforin in cells with LAMP1 knockdown. The indicated YTS cells were mixed with 721.221 cells for 30 minutes at 37°C. The cells were fixed, stained with anti-perforin D48 Ab followed by DyLight 549–conjugated isotype specific anti-mouse Ab (red), and then stained with Alexa Fluor 488–conjugated anti-perforin δG9 Ab (green). The inserts show close-ups of perforin polarized to the cell-cell contact area. The plots (right) show profiles of the fluorescence intensity of anti-perforin staining using δG9 or D48 Ab, measured along the lines drawn across the widest area parallel or perpendicular to the cell-cell contact site and indicated in the inserts of the images. Scale bars represent 5 μm. (F) Perforin level in TCL or PLF from YTS cells transduced with CTRL or LAMP1 RNAi was analyzed by western blot (using anti-perforin Pf-344 Ab). Anti–granzyme B immunoblotting was used as a loading control. The result is demonstrative of 3 experiments. The changes in perforin levels, normalized to granzyme B levels, were calculated as the ratio between perforin band intensity from LAMP1 and CTRL RNAi cells in the appropriate sample, as described in Figure 4C.
Figure 6
Figure 6
LAMP1 is required for efficient delivery of perforin, but not granzyme B, to lytic granules. (A) YTS cells, transduced with CTRL or LAMP1 RNAi, were homogenized and fractionated on a continuous 0% to 30% gradient of iodoxanol. The presence of the indicated proteins in the gradient fractions was assessed by immunoblotting; only relevant fractions are shown. The data are representative of 3 experiments. EEA-1 was used as a marker of early endosomes; Rab9, late endosomes; Rab7, late endosomes/lysosomes; and LAMP2, lysosomes. Adaptin γ and MPR were used as markers of TGN-derived transport vesicles. (B) YTS cells were fixed, stained with anti–CI-MPR Ab followed by DyLight 649–conjugated anti-mouse Ab (red), and then stained with Alexa Fluor 488–conjugated anti-perforin D48 Ab (green). The area of colocalization between the 2 fluorophores is shown as a heat map image. Scale bars represent 5 μm. Inserts show DIC images. (C) The percentage of colocalization between perforin (D48-reactive) and CI-MPR. The data were determined by analysis of 34 to 35 cells, as described in (B), and are shown as mean values + SD from 2 experiments. The numbers below the graph are Manders overlap coefficients ± SD. ***P < .001; Mann-Whitney U test.
Figure 7
Figure 7
Silencing of adaptin γ causes retention of perforin in transport vesicles and blocks cytotoxicity. (A) YTS cells, transduced with CTRL or adaptin γ RNAi, were fixed, stained with anti–CI-MPR Ab followed by AlexaFluor 568–conjugated anti-mouse Ab (red), and then stained with Alexa Fluor 488–conjugated anti-perforin D48 Ab (green). The area of colocalization between the 2 fluorophores is shown as a heat map image. Scale bars represent 5 μm. Inserts show DIC images. (B) The percentage of colocalization between perforin (D48-reactive) and CI-MPR. The data were determined by analysis of 20 (CTRL RNAi) or 39 (adaptin γ RNAi) cells and are represented as mean values + SD from 2 experiments. The numbers below the graph show Manders overlap coefficients ± SD. ***P < .001; Mann-Whitney U test. (C) Cytotoxic activity of YTS cells, mock-transduced or transduced with CTRL, adaptin γ, or LAMP1 RNAi. The graph shows the percentage of 721.221 target-cell lysis at different E:T ratios and illustrates mean values + SD from 3 independent experiments. The image (right) shows the result of immunoblotting with anti–adaptin γ or anti-actin (loading control) Ab’s in the indicated cells. (D) A model of LAMP1 function. The proteins destined for the lysosomes, such as perforin, leave the TGN in the outgoing transport vesicles and reach their destination due to the action of AP sorting complexes. In normal conditions (1), the AP-1 sorting complex recognizes and binds LAMP1 on the surface of the outgoing vesicles, allowing for transport of the LAMP1-positive, perforin-containing vesicles to the late endosomal/lysosomal (LE/Lys) compartment. Therefore, disrupting the interaction between LAMP1 and AP-1 would negatively affect perforin trafficking to the lysosomes. Silencing of LAMP1 (2), for example, would remove the AP-1 binding partner from the surface of the transport vesicles, preventing binding of AP-1 and causing retention of perforin in those vesicles. Consequently, less perforin would reach the lysosomes/lytic granules. Similarly, silencing of adaptin γ (and subsequent disruption of AP-1 expression) (3) would inhibit vesicle sorting, leading to the accumulation of the perforin-containing transport vesicles and decreased level of perforin in the secretory lysosomes.

Similar articles

Cited by

References

    1. Vivier E, Tomasello E, Baratin M, Walzer T, Ugolini S. Functions of natural killer cells. Nat Immunol. 2008;9(5):503-510. - PubMed
    1. Orange JS. Formation and function of the lytic NK-cell immunological synapse. Nat Rev Immunol. 2008;8(9):713–725. - PMC - PubMed
    1. Krzewski K, Coligan JE. Human NK cell lytic granules and regulation of their exocytosis. Front Immunol. 2012;3:335. - PMC - PubMed
    1. Voskoboinik I, Smyth MJ, Trapani JA. Perforin-mediated target-cell death and immune homeostasis. Nat Rev Immunol. 2006;6(12):940–952. - PubMed
    1. Pipkin ME, Lieberman J. Delivering the kiss of death: progress on understanding how perforin works. Curr Opin Immunol. 2007;19(3):301–308. - PubMed

Publication types

MeSH terms