. 2013 Jun 14;288(24):17313-35.
doi: 10.1074/jbc.M112.401174. Epub 2013 Apr 29.

Tubulin polymerization-promoting protein (TPPP/p25α) promotes unconventional secretion of α-synuclein through exophagy by impairing autophagosome-lysosome fusion

Affiliations

Tubulin polymerization-promoting protein (TPPP/p25α) promotes unconventional secretion of α-synuclein through exophagy by impairing autophagosome-lysosome fusion

Patrick Ejlerskov et al. J Biol Chem. .

Abstract

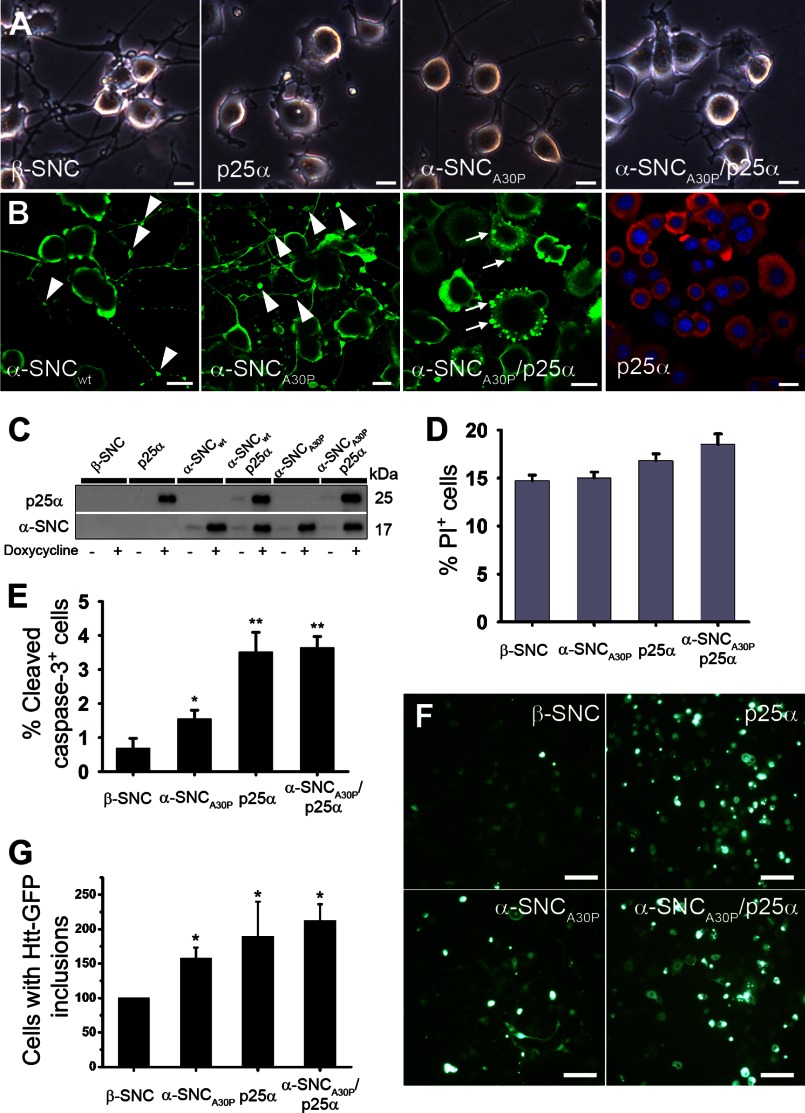
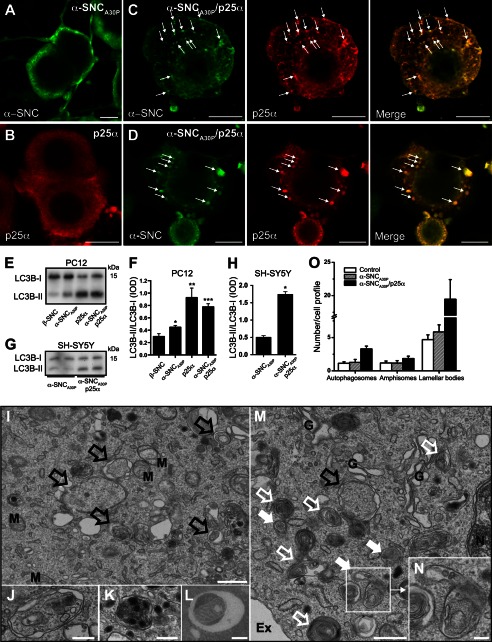
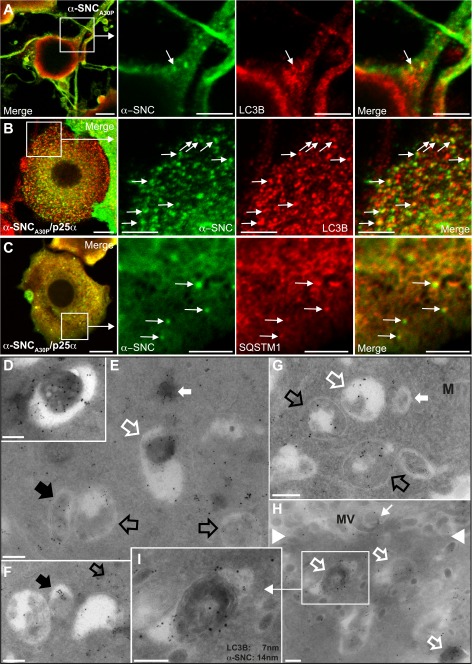
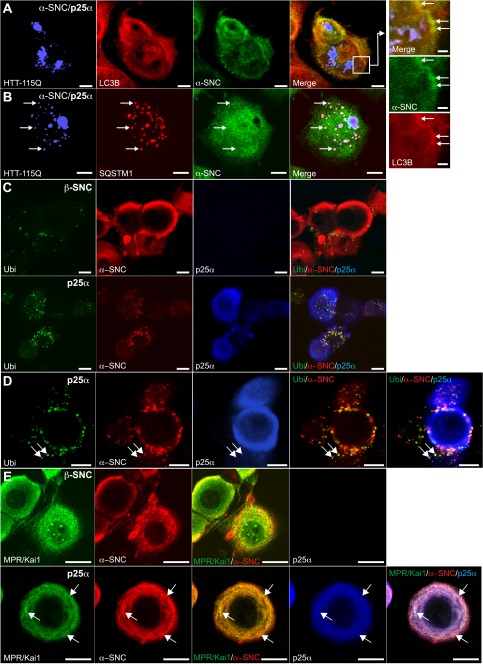
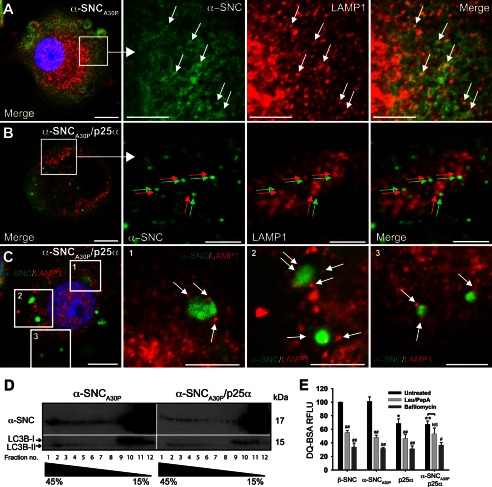
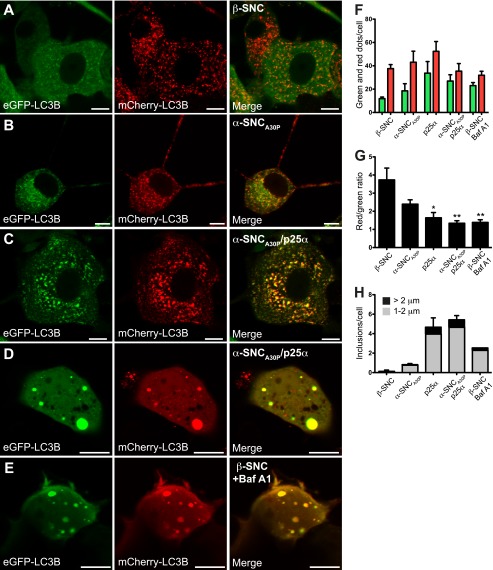
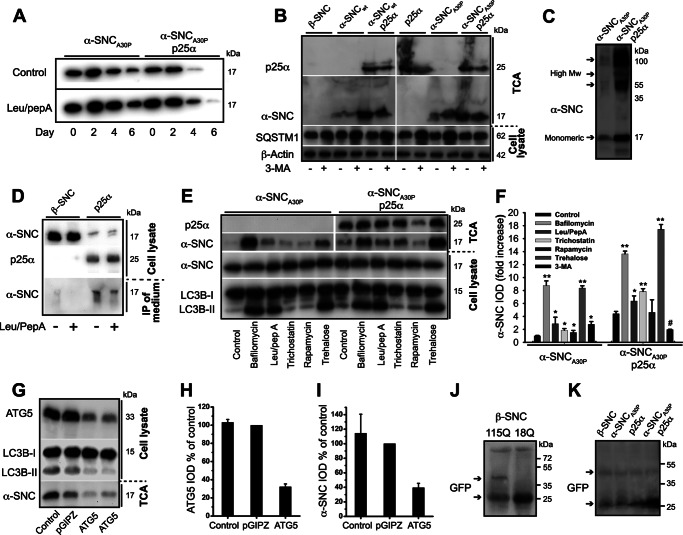
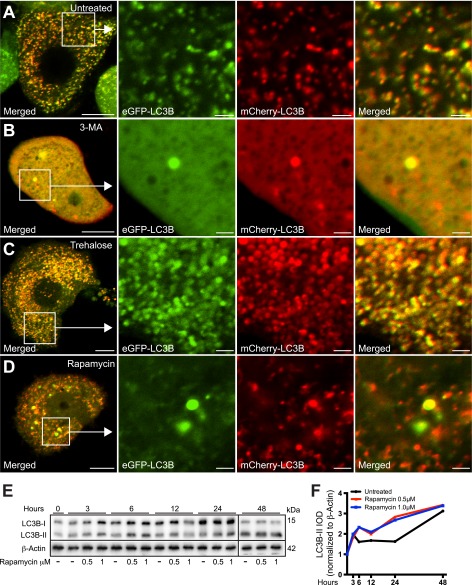
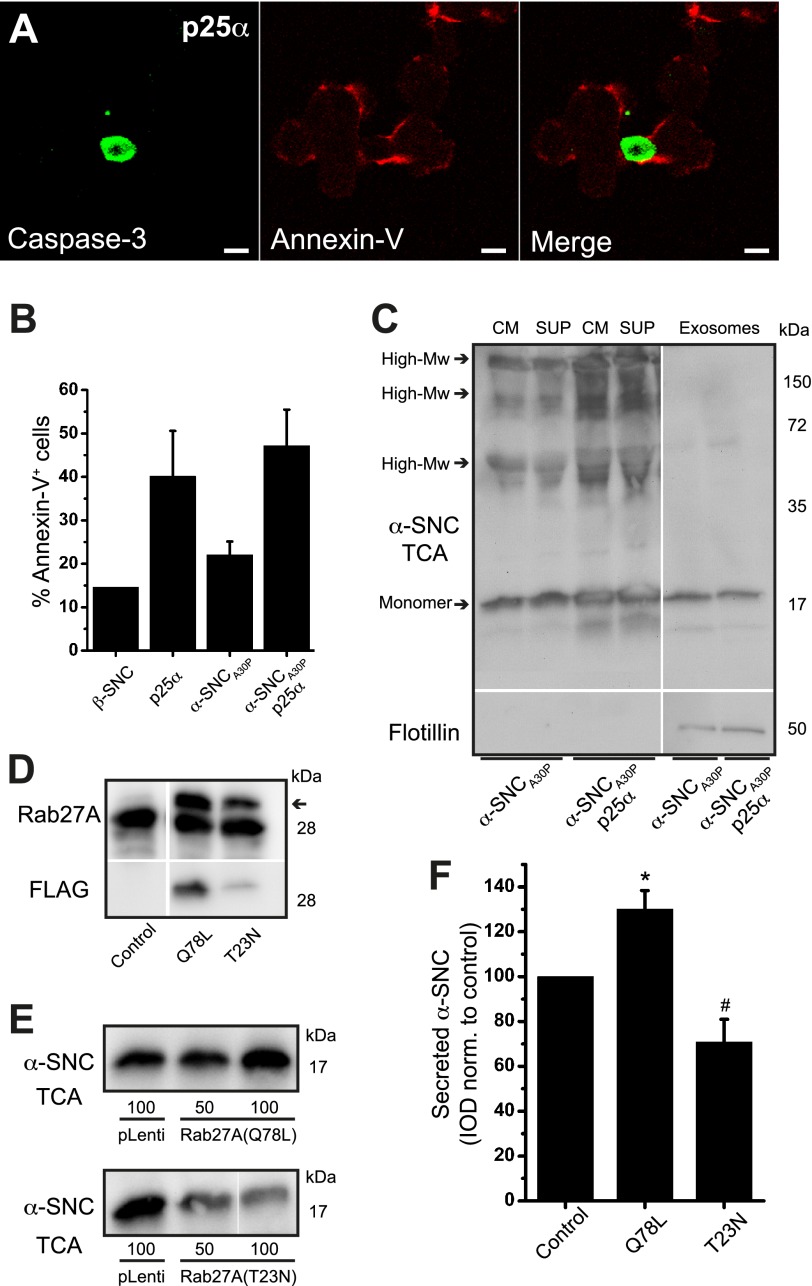
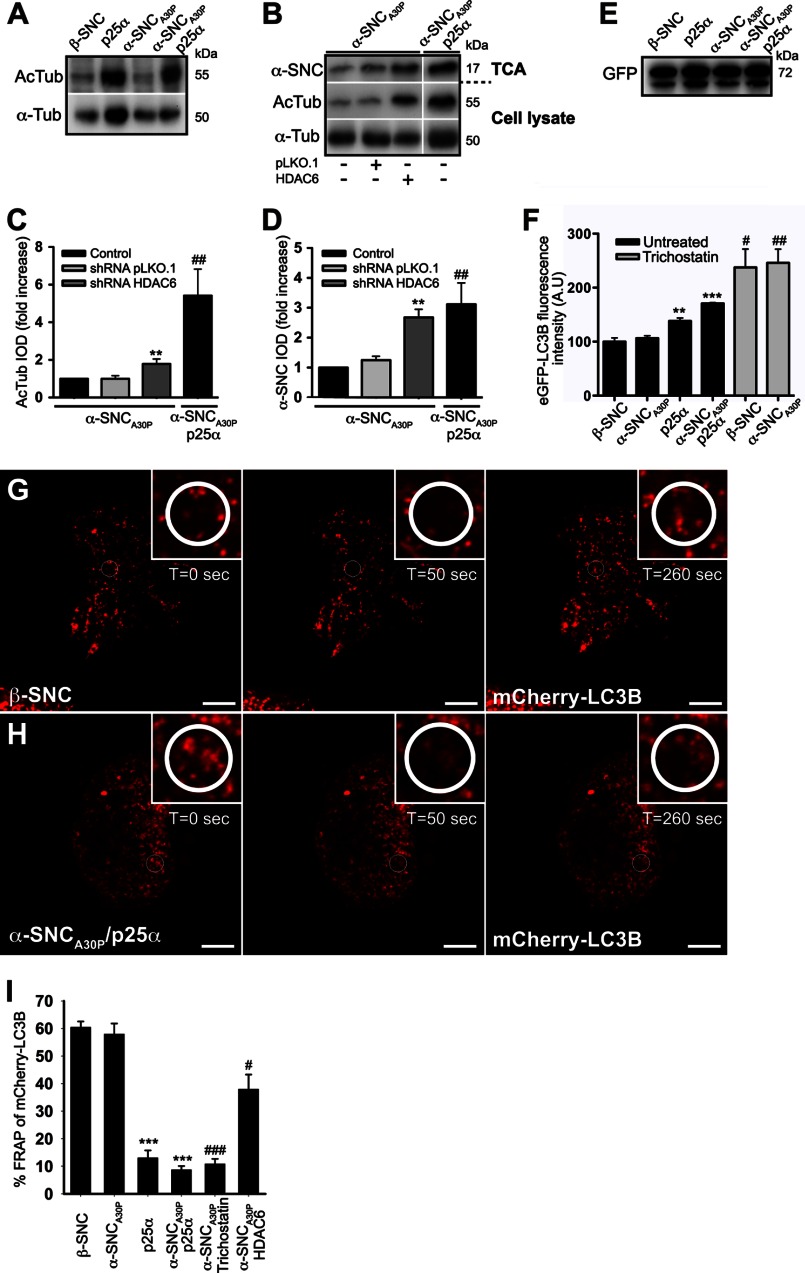
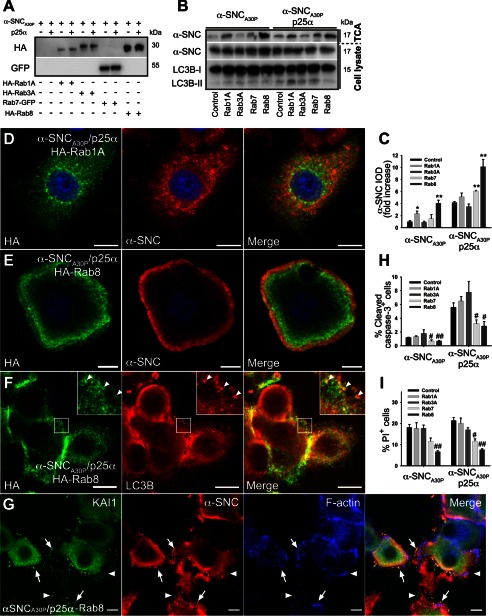
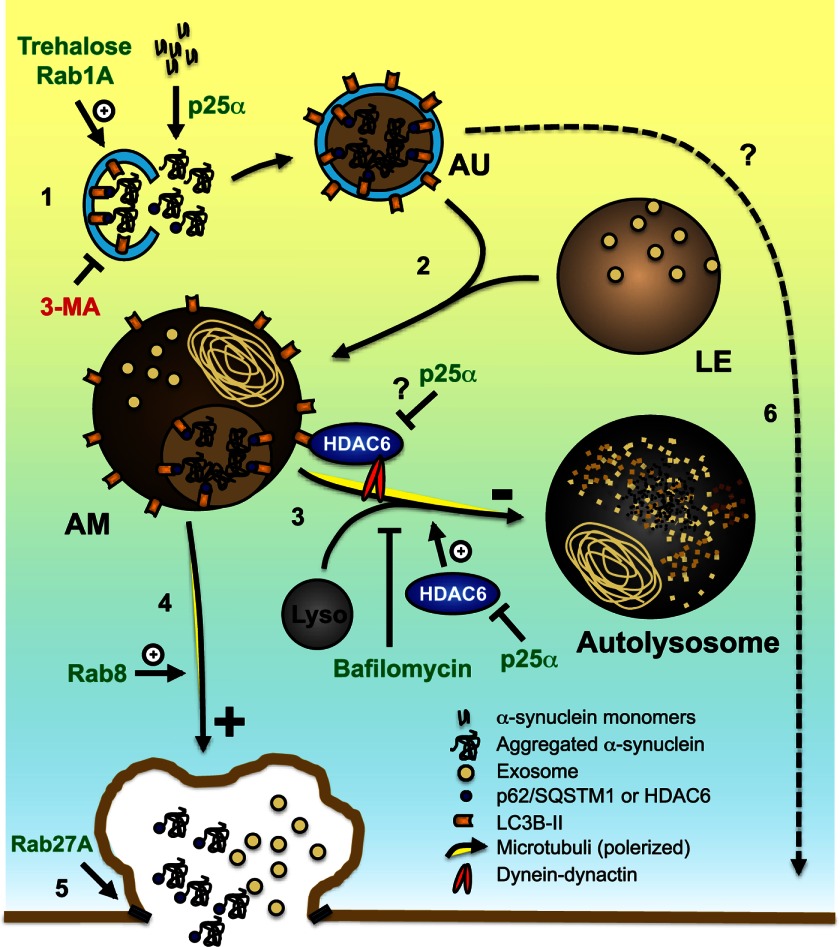
Aggregation of α-synuclein can be promoted by the tubulin polymerization-promoting protein/p25α, which we have used here as a tool to study the role of autophagy in the clearance of α-synuclein. In NGF-differentiated PC12 catecholaminergic nerve cells, we show that de novo expressed p25α co-localizes with α-synuclein and causes its aggregation and distribution into autophagosomes. However, p25α also lowered the mobility of autophagosomes and hindered the final maturation of autophagosomes by preventing their fusion with lysosomes for the final degradation of α-synuclein. Instead, p25α caused a 4-fold increase in the basal level of α-synuclein secreted into the medium. Secretion was strictly dependent on autophagy and could be up-regulated (trehalose and Rab1A) or down-regulated (3-methyladenine and ATG5 shRNA) by enhancers or inhibitors of autophagy or by modulating minus-end-directed (HDAC6 shRNA) or plus-end-directed (Rab8) trafficking of autophagosomes along microtubules. Finally, we show in the absence of tubulin polymerization-promoting protein/p25α that α-synuclein release was modulated by dominant mutants of Rab27A, known to regulate exocytosis of late endosomal (and amphisomal) elements, and that both lysosomal fusion block and secretion of α-synuclein could be replicated by knockdown of the p25α target, HDAC6, the predominant cytosolic deacetylase in neurons. Our data indicate that unconventional secretion of α-synuclein can be mediated through exophagy and that factors, which increase the pool of autophagosomes/amphisomes (e.g. lysosomal disturbance) or alter the polarity of vesicular transport of autophagosomes on microtubules, can result in an increased release of α-synuclein monomer and aggregates to the surroundings.

Keywords: Autophagosomes; Exophagy; HDAC6; Parkinson Disease; Protein Degradation; Protein Secretion; Trafficking; p25α; α-Synuclein.


Figures

FIGURE 1.
FIGURE 1.
Conditional expression of p25α and α-synuclein in NGF-differentiated PC12 nerve cells. PC12 cells were predifferentiated with 100 ng/ml NGF for 2 days, and then transgene expression of β-synuclein (β-SNC), p25α, α-synucleinwt-SNCwt), α-synucleinA30P-SNCA30P), or α-SNCA30P and p25α was induced by doxycycline treatment for additionally 2 days. A, bright field images showing p25α-mediated impairment of neurite outgrowth. Bars, 20 μm. B, indirect immunofluorescence of PC12 cells expressing α-SNCwt, α-SNCA30P, α-SNCA30P/p25α, or p25α alone with antibodies against α-SNC (BD Transduction Laboratories) (green) or p25α (red). Arrowheads indicate neurite blebbing, and arrows indicate α-SNC-positive inclusions. Bars, 20 μm. C, representative Western blots of transgene expression in doxycycline-treated or -nontreated PC12 cell lines analyzed with antibodies against p25α and α-SNC (BD Transduction Laboratories) as indicated. D, flow cytometry analysis of PI uptake as a measurement of cell death. The graph shows mean ± S.E. of PI-positive cells as a percentage of the whole population (n = 3). E, quantitation of caspase-3-positive cells detected by indirect immunofluorescence and counting. The bar graph shows mean ± S.E. values as percentage caspase-3-positive cells of the whole population (n = 3). F, differentiated PC12 cells lines were transduced with a lentivector expressing a pathogenic polyglutamine tract from exon 1 of huntingtin fused to GFP (Htt-115Q-GFP) and then induced with doxycycline. The images show microscopic fields containing ∼50 cells, whereof a proportion is highly fluorescent due to inclusion body formation. Bar, 100 μm. G, bar graph shows the number of PC12 cells per microscopic field containing Htt-115Q-GFP inclusion bodies after 4 days, normalized to PC12 cells co-expressing β-synuclein (β-SNC). The data represent mean ± S.E. from three independent experiments.
FIGURE 2.
FIGURE 2.
Expression of p25α promotes formation of α-synuclein-positive inclusions and alters the levels of proteins involved in autophagy. A–D, indirect immunofluorescence of α-synuclein (α-SNC) (BD Transduction Laboratories) and p25α in NGF-differentiated PC12 cells expressing the following: A, α-SNCA30P; B, p25α; or C and D, co-expressing α-SNCA30P and p25α. Note the pronounced co-localization between α-SNC and p25α (arrows) in both small vesicular profiles (C) and large inclusions (D). Bars, 10 μm. E, PC12 cell populations, as indicated, were differentiated as above, and cell lysates were processed for Western blotting with anti-LC3B antibodies. F, bar graph shows integrated optical density (IOD) ratio between Western blot bands of LC3B-II and LC3B-I obtained from seven independent experiments. Error bars, S.E. G, representative Western blot of all-trans-retinoic acid-differentiated SH-SY5Y cells expressing α-SNCA30P or α-SNCA30P/p25α using anti-LC3B antibodies. H, bar graph shows integrated optical density ratio between Western blot bands of LC3B-II and LC3B-I obtained from three independent experiments. Error bars, S.E. I–N, PC12 cells expressing α-SNCA30P/p25α were fixed and processed for EM. Shown are micrographs of Epon-embedded sections. I, area of the cell with many nascent autophagosomes (black open arrows) characterized by two outer membranes and a luminal content with an appearance very similar to cytosol. M, mitochondria. Bar, 500 nm. J–L, examples of autophagosomes containing different kinds of cargo, including cytosol with endosomes (J), several dense-core vesicles contained in an amphisome located in a dendrite (K), and mitochondria (L) as revealed by this cryo-EM section. Bars, J–L, 250 nm. M, area with many autophagosome intermediates. Amphisomes, which have recently fused with late endosomes (white filled arrows), are characterized by an outer membrane enclosing an autophagosomal body with limiting membrane in addition to material derived from fusion with endosomes (typically exosomes). In addition, many electron dense, multilamellar bodies containing whorls of lipid were observed, often in addition to identifiable autophagosomal material (white open arrows). A single nascent autophagosome is present (black open arrow) close to the Golgi apparatus (G), nucleus (N), and the extracellular space (Ex). Bar, 500 nm. Inset, N shows a fusion event between a late endosome and an autophagosome. Bar, 100 nm. O, bar graph shows mean ± S.E. of the number of autophagosomes, amphisomes, and lamellar bodies in PC12 cells expressing either the doxycycline-binding reverse tetracycline-inducible transactivator (rtTA) protein alone (control) or together with α-SNCA30P or α-SNCA30P/p25α. From three independent EM experiments at least 10 cell profiles of each cell population were counted.
FIGURE 3.
FIGURE 3.
Autophagy markers LC3B and p62/SQSTM1 co-localize with α-synuclein. Indirect immunofluorescence of PC12 cells expressing α-synucleinA30P alone (α-SNCA30P) (A) or together with p25α (B and C) to visualize α-SNC (mAb LB509) distribution in relation to LC3B (A and B) or p62/SQSTM1 (C). Co-localization between α-SNC and the respective markers are indicated with arrows. Bars, A–C, 10 μm in the left panels and 5 μm in close-ups. PC12-α-SNCA30P (D–F) or PC12-α-SNCA30P/p25α (G–I) cells expressing mCherry-eGFP-LC3B were fixed and processed for cryo-immunogold labeling with mouse monoclonal anti-α-SNC (mAb LB509) antibodies and rabbit polyclonal anti-GFP antibodies, followed by secondary 14- or 7-nm gold-conjugated anti-mouse or anti-rabbit antibodies, respectively. E, micrograph shows several autophagosomes containing only labeling for eGFP-LC3B (black open arrows) and a single autophagosome containing both α-SNC and eGFP-LC3B (black filled arrow), which is also true of an electron dense autolysosome (open white arrow). The closed white arrow points to a cytosolic inclusion staining for both α-SNC and eGFP-LC3B. D, autolysosome with both labels is also shown at higher magnification. F, nascent autophagosome with both labels (black open arrow) and a vacuole/autophagosome containing only aggregated label for α-SNC (black filled arrow). In PC12 cells co-expressing α-SNCA30P and p25α (G–I), the number of autophagosomes was increased and recently formed autophagosomes (open black arrows) and amphisomes (white open arrows), including lamellar bodies (white, open arrow in G) and electron dense late autophagosomal elements (white, open arrows in H) contained label for both α-SNC and eGFP-LC3B. White closed arrow in G points to a late endosome devoid of immunoreactivity for either α-SNC or eGFP-LC3B, and the small white arrow in H points to extracellular α-SNC immunoreactivity associated with microvilli (MV) on the cell surface (white arrowheads). I, electron dense late autophagosomal element from H shown at higher magnification. M, mitochondria. Bars, D–H, 500 nm.
FIGURE 4.
FIGURE 4.
TPPP/p25α-induced autophagy is selective and also affects endogenous rat α-synuclein. A and B, PC12 α-synucleinA30P/p25α (α-SNCA30P/p25α) cells were transduced with lentivector pHR-cPPT.CMV.W-Htt-115Q-GFP, and after 2 days α-SNC and p25α expression was induced with doxycycline for a further 2 days. Cells were then fixed and processed for indirect immunofluorescence to visualize the following: A, Htt-115Q-GFP (blue), LC3B (red), and α-SNC (green; BD Transduction Laboratories), or B, Htt-115Q-GFP (blue), p62/SQSTM1 (red), and α-SNC (green; BD Transduction Laboratories). The box in A is shown at higher magnification to the right. Note that α-SNC preferentially co-localizes with LC3B, whereas Htt-115Q-GFP co-localizes with p62/SQSTM1. Bars, 10 μm and in right panels 2 μm. C, NGF-differentiated PC12 cells expressing either β-synuclein (β-SNC) as control or p25α were analyzed by indirect immunofluorescence to localize polyubiquitin, endogenous α-SNC (Abcam mAb EP1646Y), and p25α as indicated. D, PC12 cells expressing p25α and stained as above at higher magnification. Arrows indicate co-localization of α-SNC with ubiquitin and p25α. E, control (β-SNC) or p25α-expressing PC12 cells were processed for indirect immunofluorescence with rat anti-p25α mAb, mouse anti-α-SNC mAb LB509, and rabbit polyclonal antibodies against KAI1 and MPR. Arrows indicate vesicular structures with co-localization of α-SNC and KAI1/MPR, which to a certain extent also co-localize with p25α. Bars, C–E, 10 μm.
FIGURE 5.
FIGURE 5.
Expression of p25α prevents α-synuclein in reaching lysosomes. A–C, indirect immunofluorescence of leupeptin/pepstatin A-treated PC12 cells expressing α-synucleinA30P (α-SNCA30P) alone (A) or together with p25α (B and C), showing the distribution of α-SNCA30P (Abcam LB509) and the lysosomal marker LAMP1. Arrows in A indicates co-localization between the antigens, and arrows in B (red and green) and C (white) indicate that, although closely apposed, α-SNC immunoreactivity is distinct from that of LAMP1. Bars, A–C, 10 μm in the left panels and 5 μm in close ups. D, homogenates from PC12 cells expressing α-SNCA30P or α-SNCA30P/p25α were fractionated on a 15–45% sucrose gradient and aliquots of collected fractions analyzed by Western blotting of α-SNC (BD Transduction Laboratories) and LC3B. The blots are representative of two independent experiments. Note that p25α decreases the amount of α-SNC present in heavy fractions 1–3, which also contains exclusively autophagosome-associated LC3B-II. E, flow cytometric analysis of PC12 cells incubated with DQ-BSA for 6.5 h with or without either bafilomycin A1 (100 nm) or leupeptin (50 μg/ml)/pepstatin A (67 μg/ml) treatment. DQ-BSA fluorescence intensity was normalized to β-synuclein (β-SNC)-expressing PC12 cells, and the bar graph shows mean ± S.E. of relative fluorescence units (RFLU) (n = 3). * denotes a statistic significant decrease in relative fluorescence units for untreated cell lines when compared with untreated β-SNC-expressing cells; # denotes statistic significant decrease within the same cell line after chemical treatment; NS, nonsignificant.
FIGURE 6.
FIGURE 6.
Expression of p25α impairs the autophagosomal flux. A–E, confocal microscopy images of live PC12 cells co-expressing mCherry-eGFP-LC3B with either β-synuclein (β-SNC) (A), α-SNCA30P (B), α-SNCA30P/p25α (C and D), or β-SNC-expressing PC12 (E) cells treated with 20 nm bafilomycin A1 (Baf A1) for 6 h. Bars, 10 μm. F, bar graph shows absolute mean ± S.E. of mCherry (red) and eGFP (green) fluorescent structures per cell profile of three independent experiments. In each experiment 25–30 cells from each cell line were analyzed. G, same data as F presented as the ratio between the absolute numbers of mCherry and eGFP fluorescent dots. H, mCherry- and eGFP-positive structures larger than 1 μm in diameter were quantified according to size (1–2 μm: gray; >2 μm: black). The bar graph shows the number of inclusions per cell and represents mean ± S.E. of three independent experiments.
FIGURE 7.
FIGURE 7.
TPPP/p25α induces α-synuclein secretion, which can be modified by regulators of the autophagosomal degradation pathway. A, PC12 cells expressing α-synucleinA30P alone (α-SNCA30P) or with p25α (α-SNCA30P/p25α) were predifferentiated with NGF for 2 days and transgene expression induced for additionally 2 days. Doxycycline was then withdrawn, and the cells chased for 6 days with or without leupeptin (50 μg/ml) and pepstatin A (67 μg/ml). Representative Western blots using anti-α-SNC (BD Transduction Laboratories) shows clearance of α-SNC from cell lysates acquired from day 0, 2, 4, and 6 after doxycycline withdrawal. B, representative Western blots using anti-α-SNC (BD Transduction Laboratories), p62/SQSTM1 (SQSTM1), and β-actin of cell lysates and TCA-precipitated conditioned media obtained from PC12 cell lines expressing β-SNC, α-SNC wild type (α-SNCwt), or α-SNCA30P with or without p25α in the presence or absence of 3-MA (10 mm) (n = 3). C, representative Western blot of TCA-precipitated medium obtained from PC12 cells expressing α-SNCA30P alone or together with p25α using mouse anti-α-SNC (BD Transduction Laboratories). Notice the presence of both monomeric (17 kDa) and high molecular weight (High Mw) forms of secreted α-SNC. D, PC12 cells expressing β-SNC (as control) or p25α were treated or not with leupeptin/pepstatin A (50 and 67 μg/ml) for the last 24 h of culture before analysis of endogenous α-SNC in cell lysates and immunoprecipitates from conditioned medium (using BD Transduction Laboratories and LB509 mAbs) by Western blotting (using anti-α-SNC rabbit mAb EP1646Y) as indicated. Data are representative of three independent experiments. E, PC12 cells expressing α-SNCA30P or α-SNCA30P/p25α were treated with bafilomycin A1 (15 nm), leupeptin (50 μg/ml)/pepstatin A (67 μg/ml), trichostatin A (20 μm), rapamycin (0.5 μm), trehalose (100 mm), or left untreated (control) for 48 h concurrently with doxycycline induction before Western blot analysis of TCA-precipitated conditioned media and cell lysates using antibodies as indicated. F, bar graph shows fold increase in integrated optical density (IOD) of TCA Western blot bands of secreted α-SNC (BD Transduction Laboratories) obtained from B and E relative to untreated PC12-α-SNCA30P cells. Mean ± S.E. of three independent experiments are shown. G, TCA-precipitated conditioned medium or cell lysates from PC12-α-SNCA30P/p25α cells with or without stable co-expression of either control (pGIPZ) or ATG5 shRNA were analyzed by Western blotting using anti-α-SNC (BD Transduction Laboratories), ATG5, or LC3B antibodies as indicated. H, bar graph shows IOD of ATG5 western bands normalized to PC12 cells expressing control shRNA (pGIPZ) and represents mean ± S.E. of three independent experiments. I, bar graph shows IOD of α-SNC western bands (TCA samples) normalized to PC12 cells expressing control shRNA (pGIPZ) and represents mean ± S.E. of three independent experiments. J and K, PC12 cell populations as indicated were transduced with either Htt-18Q-GFP or Htt-115Q-GFP for 2 days before transgene induction for a further 2 days. Conditioned medium was then TCA-precipitated and analyzed by Western blotting with polyclonal rabbit anti-GFP antibodies. J, a ∼50-kDa band (upper arrow) immunoreactive with anti-GFP antibodies is seen exclusively in the conditioned medium from HTT-115Q-GFP-expressing cells but not from control HTT-18Q-GFP cells. K, similar secretion of HTT-115Q-GFP was observed in PC12 cells expressing β-SNC, p25α, or α-SNCA30P with or without p25α expression. The increased reactivity to monomer GFP to the right on the blot is caused by overflow from an adjacent (data not shown) cell lysate lane. Upper and lower arrows indicate HTT-115Q-GFP fusion protein and monomeric GFP, respectively.
FIGURE 8.
FIGURE 8.
mTOR-dependent and -independent autophagy enhancers rapamycin and trehalose, respectively, differentially affect the distribution and fluorescence properties of mCherry-eGFP-LC3B. A–D, PC12-α-synucleinA30P/p25α (α-SNCA30P/p25α) cells expressing mCherry-eGFP-LC3B were treated with 3-MA (10 mm), trehalose (100 mm), or rapamycin (0.5 μm) as indicated, for the last 48 h of culture, before live imaging with a Zeiss LSM510 confocal microscope. Note that 3-MA causes the diffusive cytoplasmic distribution of the mCherry-eGFP-LC3B construct, whereas trehalose induces the massive accumulation of large autophagosomal vacuoles that emit both mCherry and GFP fluorescence. In contrast, autophagy induced by rapamycin increased the proportion of autophagosomal vacuoles with predominant emission of only mCherry-fluorescence indicating correct acidification. Bars, 10 μm, enlarged images 2 μm. The images shown are representative of three independent experiments. E, PC12-α-SNC/p25α cells were treated with 0.5 or 1 μm rapamycin for different time intervals as indicated, and cell lysates were then analyzed by Western blotting for conversion of LC3B and levels of β-actin (loading control). Samples from the 48-h time point were run on separate gel due to lack of wells. The Western blot is representative of two independent experiments. F, integrated optical density (IOD) of LC3B-II bands from the experiment shown in E were normalized to levels of β-actin and plotted over time.
FIGURE 9.
FIGURE 9.
Secretion of α-synuclein is mediated by compartments with late endosomal/amphisomal characteristics. A, p25α-expressing PC12 cells were incubated with Alexa 568-conjugated annexin-V on ice before fixation and indirect immunofluorescence with antibodies against cleaved caspase-3. Note widespread annexin-V surface staining in the absence of caspase-3 immunoreactivity. Bar, 10 μm. B, PC12 cell lines labeled with Alexa 488-conjugated annexin-V on ice were analyzed by flow cytometry. The bar graph shows percentage annexin-V positive cells of the whole cell population and represents mean ± S.E. of three independent experiments. C, conditioned medium (CM) from PC12 cells expressing α-synucleinA30P-SNCA30P) with or without p25α was centrifuged at 100,000 × g to obtain a pellet (containing exosomes) and a supernatant (sup). Aliquots were then Western blotted with anti-α-SNC (BD Transduction Laboratories) or anti-flotillin-1 (exosome marker) antibodies. The exosome fraction was applied on the gel at 6-fold the relative load of supernatant and medium. The blot is representative of two independent experiments. D–F, PC12-α-SNCA30P cells were differentiated for 2 days and transduced at two different multiplicities of infection with lentivectors constitutively expressing FLAG-tagged Rab27A-Q78L (dominant positive) or Rab27A-T23N (dominant negative). Control wells received a GFP-expressing vector (pLenti). D, after 2 days of transgene induction cell lysates were prepared to show expression of Rab27A using anti-Rab27A mAb 4B12 (arrow points to transgene) or anti-FLAG antibodies. E, conditioned medium was TCA-precipitated and Western blotted with anti-α-SNC antibodies (BD Transduction Laboratories). F, bar graph shows mean ± S.E. of the integrated optical density (IOD) of α-SNC Western blot bands normalized to control-transduced cells (n = 3). * and # denotes a statistic significant increase or decrease, respectively, in α-SNC secretion when compared with control-transduced PC12 cells.
FIGURE 10.
FIGURE 10.
HDAC6 inhibition mimics p25α-induced secretion of α-synuclein and reduces the mobility of autophagosomes. A, representative Western blots showing cellular protein levels of acetylated tubulin (AcTub) and α-tubulin (α-Tub) obtained from PC12 cell populations as indicated. B, cell lysates and conditioned medium from PC12-α-synucleinA30P-SNCA30P) or PC12-α-SNCA30P/p25α cells, transduced 3 to 4 days prior to analysis with lentivectors expressing control (pLKO.1) or HDAC6-specific shRNA, were subjected to Western blotting using anti acetylated tubulin and α-tubulin antibodies (cell lysates) or anti-α-SNC antibodies (TCA-precipitated medium; BD Transduction Laboratories). Integrated optical density (IOD) of western bands for acetylated tubulin in cell lysates (C) and secreted α-SNC (BD Transduction Laboratories) in the TCA samples (D) is presented as fold increase relative to untreated control cells. Mean ± S.E. of three independent experiments are shown. * denotes a statistically significant increase in IOD within the cell line when co-expressing shRNA, and # denotes a statistic significant increase in IOD between the control cell lines not expressing shRNA. E, cell lysates of PC12 cell populations as indicated, expressing mCherry-eGFP-LC3B were Western blotted with anti-GFP antibodies to demonstrate an equal expression of the LC3B fusion protein. The 72-kDa protein bands correspond to the size of the mCherry-eGFP-LC3B tandem construct. F, flow cytometric analysis of untreated or trichostatin A-treated (10 μm) PC12 cell populations expressing mCherry-eGFP-LC3B. The bar graph shows mean ± S.E. of eGFP relative light fluorescent units normalized to control cells expressing β-SNC and represents data from three independent experiments. * denotes a statistic significant increase in mean eGFP fluorescence intensity between the cell lines when compared with β-SNC-expressing PC12 cells, and # denotes a statistic significant increase after trichostatin treatment. A.U., arbitrary units. G and H, live cell confocal microscopy images of PC12 cells expressing β-SNC or α-SNCA30P/p25α showing FRAP time series before and after photobleaching (t = 0 s and t = 50 s), and after a defined recovery period (t = 260 s). The cells were bleached in the encircled ROI shown in close-ups just before the t = 50-s time point. Bars, 10 μm. I, bar graph shows percentage of FRAP in PC12 cells as indicated, including PC12-α-SNCA30P cells treated with 20 μm trichostatin A or transduced with HDAC6 shRNA. Mean ± S.E. were obtained from three to five independent experiments. * denotes a statistically significant decrease in FRAP between the cell lines when compared with β-SNC-expressing PC12 cells, and # denotes a statistically significant decrease after trichostatin treatment or HDAC6 shRNA co-expression when compared with PC12 cells expressing α-SNCA30P.
FIGURE 11.
FIGURE 11.
Expression of Rab8 enhances α-synuclein secretion while lowering cell death. A, representative Western blots showing expression levels of HA-tagged Rab1A, Rab3A, or Rab8 and GFP-tagged Rab7 in PC12 cell lines expressing α-synucleinA30P-SNCA30P) or α-SNCA30P and p25α using anti-HA or -GFP antibodies. B, representative Western blots of TCA-precipitated media and cell lysates obtained from PC12 cells expressing α-SNCA30P or α-SNCA30P/p25α with or without co-expression of Rab proteins as indicated using antibodies against α-SNC (BD Transduction Laboratories) and LC3B. C, quantified integrated optical density (IOD) of α-SNC Western blot bands obtained in B are presented as fold increase relative to α-SNCA30P-expressing PC12 cells. Mean ± S.E. of five independent experiments are shown. * denotes a statistic significant increase in IOD when compared with control cells within the respective cell line. D–F, indirect immunofluorescence of PC12-α-SNCA30P/p25α cells co-expressing either HA-Rab1A (D) or HA-Rab8 (E and F). Rab8 was predominantly distributed toward the cell surface and caused a more peripheral distribution of α-SNCA30P (BD Transduction Laboratories) (E) and was co-localized partly with LC3B-positive autophagosomes/amphisomes (F). Bars, 10 μm. G, PC12-α-SNCA30P/p25α cells co-expressing HA-tagged Rab8 were fixed after 2 days of transgene induction and then processed for immunofluorescence to visualize KAI1 (green), α-SNC (red), or F-actin detected with Alexa 633-conjugated phalloidin (blue). Note that Rab8 expression results in accumulation of material on the cell surface, which is immunoreactive with anti-α-SNC and KAI1 antibodies (arrows). The figure is representative of three independent experiments. Bars, 10 μm. H, bar graph shows the percentage of caspase-3-positive PC12 cells of the whole population in indicated cell populations as determined by indirect immunofluorescence and counting. Data represent mean ± S.E. of four independent experiments. I, flow cytometric analysis of PC12 cell populations as indicated stained with PI to measure cell death. The bar graph shows the percentage of PI-positive cells of the total population and represents mean ± S.E. of four independent experiments. H and I, # denotes a statistically significant decrease when compared with control cells within the same cell line.
FIGURE 12.
FIGURE 12.
Proposed mechanism for p25α effects and exophagy of α-synuclein. The diagram illustrates how p25α may alter trafficking pathways (marked by numbers) and autophagosome dynamics. Expression of p25α causes aggregation and autophagosomal uptake of α-synuclein (α-SNC), involving QC autophagosome adaptors p62/SQSTM1 and possibly HDAC6 (1). The autophagosome (AU) then fuses (2) with a late endosome (LE) to generate an amphisome (AM), which can travel retrogradely (3) to fuse with a lysosome (Lyso) thereby forming an autolysosome, which degrades α-SNC. Retrograde transport involves HDAC6-mediated interactions between LC3B and the minus-end-directed dynein-dynactin motor complex, which may be inhibited by p25α. Fusion of amphisomes with lysosomes is promoted by HDAC6 deacetylase activity, which is inhibited by p25α. Under conditions where pathway 3 is blocked (compromised HDAC6 activity, lysosomal dysfunction, and/or altered ratio of minus- to plus-end-directed trafficking of amphisomes), anterograde transport of amphisomes toward the cell surface takes place (4), where a fraction of competent amphisomes can undergo exocytosis regulated by Rab27A (5), to release α-SNC in monomer and aggregated/modified forms to the extracellular environment. The extent to which autophagosomes may directly contribute to exocytosis is unclear (6).

Similar articles

Cited by

References

    1. Braak H., Del Tredici K., Rüb U., de Vos R. A., Jansen Steur E. N., Braak E. (2003) Staging of brain pathology related to sporadic Parkinson disease. Neurobiol. Aging 24, 197–211 - PubMed
    1. Luk K. C., Kehm V. M., Zhang B., O'Brien P., Trojanowski J. Q., Lee V. M. (2012) Intracerebral inoculation of pathological α-synuclein initiates a rapidly progressive neurodegenerative α-synucleinopathy in mice. J. Exp. Med. 209, 975–986 - PMC - PubMed
    1. Desplats P., Lee H. J., Bae E. J., Patrick C., Rockenstein E., Crews L., Spencer B., Masliah E., Lee S. J. (2009) Inclusion formation and neuronal cell death through neuron-to-neuron transmission of α-synuclein. Proc. Natl. Acad. Sci. U.S.A. 31, 13010–13015 - PMC - PubMed
    1. Lee H. J., Patel S., Lee S. J. (2005) Intravesicular localization and exocytosis of α-synuclein and its aggregates. J. Neurosci. 25, 6016–6024 - PMC - PubMed
    1. Volpicelli-Daley L. A., Luk K. C., Patel T. P., Tanik S. A., Riddle D. M., Stieber A., Meaney D. F., Trojanowski J. Q., Lee V. M. (2011) Exogenous α-synuclein fibrils induce Lewy body pathology leading to synaptic dysfunction and neuron death. Neuron 72, 57–71 - PMC - PubMed

Publication types

MeSH terms

LinkOut - more resources