. 2013 Jun;16(6):668-76.
doi: 10.1038/nn.3390. Epub 2013 Apr 28.

Oligodendrocyte progenitors balance growth with self-repulsion to achieve homeostasis in the adult brain

Affiliations

Oligodendrocyte progenitors balance growth with self-repulsion to achieve homeostasis in the adult brain

Ethan G Hughes et al. Nat Neurosci. 2013 Jun.

Abstract

The adult CNS contains an abundant population of oligodendrocyte precursor cells (NG2(+) cells) that generate oligodendrocytes and repair myelin, but how these ubiquitous progenitors maintain their density is unknown. We generated NG2-mEGFP mice and used in vivo two-photon imaging to study their dynamics in the adult brain. Time-lapse imaging revealed that NG2(+) cells in the cortex were highly dynamic; they surveyed their local environment with motile filopodia, extended growth cones and continuously migrated. They maintained unique territories though self-avoidance, and NG2(+) cell loss though death, differentiation or ablation triggered rapid migration and proliferation of adjacent cells to restore their density. NG2(+) cells recruited to sites of focal CNS injury were similarly replaced by a proliferative burst surrounding the injury site. Thus, homeostatic control of NG2(+) cell density through a balance of active growth and self-repulsion ensures that these progenitors are available to replace oligodendrocytes and participate in tissue repair.


Figures
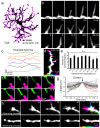
Fig. 1
Fig. 1
NG2+ cells extend dynamic filopodia and exhibit self-repulsion in the adult cortex. a, Maximum-intensity projection of an individual NG2+ cell during 1 hour time-lapse imaging. Stable regions are shown in black and dynamic regions are shown in magenta. b, Individual NG2+ cell filopodia extend (top), branch (middle), and alter their trajectory (bottom) in minutes. c, Plots showing the change in length over time of six NG2+ cell filopodia. d, Maximum-intensity projection of one NG2+ cell process, color-coded for time (intervals below = 4 min). Stable areas are represented in white. e, Graph showing the distribution of dynamic filopodia along NG2+ cell processes (n = 13 branches on 7 cells in 5 mice; P > 0.05 one-way ANOVA with Tukey post-hoc test). Error bars show s.e.m. f, In vivo time-lapse images of two pseudo-colored NG2+ cell processes, showing that contact leads to filopodial retraction. g, Plot of the change in length of NG2+ cell filopodia before and after contacting another NG2+ cell processes (n = 35 filopodia on 10 cells in 5 mice). Average change in length for all processes is shown in black. h, In vivo time-lapse imaging of advancing (top) and retracting (bottom) NG2+ cell processes. Montages at far right (0 – 60 min) are maximum-intensity projection images showing two NG2+ cell processes color-coded for time (intervals below = 3 min). Stable areas are represented in white. Note the presence of highly motile filopodia at the tip of the advancing process and the absence of filopodia on the retracting process.
Fig. 2
Fig. 2
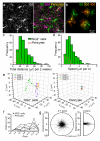
NG2+ cells continually change their position in the adult cortex. a, Image of NG2+ cells in one region of cortex on day 0 (left panel) and 32 days later (Right panel = montage of two time points). Stable pericytes are shown in yellow. b, Montage showing the change in morphology and position of three NG2+ cells over 40 days. c, Histogram showing the distances that NG2+ cells (green bars) and perivascular cells (red bars) moved over two weeks (318 NG2+ cells, 53 perivascular cells in 5 mice; P < 0.05 Mann-Whitney test). d, Histogram of the speed that NG2+ cells and pericytes moved over two weeks (318 NG2+ cells, 53 perivascular cells in 5 mice; P < 0.05 Mann-Whitney test). e, Three-dimensional graphs showing the movements of three NG2+ cells (left) and three perivascular cells (right) in the somatosensory cortex over a two week period. f, Graph showing the displacement of somata over time for five NG2+ cells and five pericytes. g, Vector plots of the direction and displacement of 905 NG2+ cell movements in the XY plane (left; P = 0.578 Moore-Rayleigh test) and the Z plane (right) for cells > 90 μm below the pia mater.
Fig. 3
Fig. 3
NG2+ cell density is maintained despite proliferation, differentiation, and death. a-c, Sequential images from in vivo time lapse recordings illustrating individual NG2+ cells undergoing division a, death b, and differentiation c. The image intensity at 9 days in c was increased 3x to illustrate the transition to an oligodendrocyte morphology. EGFP intensity decreased with differentiation due to down regulation of the NG2 promoter. d, Graph illustrating the proportion of NG2+ cells engaged in different behaviors on each day (1118 NG2+ cells in 5 mice). e, Combined plot showing the number of NG2+ cells undergoing proliferation, differentiation, and death (colored bars) and the total NG2+ cell density (blue line) in a 0.06 mm3 volume of adult somatosensory cortex over a 40 day period.
Fig. 4
Fig. 4
NG2+ cell density is maintained through local proliferation. a-b, Images from time-lapse images showing that NG2+ cell differentiation (green cell) a or death (red cell) b is associated with proliferation (yellow arrowheads) of a neighboring NG2+ cell (cyan). The intensity for the differentiating cell at day 4 in b has been increased 3x to highlight the morphological change. c, Graph showing the percent of differentiating, dying, and stable NG2+ cells that were associated with proliferation of a neighboring NG2+ cell (72 differentiating, 54 dying, 187 stable NG2+ cells in 5 mice; *P < 0.005 one-way ANOVA with Tukey post-hoc test). d, Graph showing the time-course of local proliferation relative to the onset of cell loss through death or differentiation (*P < 0.03, **P < 0.005, one-way ANOVA with Tukey post-hoc test). Error bars show s.e.m.
Fig. 5
Fig. 5
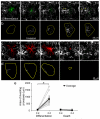
Neighboring NG2+ cell processes invade the territory of differentiating but not dying NG2+ cells. a, In vivo time-lapse images of an individual NG2+ cell (pseudo-colored green) that differentiated into an oligodendrocyte during the 8 day imaging period. Note that differentiation resulted in processes extension and proliferation (yellow arrowheads) of the neighboring NG2+ cell to the left of the differentiating cell. b, Montage showing the territory of the differentiating cell (yellow) overlaid with the processes of neighboring NG2+ cells (white) that entered the territory of the differentiating cell. Note that there was extensive invasion of cell territory very early in the differentiation process. c, In vivo time-lapse images of an individual NG2+ cell (pseudo-colored red) that died during the 4 day imaging period. d, Montage showing the territory of the dying cell (yellow) overlaid with the processes of neighboring NG2+ cells (white) that entered the territory of the dying cell. e, Graph showing the area of processes that invaded into the territory of differentiating or dying NG2+ cells. (10 differentiating, 10 dying NG2+ cells in 5 mice; *P < 0.0005 paired two-tailed Student’s t test). Error bars show s.e.m.
Fig. 6
Fig. 6
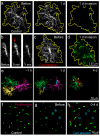
NG2+ cell ablation triggers territory invasion and division of a neighboring NG2+ cell. a, In vivo time-lapse images of an individual NG2+ cell over 1 day. The territory of the cell is outlined in yellow. Processes of neighboring NG2+ cells have been pseudo-colored green. Note the lack of territory invasion over 1 day (far right, Invasion). b, Single z-plane images of an individual NG2+ cell before and after brief exposure of the cell body to the focused laser beam to induce ablation. Red arrow highlights the increase in auto-fluorescence of the nucleus after illumination. c, Maximum intensity projection image of the NG2+ cell shown in f prior to ablation. The territory of the cell is outlined in yellow. d, Montage of the same volume of tissue in c one day following cell ablation. Processes of neighboring NG2+ cells have been pseudo-colored green. e, In vivo time-lapse images of three neighboring NG2+ cells (pseudo-colored green, yellow and magenta) from a thinned-skull preparation. Two NG2+ cells (shown in yellow and magenta) were removed by laser-mediated ablation on day 1. On day 4, a neighboring NG2+ cell (green) divided (yellow arrowheads). f, Map of the soma position of NG2+ cells over 4 days in control. Newly generated NG2+ cells are represented in red. g, Snapshot of NG2+ cells distribution before cell ablation. Cells to be targeted for ablation are circled in blue. h, Map of the soma position of NG2+ cells over 4 days following ablation of 4 NG2+ cells (shown in g). Newly generated NG2+ cells are represented in red.
Fig. 7
Fig. 7
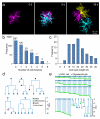
NG2+ cells directly differentiate into oligodendrocytes without asymmetric division. a, Sequential images from in vivo time-lapse recordings of one NG2+ cell that divided twice over 26 days. Newly generated cells are shown in cyan and yellow. b, Histogram of the distribution of proliferation frequencies of NG2+ cells in the somatosensory cortex (828 NG2+ cells in 3 mice imaged for 40 days). c, Histogram of NG2+ cell cycle length (97 NG2+ cell divisions in 3 mice). d, Lineage trees of highly proliferative NG2+ cells, illustrating the range of fates of sister cells. e, Lineage trees of NG2+ cells that differentiated into oligodendrocytes (107 NG2+ cells in 5 mice).
Fig. 8
Fig. 8
NG2+ cells surround areas of CNS damage and proliferate to maintain their density. a, Time-lapse imaging of NG2+ cell responses to focal laser injury (site of lesion shown in yellow). b, Graph showing accumulation of EGFP+ NG2+ cell processes within 75 μm of the lesion over time. Concentric circles on the 24hr time-point in a, highlight the areas measured to determine Response index. (n = 5 mice each condition; *P < 0.05 two-way ANOVA). c, Sequential images showing the response of a NG2+ cell to a focal laser injury (yellow spot). d, Quantification of extension/retraction of leading and trailing processes of NG2+ cells relative to the lesion (n = 20 branches on 10 cells in 4 mice; *P < 0.05, **P < 0.005, ***P < 0.0005 one-way ANOVA with Tukey post-hoc test). e, Montage of three images of one NG2+ cell collected on different days, showing migration of this cell towards the lesion (yellow). f, Vector plots showing the direction and displacement of NG2+ cells within 75 μm of the lesion site three weeks before and after lesion induction (73 cells in 4 mice; before, P = 0.073; after, P = 1.02 × 10⁻⁹ Moore-Rayleigh test). Line direction represents the angle of the displacement relative to the lesion site. Red line is the vector sum of all displacements. g, Maximum-intensity projection of 15 μm above and below a focal laser injury (yellow), two days after lesion induction. Two proliferating NG2+ cells (green arrowheads) adjacent to the lesion site are highlighted in orange. h, Combined plot showing the number of NG2+ cells undergoing proliferation and death/differentiation (combined) and the total NG2+ cell density (blue line) within 75 μm of the lesion. Focal laser injury was induced on day 0 (n = 4 mice). Error bars show s.e.m.

Similar articles

Cited by

References

    1. Biteau B, Hochmuth CE, Jasper H. Maintaining tissue homeostasis: dynamic control of somatic stem cell activity. Cell Stem Cell. 2011;9:402–411. - PMC - PubMed
    1. Simons BD, Clevers H. Strategies for homeostatic stem cell self-renewal in adult tissues. Cell. 2011;145:851–862. - PubMed
    1. Zhao C, Deng W, Gage FH. Mechanisms and functional implications of adult neurogenesis. Cell. 2008;132:645–660. - PubMed
    1. Franklin RJ, Gilson JM, Blakemore WF. Local recruitment of remyelinating cells in the repair of demyelination in the central nervous system. J Neurosci Res. 1997;50:337–344. - PubMed
    1. Ajami B, Bennett JL, Krieger C, Tetzlaff W, Rossi FM. Local self-renewal can sustain CNS microglia maintenance and function throughout adult life. Nat Neurosci. 2007;10:1538–1543. - PubMed

Publication types