

Misplaced helix slows down ultrafast pressure-jump protein folding
- PMID: 23620522
- PMCID: PMC3657825
- DOI: 10.1073/pnas.1219163110
Misplaced helix slows down ultrafast pressure-jump protein folding
Abstract
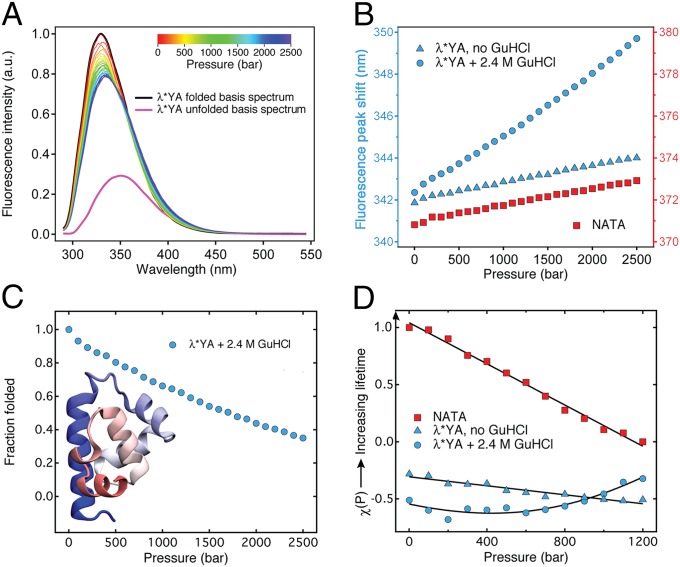
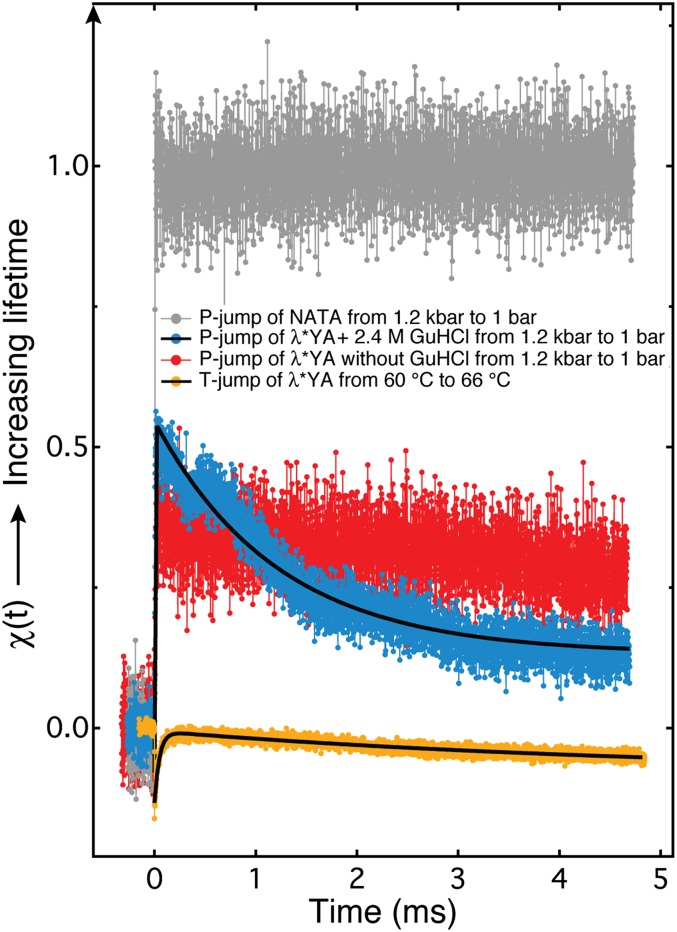
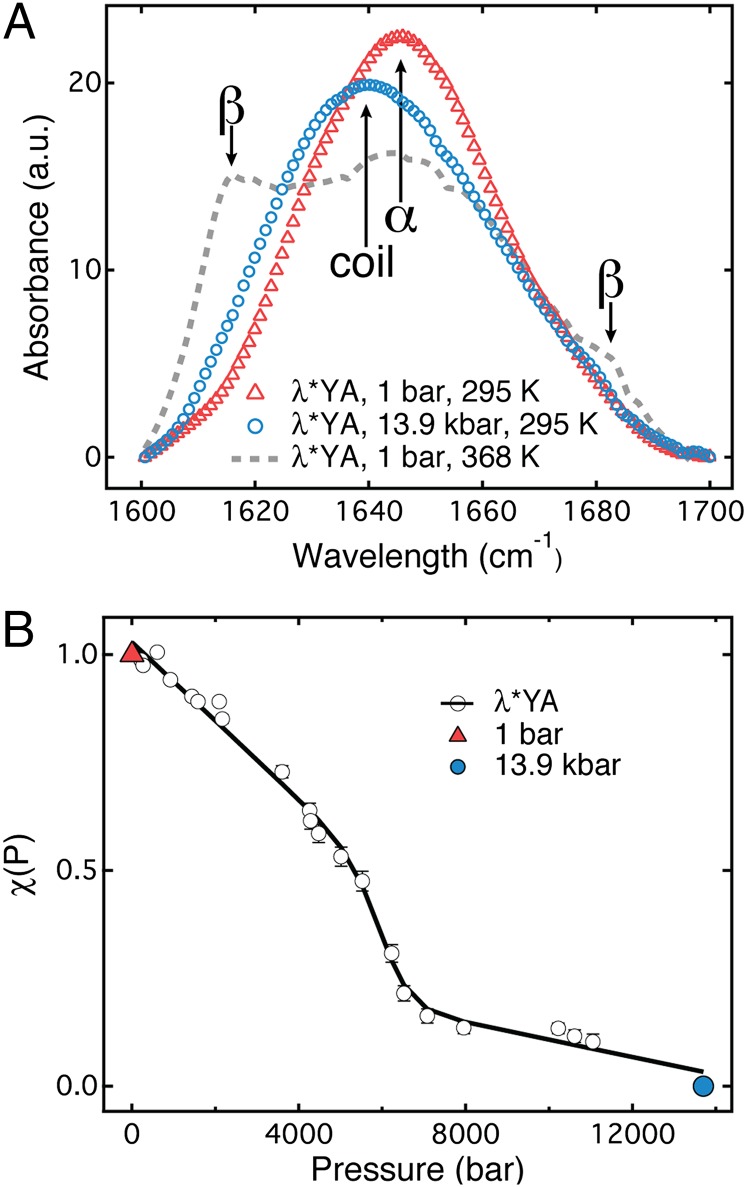
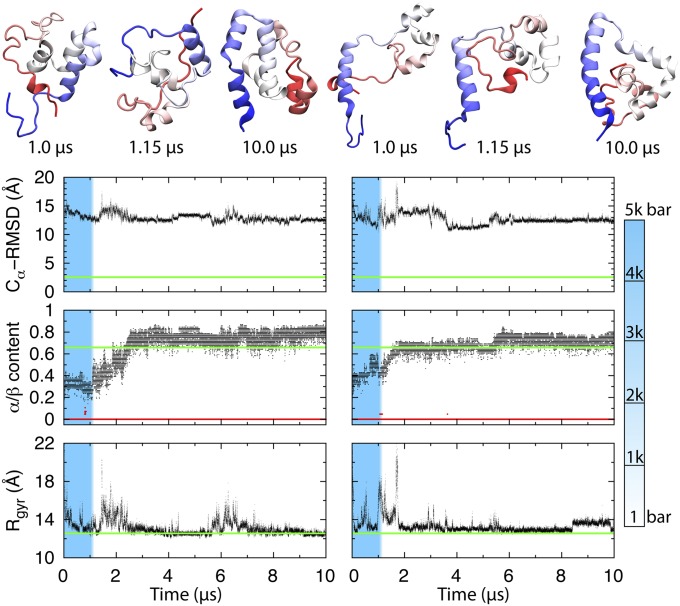
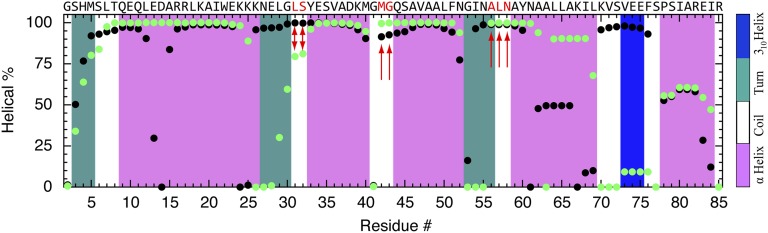
Using a newly developed microsecond pressure-jump apparatus, we monitor the refolding kinetics of the helix-stabilized five-helix bundle protein λ*YA, the Y22W/Q33Y/G46,48A mutant of λ-repressor fragment 6-85, from 3 μs to 5 ms after a 1,200-bar P-drop. In addition to a microsecond phase, we observe a slower 1.4-ms phase during refolding to the native state. Unlike temperature denaturation, pressure denaturation produces a highly reversible helix-coil-rich state. This difference highlights the importance of the denatured initial condition in folding experiments and leads us to assign a compact nonnative helical trap as the reason for slower P-jump-induced refolding. To complement the experiments, we performed over 50 μs of all-atom molecular dynamics P-drop refolding simulations with four different force fields. Two of the force fields yield compact nonnative states with misplaced α-helix content within a few microseconds of the P-drop. Our overall conclusion from experiment and simulation is that the pressure-denatured state of λ*YA contains mainly residual helix and little β-sheet; following a fast P-drop, at least some λ*YA forms misplaced helical structure within microseconds. We hypothesize that nonnative helix at helix-turn interfaces traps the protein in compact nonnative conformations. These traps delay the folding of at least some of the population for 1.4 ms en route to the native state. Based on molecular dynamics, we predict specific mutations at the helix-turn interfaces that should speed up refolding from the pressure-denatured state, if this hypothesis is correct.
Keywords: downhill folding; fluorescence lifetime; lambda repressor; molecular dynamics simulation; thermal denaturation.
Conflict of interest statement
The authors declare no conflict of interest.
Figures

Similar articles
-
Observation of complete pressure-jump protein refolding in molecular dynamics simulation and experiment.J Am Chem Soc. 2014 Mar 19;136(11):4265-72. doi: 10.1021/ja412639u. Epub 2014 Feb 3. J Am Chem Soc. 2014. PMID: 24437525 Free PMC article.
-
The fast and the slow: folding and trapping of λ6-85.J Am Chem Soc. 2011 Dec 7;133(48):19338-41. doi: 10.1021/ja209073z. Epub 2011 Nov 14. J Am Chem Soc. 2011. PMID: 22066714 Free PMC article.
-
Fast pressure-jump all-atom simulations and experiments reveal site-specific protein dehydration-folding dynamics.Proc Natl Acad Sci U S A. 2019 Mar 19;116(12):5356-5361. doi: 10.1073/pnas.1814927116. Epub 2019 Mar 5. Proc Natl Acad Sci U S A. 2019. PMID: 30837309 Free PMC article.
-
Reaching the protein folding speed limit with large, sub-microsecond pressure jumps.Nat Methods. 2009 Jul;6(7):515-9. doi: 10.1038/nmeth.1336. Epub 2009 May 31. Nat Methods. 2009. PMID: 19483692
-
Towards a complete description of the structural and dynamic properties of the denatured state of barnase and the role of residual structure in folding.J Mol Biol. 2000 Mar 10;296(5):1257-82. doi: 10.1006/jmbi.2000.3523. J Mol Biol. 2000. PMID: 10698632
Cited by
-
Water Determines the Structure and Dynamics of Proteins.Chem Rev. 2016 Jul 13;116(13):7673-97. doi: 10.1021/acs.chemrev.5b00664. Epub 2016 May 17. Chem Rev. 2016. PMID: 27186992 Free PMC article. Review.
-
Protein unfolding mechanisms and their effects on folding experiments.F1000Res. 2017 Sep 22;6:1723. doi: 10.12688/f1000research.12070.1. eCollection 2017. F1000Res. 2017. PMID: 29034084 Free PMC article. Review.
-
Cooperative folding near the downhill limit determined with amino acid resolution by hydrogen exchange.Proc Natl Acad Sci U S A. 2016 Apr 26;113(17):4747-52. doi: 10.1073/pnas.1522500113. Epub 2016 Apr 13. Proc Natl Acad Sci U S A. 2016. PMID: 27078098 Free PMC article.
-
Advances in turbulent mixing techniques to study microsecond protein folding reactions.Biopolymers. 2013 Nov;99(11):888-96. doi: 10.1002/bip.22355. Biopolymers. 2013. PMID: 23868289 Free PMC article.
-
Dodine as a protein denaturant: the best of two worlds?J Phys Chem B. 2013 Oct 24;117(42):13090-7. doi: 10.1021/jp4028113. Epub 2013 Aug 16. J Phys Chem B. 2013. PMID: 23906507 Free PMC article.
References
-
- Sarupria S, Ghosh T, García AE, Garde S. Studying pressure denaturation of a protein by molecular dynamics simulations. Proteins. 2010;78(7):1641–1651. - PubMed
-
- Callender R, Dyer RB. Probing protein dynamics using temperature jump relaxation spectroscopy. Curr Opin Struct Biol. 2002;12(5):628–633. - PubMed
-
- Clegg RM, Elson EL, Maxfield BW. New technique for optical observation of the kinetics of chemical reactions perturbed by small pressure changes. Biopolymers. 1975;14(4):883–887.
-
- Schiewek M, Krumova M, Hempel G, Blume A. Pressure jump relaxation setup with IR detection and millisecond time resolution. Rev Sci Instrum. 2007;78(4):045101. - PubMed
-
- Dumont C, Emilsson T, Gruebele M. Reaching the protein folding speed limit with large, sub-microsecond pressure jumps. Nat Methods. 2009;6(7):515–519. - PubMed
Publication types
MeSH terms
Substances
Grants and funding
LinkOut - more resources
Full Text Sources
Other Literature Sources
Research Materials
