Integrative genomic characterization of oral squamous cell carcinoma identifies frequent somatic drivers
- PMID: 23619168
- PMCID: PMC3858325
- DOI: 10.1158/2159-8290.CD-12-0537
Integrative genomic characterization of oral squamous cell carcinoma identifies frequent somatic drivers
Abstract
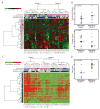
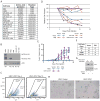
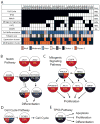
The survival of patients with oral squamous cell carcinoma (OSCC) has not changed significantly in several decades, leading clinicians and investigators to search for promising molecular targets. To this end, we conducted comprehensive genomic analysis of gene expression, copy number, methylation, and point mutations in OSCC. Integrated analysis revealed more somatic events than previously reported, identifying four major driver pathways (mitogenic signaling, Notch, cell cycle, and TP53) and two additional key genes (FAT1, CASP8). The Notch pathway was defective in 66% of patients, and in follow-up studies of mechanism, functional NOTCH1 signaling inhibited proliferation of OSCC cell lines. Frequent mutation of caspase-8 (CASP8) defines a new molecular subtype of OSCC with few copy number changes. Although genomic alterations are dominated by loss of tumor suppressor genes, 80% of patients harbored at least one genomic alteration in a targetable gene, suggesting that novel approaches to treatment may be possible for this debilitating subset of head and neck cancers.
Conflict of interest statement
Figures


Similar articles
-
Integrative genomic and functional analysis of human oral squamous cell carcinoma cell lines reveals synergistic effects of FAT1 and CASP8 inactivation.Cancer Lett. 2016 Dec 1;383(1):106-114. doi: 10.1016/j.canlet.2016.09.014. Epub 2016 Sep 28. Cancer Lett. 2016. PMID: 27693639 Free PMC article.
-
Multi-regional genomic and transcriptomic characterization of a melanoma-associated oral cavity cancer provide evidence for CASP8 alteration-mediated field cancerization.Hum Genomics. 2024 Sep 7;18(1):96. doi: 10.1186/s40246-024-00668-8. Hum Genomics. 2024. PMID: 39244622 Free PMC article.
-
Genetically-defined novel oral squamous cell carcinoma cell lines for the development of molecular therapies.Oncotarget. 2016 May 10;7(19):27802-18. doi: 10.18632/oncotarget.8533. Oncotarget. 2016. PMID: 27050151 Free PMC article.
-
Translational genomics and recent advances in oral squamous cell carcinoma.Semin Cancer Biol. 2020 Apr;61:71-83. doi: 10.1016/j.semcancer.2019.09.011. Epub 2019 Sep 19. Semin Cancer Biol. 2020. PMID: 31542510 Review.
-
Notch Signalling: A Potential Therapeutic Pathway in Oral Squamous Cell Carcinoma.Endocr Metab Immune Disord Drug Targets. 2021;21(12):2159-2168. doi: 10.2174/1871530321666210421125231. Endocr Metab Immune Disord Drug Targets. 2021. PMID: 33882814 Review.
Cited by
-
Genome-wide CRISPR screens of oral squamous cell carcinoma reveal fitness genes in the Hippo pathway.Elife. 2020 Sep 29;9:e57761. doi: 10.7554/eLife.57761. Elife. 2020. PMID: 32990596 Free PMC article.
-
Immunohistochemical Expression of Five Protein Combinations Revealed as Prognostic Markers in Asian Oral Cancer.Front Genet. 2021 Apr 15;12:643461. doi: 10.3389/fgene.2021.643461. eCollection 2021. Front Genet. 2021. PMID: 33936170 Free PMC article.
-
Mutation Analysis of Second Primary Tumors in Oral Cancer in Taiwanese Patients through Next-Generation Sequencing.Diagnostics (Basel). 2022 Apr 11;12(4):951. doi: 10.3390/diagnostics12040951. Diagnostics (Basel). 2022. PMID: 35453999 Free PMC article.
-
Epigenomic dysregulation-mediated alterations of key biological pathways and tumor immune evasion are hallmarks of gingivo-buccal oral cancer.Clin Epigenetics. 2019 Dec 3;11(1):178. doi: 10.1186/s13148-019-0782-2. Clin Epigenetics. 2019. PMID: 31796082 Free PMC article.
-
Mutational signatures and mutagenic impacts associated with betel quid chewing in oral squamous cell carcinoma.Hum Genet. 2019 Dec;138(11-12):1379-1389. doi: 10.1007/s00439-019-02083-9. Epub 2019 Nov 2. Hum Genet. 2019. PMID: 31679052
References
-
- Leemans CR, Braakhuis BJ, Brakenhoff RH. The molecular biology of head and neck cancer. Nat Rev Cancer. 2011;11:9–22. - PubMed
-
- Weng AP, Ferrando AA, Lee W, Morris JPt, Silverman LB, Sanchez-Irizarry C, et al. Activating mutations of NOTCH1 in human T cell acute lymphoblastic leukemia. Science. 2004;306:269–71. - PubMed
Publication types
MeSH terms
Substances
Grants and funding
LinkOut - more resources
Full Text Sources
Other Literature Sources
Medical
Molecular Biology Databases
Research Materials
Miscellaneous

