. 2013 Apr 16;8(4):e62185.
doi: 10.1371/journal.pone.0062185. Print 2013.

Adenosinergic depression of glutamatergic transmission in the entorhinal cortex of juvenile rats via reduction of glutamate release probability and the number of releasable vesicles

Affiliations

Adenosinergic depression of glutamatergic transmission in the entorhinal cortex of juvenile rats via reduction of glutamate release probability and the number of releasable vesicles

Shouping Wang et al. PLoS One. .

Abstract

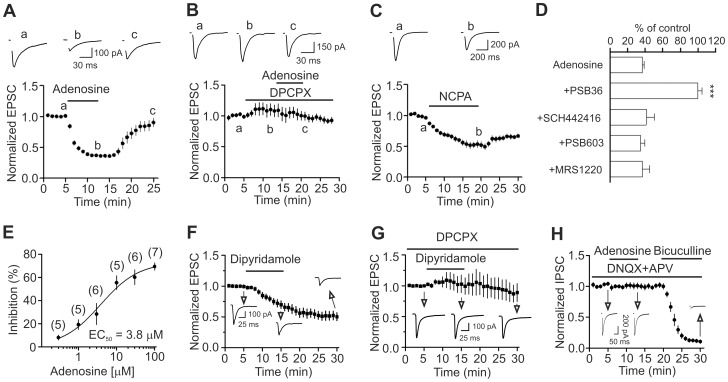
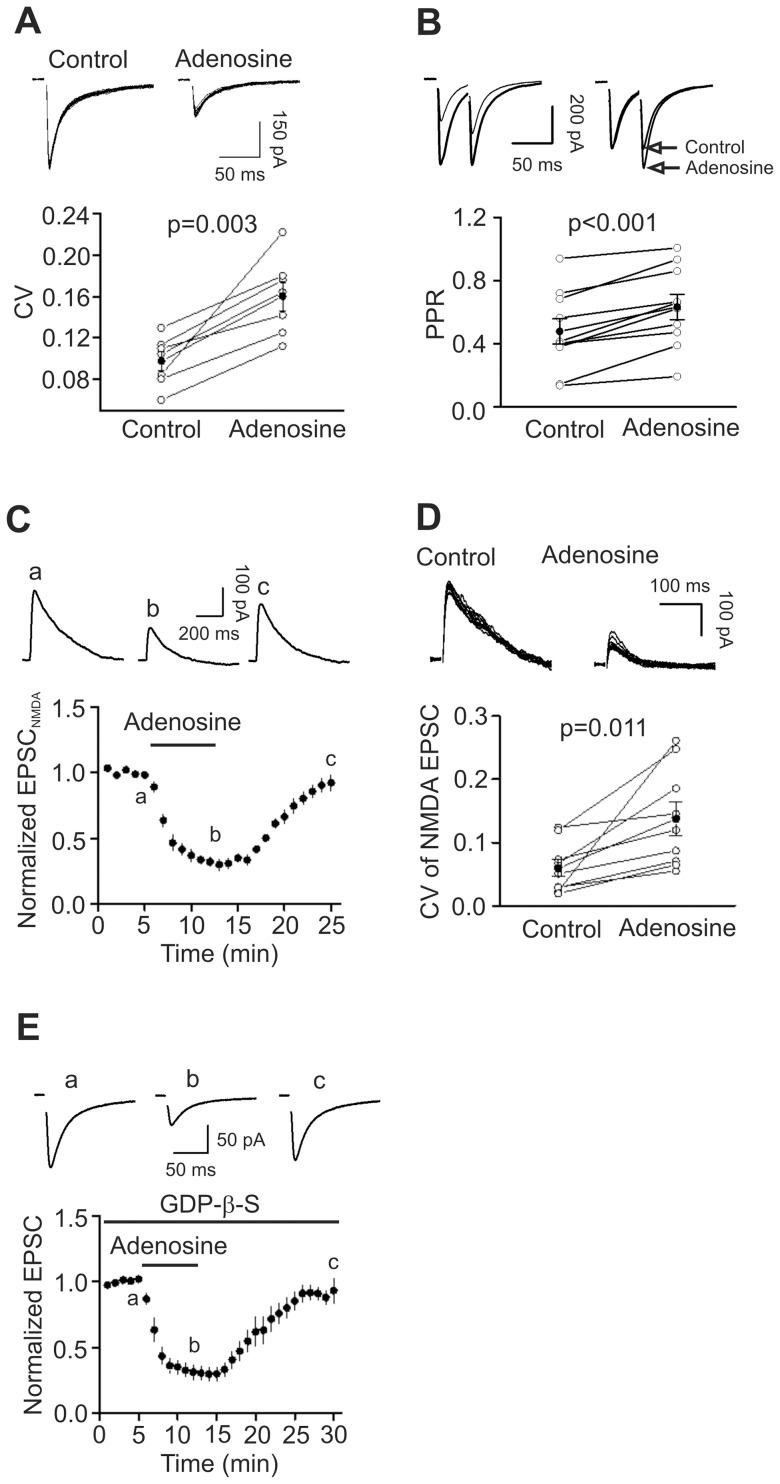
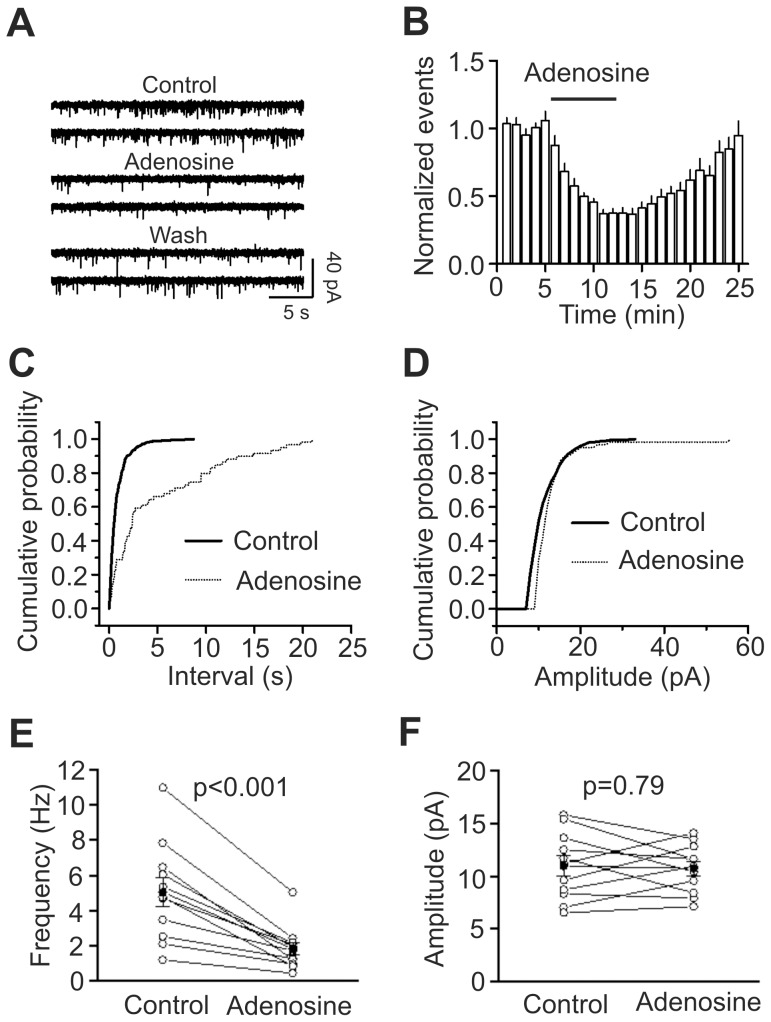
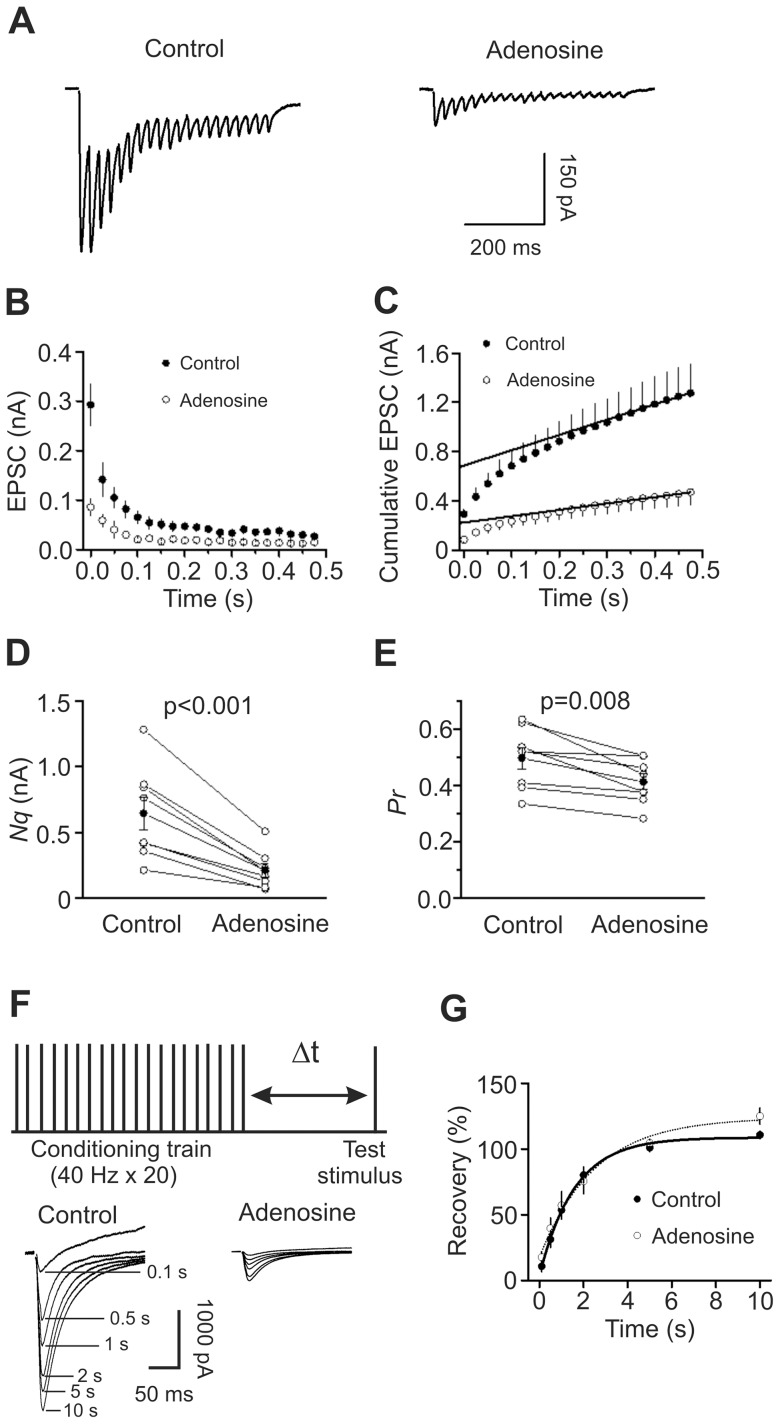
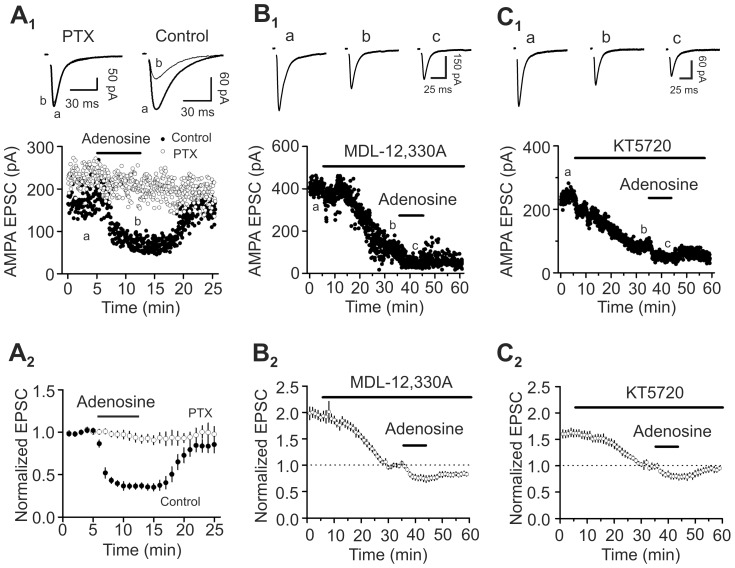
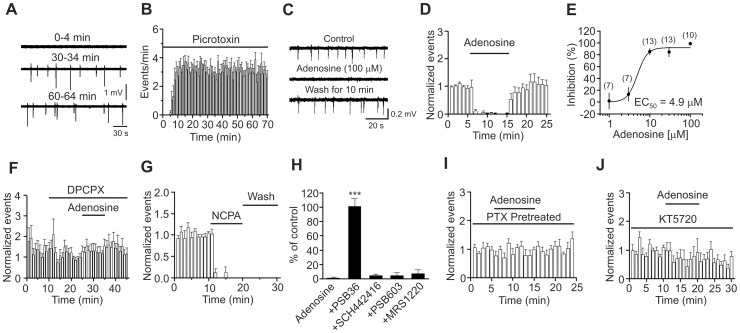
Adenosine is an inhibitory neuromodulator that exerts antiepileptic effects in the brain and the entorhinal cortex (EC) is an essential structure involved in temporal lobe epilepsy. Whereas microinjection of adenosine into the EC has been shown to exert powerful antiepileptic effects, the underlying cellular and molecular mechanisms in the EC have not been determined yet. We tested the hypothesis that adenosine-mediated modulation of synaptic transmission contributes to its antiepileptic effects in the EC. Our results demonstrate that adenosine reversibly inhibited glutamatergic transmission via activation of adenosine A1 receptors without effects on GABAergic transmission in layer III pyramidal neurons in the EC. Adenosine-induced depression of glutamatergic transmission was mediated by inhibiting presynaptic glutamate release probability and decreasing the number of readily releasable vesicles. Bath application of adenosine also reduced the frequency of the miniature EPSCs recorded in the presence of TTX suggesting that adenosine may interact with the exocytosis processes downstream of Ca(2+) influx. Both Gαi/o proteins and the protein kinase A pathway were required for adenosine-induced depression of glutamatergic transmission. We further showed that bath application of picrotoxin to the EC slices induced stable epileptiform activity and bath application of adenosine dose-dependently inhibited the epileptiform activity in this seizure model. Adenosine-mediated depression of epileptiform activity was mediated by activation of adenosine A1 receptors and required the functions of Gαi/o proteins and protein kinase A pathway. Our results suggest that the depression of glutamatergic transmission induced by adenosine contributes to its antiepileptic effects in the EC.


Conflict of interest statement

Competing Interests: The authors have declared that no competing interests exist.

Figures

Figure 1
Figure 1. Diagram showing the location and different layers of the EC.
Dotted line shows the location of cutting. Recordings were conducted form layer III pyramidal neurons with a stimulation electrode placed in ∼200 µm from the recorded neuron in layer III. DG, dentate gyrus; Subc, subiculum; PER, perirhinal; EC, entorhinal cortex.
Figure 2
Figure 2. Adenosine decreases the amplitude of evoked AMPA EPSCs via activation of A1 ARs without altering that of the evoked IPSCs recorded from layer III pyramidal neurons in the medial EC.
A, Bath application of adenosine (100 µM) reversibly inhibited the evoked AMPA EPSCs (n = 15, p<0.001 vs. baseline, paired t-test). Upper panel shows the average of 10 EPSCs recorded at different time points in the figure. Stimulation artifacts were blanked for clarity (same for the rest of the figures). B, Bath application of the A1 AR antagonist, DPCPX (1 µM) completely blocked adenosine-induced depression of AMPA EPSCs (n = 5, p = 0.8 vs. baseline, paired t-test). C, Bath application of the A1 AR agonist, NCPA (2 µM), inhibited AMPA EPSCs (n = 10, p<0.001 vs. baseline, paired t-test). D, Application of the antagonists for receptors other than A1 ARs failed to block adenosine-induced depression of AMPA EPSCs (One-way ANOVA followed by Dunnett test, *** p<0.001 vs. adenosine alone). E, Concentration-response curve of adenosine. The numbers in the parentheses are the numbers of cells used for each concentration. F, Bath application of dipyridamole (1 µM), an adenosine transporter inhibitor, significantly reduced the evoked EPSCs (n = 10, p<0.001, paired t-test) suggesting that endogenously released adenosine decreases AMPA EPSCs. G, Prior application of DPCPX, an A1 AR blocker, blocked dipyridamole-induced depression of AMPA EPSCs (n = 5, p = 0.85 vs. baseline, paired t-test) suggesting that the inhibitory effect of dipyridamole is mediated via activation of A1 ARs. H, Bath application of adenosine (100 µM) had no effects on the evoked IPSCs recorded at −70 mV from layer III pyramidal neurons (n = 7, p = 0.84 vs. baseline, paired t-test). The extracellular solution contained DNQX (20 µM) and dl-APV (100 µM). At the end of the experiments, application of bicuculline (20 µM) completely blocked IPSCs indicating that the recorded IPSCs were mediated by activation of GABAA receptors.
Figure 3
Figure 3. Adenosine inhibits AMPA EPSCs by decreasing presynaptic glutamate release.
A, Application of adenosine increased the CV of AMPA EPSCs (n = 7, p = 0.003, paired t-test). Upper panel shows 15 consecutive AMPA EPSCs recorded before and during the application of adenosine. Lower panel shows the calculated CVs from 7 cells (open circles) and their averages (solid circles). B, Adenosine increased PPR (n = 10, p<0.001, paired t-test). Upper left, AMPA EPSCs evoked by two stimulations at an interval of 50 ms before and during the application of adenosine. Upper right, EPSCs recorded before and during the application of adenosine were scaled to the first EPSC. Note that the second EPSC after the application of adenosine is larger than control. Bottom, PPRs recorded from 7 cells (open circles) and their averages (solid circles). C, Application of adenosine inhibited NMDA EPSCs (n = 9, p<0.001 vs. baseline, paired t-test). Upper panel shows the averaged NMDA EPSC of 5 EPSCs at different time points in the figure. D, Application of adenosine increased the CV of the NMDA EPSCs (n = 9, p = 0.011, paired t-test). Upper panel shows 10 successive NMDA EPSCs recorded before (left) and during (right) the application of adenosine. Lower panel shows the calculated CVs from 9 cells (open circles) and their averages (solid circles). E, Intracellular application of GDP-β-S via the recording pipettes did not significantly alter adenosine-induced depression of AMPA EPSCs (n = 6, p<0.001 vs. baseline, paired t-test).
Figure 4
Figure 4. Adenosine decreases mEPSC frequency with no effects on mEPSC amplitudes.
A, mEPSCs recorded from a layer III pyramidal neuron in the presence of TTX (1 µM) before, during and after application of adenosine (100 µM). B, Time course of the mEPSC frequency averaged from 11 cells. Numbers of mEPSCs at each min were normalized to that of mEPSCs in the 5 min prior to the application of adenosine (n = 11, p<0.001 vs. baseline, paired t-test). C, Cumulative frequency distribution from a layer III pyramidal neuron before (solid) and during (dotted) the application of adenosine. Note that adenosine increased the intervals of the mEPSC (decreased mEPSC frequency, p<0.001, Kolmogorov-Smirnov test). D, Cumulative amplitude distribution from the same cell before (solid) and during (dotted) the application of adenosine (p = 0.08, Kolmogorov-Smirnov test). E, Summarized data for adenosine-induced reduction of mEPSC frequency (n = 11, paired t-test). F, Adenosine failed to alter significantly mEPSC amplitudes (n = 11, paired t-test).
Figure 5
Figure 5. Adenosine decreases the number of releasable vesicles and release probability without changing the rate of recovery from vesicle depletion.
A, EPSC trains averaged from 10 traces evoked by 20 stimuli at 40 Hz before (left) and during (right) the application of adenosine. Stimulation artifacts were blanked for clarity. B, EPSC amplitudes averaged from 8 cells in response to 20 stimuli at 40 Hz before and during the application of adenosine. The amplitude of EPSC evoked by each stimulus was measured by resetting the base line each time at a point within 0.5 ms before the beginning of each stimulation artifact. C, Cumulative amplitude histogram of EPSCs. For each cell, the last 6 EPSC amplitudes were fit with a linear regression line and extrapolated to time 0 to estimate the readily releasable pool size (Nq). D, Adenosine decreases Nq (n = 8, paired t-test). E, Adenosine decreases release probability (Pr, n = 8, paired t-test). For each cell, Pr was calculated as the ratio of the first EPSC amplitude divided by its Nq obtained by linear fitting of the cumulative EPSC histogram. F, Upper: experimental protocol. A conditioning train (20 stimuli at 40 Hz) was followed by a test stimulus. The intervals between the end of the conditioning train and the beginning of the test stimulus were 0.1 s, 0.5 s, 1 s, 2 s, 5 s or 10 s. The interval between each sweep containing the conditioning train and the test stimulus was 30 s to allow the refilling of the synaptic vesicles. Lower: EPSCs evoked by the test pulse from the same synapse at different intervals were aligned and superimposed before (left) and during (right) application of adenosine. Stimulation artifacts were blanked and labels for the traces in the presence of adenosine were omitted for clarity. G, Time course of recovery from depletion before and during the application of adenosine expressed as percentage recovery = (Itest−Iss)/(I1st−Iss)×100, where Itest is the EPSC evoked by the test pulse, Iss is the steady-state current left after the conditioning train (the average of the last 5 EPSC evoked by the conditioning train), I1st is the EPSC evoked by the 1st stimulus of the conditioning train. Data before (thick line) and during (thin line) the application of adenosine from 6 cells were fit by a single exponential function.
Figure 6
Figure 6. Roles of AC-cAMP-PKA pathway in adenosine-induced depression of glutamate release.
A1–A2, Application of adenosine did not inhibit AMPA EPSCs in slices pretreated with PTX but still induced robust inhibition of AMPA EPSCs in slices undergone the same fashion of treatment without PTX. A1, AMPA EPSC amplitudes recorded every 3 s before, during and after the application of adenosine. Slices were pretreated with PTX in the extracellular solution bubbled with 95% O2 and 5% CO2 for ∼10 h (empty circles). For control (solid circles), slices underwent the similar treatment without PTX. Upper panel shows the average of 10 EPSCs at different time points in the figure. A2, Averaged data. B1–B2, Bath application of MDL-12,330A (50 µM) alone significantly reduced AMPA EPSCs and reduced adenosine-induced depression of AMPA EPSCs. B1, Raw data from one cell. B2, Averaged data from 5 cells. C1–C2, Bath application of KT5720 (1 µM) alone significantly reduced AMPA EPSCs and reduced adenosine-induced depression of AMPA EPSCs. C1, Raw data from one cell. C2, Data averaged from 5 cells.
Figure 7
Figure 7. Adenosine-induced depression of seizure activity is mediated by activation of A1 ARs and requires the functions of Gαi proteins and PKA.
A, Seizure events induced by bath application of picrotoxin at the saturated concentration (100 µM) in a rat slice at different times. An extracellular electrode containing ACSF was placed in layer III of the EC to record the seizure events. B, Time course of picrotoxin-induced seizure events (n = 7 slices). C, Seizure events recorded before, during and after the application of adenosine (100 µM). D, Summarized time course of adenosine-induced inhibition of seizure activity (n = 10 slices, p<0.001 vs. baseline, paired t-test). E, Concentration-response curve of adenosine-induced depression of seizure activity. Numbers in the parenthesis are the number of slices recorded from. F, Prior bath application of the A1 AR inhibitor, DPCPX, blocked adenosine-induced depression of seizure events (n = 12 slices, p = 0.89 vs. baseline, paired t-test). G, Bath application of the A1 AR agonist, NCPA, irreversibly suppressed the seizure events (n = 6 slices, p<0.001 vs. baseline, paired t-test). H, Application of antagonists to other ARs except A1 ARs did not block adenosine-induced depression of epileptiform activity (One-way ANOVA followed by Dunnett test, *** p<0.001 vs. adenosine alone). I, Bath application of adenosine failed to depress significantly picrotoxin-induced seizure events in slices pretreated with PTX (n = 8 slices, p = 0.45 vs. baseline, paired t-test). J, Pretreatment of slices with and continuous bath application of the membrane permeable PKA inhibitor, KT5720, blocked adenosine-induced depression of seizure events (n = 8 slices, p = 0.7 vs. baseline, paired t-test).

Similar articles

Cited by

References

    1. Witter MP, Groenewegen HJ, Lopes da Silva FH, Lohman AH (1989) Functional organization of the extrinsic and intrinsic circuitry of the parahippocampal region. Prog Neurobiol 33: 161–253. - PubMed
    1. Witter MP, Naber PA, van Haeften T, Machielsen WC, Rombouts SA, et al. (2000) Cortico-hippocampal communication by way of parallel parahippocampal-subicular pathways. Hippocampus 10: 398–410. - PubMed
    1. Burwell RD (2000) The parahippocampal region: corticocortical connectivity. Ann N Y Acad Sci 911: 25–42. - PubMed
    1. Canto CB, Wouterlood FG, Witter MP (2008) What does the anatomical organization of the entorhinal cortex tell us? Neural Plast 2008: 381243. - PMC - PubMed
    1. Steward O, Scoville SA (1976) Cells of origin of entorhinal cortical afferents to the hippocampus and fascia dentata of the rat. J Comp Neurol 169: 347–370. - PubMed

Publication types

LinkOut - more resources