. 2013 May 6;210(5):951-68.
doi: 10.1084/jem.20120950. Epub 2013 Apr 22.

In vivo NCL targeting affects breast cancer aggressiveness through miRNA regulation

Affiliations

In vivo NCL targeting affects breast cancer aggressiveness through miRNA regulation

Flavia Pichiorri et al. J Exp Med. .

Erratum in

  • Correction: In vivo NCL targeting affects breast cancer aggressiveness through miRNA regulation.
    Pichiorri F, Palmieri D, De Luca L, Consiglio J, You J, Rocci A, Talabere T, Piovan C, Lagana A, Cascione L, Guan J, Gasparini P, Balatti V, Nuovo G, Coppola V, Hofmeister CC, Marcucci G, Byrd JC, Volinia S, Shapiro CL, Freitas MA, Croce CM. Pichiorri F, et al. J Exp Med. 2017 May 1;214(5):1557. doi: 10.1084/jem.2012095001172017c. Epub 2017 Jan 19. J Exp Med. 2017. PMID: 28104811 Free PMC article. No abstract available.

Expression of concern in

Abstract

Numerous studies have described the altered expression and the causal role of microRNAs (miRNAs) in human cancer. However, to date, efforts to modulate miRNA levels for therapeutic purposes have been challenging to implement. Here we find that nucleolin (NCL), a major nucleolar protein, posttranscriptionally regulates the expression of a specific subset of miRNAs, including miR-21, miR-221, miR-222, and miR-103, that are causally involved in breast cancer initiation, progression, and drug resistance. We also show that NCL is commonly overexpressed in human breast tumors and that its expression correlates with that of NCL-dependent miRNAs. Finally, inhibition of NCL using guanosine-rich aptamers reduces the levels of NCL-dependent miRNAs and their target genes, thus reducing breast cancer cell aggressiveness both in vitro and in vivo. These findings illuminate a path to novel therapeutic approaches based on NCL-targeting aptamers for the modulation of miRNA expression in the treatment of breast cancer.


Figures

Figure 1.
Figure 1.
NCL modulates the biogenesis of a subset of miRNAs. (A) Northern blot analysis at 72 h of indicated miRNAs, after either control (si-Scr) transfection or NCL (si-NCL) knockdown in HeLa cells. (B) Mature miRNA expression levels in HeLa cells transfected with the indicated shRNAs were analyzed by qRT-PCR. (C) Mature and pri-miRNA expression levels in HeLa cells transfected with the indicated siRNAs were analyzed by qRT-PCR. (B and C) Values represent the mean ± SD from three independent sets of experiments performed in triplicate. *, P < 0.01. (D) qRT-PCR on HeLa cells after RIP performed using anti-NCL or normal control IgG followed by detection of the indicated pri-miRNAs. GAPDH mRNA was used as internal control. Values were normalized to levels of immunoprecipitated pri-miRNAs using normal control IgG. Immunoprecipitated pri-miRNA levels using normal control IgG were used as normalizer for qRT-PCR experiments. Reported data represent the mean ± SD from three independent sets of experiments performed in triplicate. *, P < 0.01. f.c., fold change. (E) Northern blot analysis of total RNA from HeLa cells cotransfected with pri–miR-21 expression vector (pMIRNA1-pri–miR-21) and with si-NCL, si-DROSHA, and si-Scr, as indicated. RNU6 levels are shown as a loading control. (F) Northern blot analysis of total RNA from HeLa cells cotransfected with pri–miR-221 (left) or pri–miR-155 (right) expression vectors (pMIRNA1-pri–miR-221 and pri–miR-155) and with si-DICER and si-NCL, as indicated. (G) Processing assay of 32P internally labeled pri–miR-21 incubated with HEK-293 total cell extracts in the presence or absence of 50 nM NCL-35S. (F and G) Images are representative of different experiments at least performed in triplicate.
Figure 2.
Figure 2.
NCL, through the regulation of a subset of miRNAs, affects specific changes in their target gene levels. (A) Luciferase assay using pGL3–miR-21–6X-BS (Sponge–miR-21) and pGL3–miR-103–4X-BS (Sponge–miR-103) reporter vectors after knockdown of the indicated genes in HeLa cells. pGL3–miR-30s–4X-BS (Sponge–miR-30a) was used as negative control. (B) Luciferase assay using pGL3-Sponge reporter vectors after knockdown of the indicated genes in HeLa cells and transfection with primary or mature miRNAs, as indicated. (A and B) All data are presented as mean ± SD of four independent experiments performed in triplicate. a.u., arbitrary units. (C) qRT-PCR analysis of the indicated miRNAs performed on MCF-7 cells after 72 h of transfection with NCL (si-NCL) or control (si-Scr) siRNA transfection. Values represent the mean ± SD from three independent sets of experiments. *, P < 0.01. (D) Relative quantification of DICER mRNA levels from HeLa cells transfected with scrambled siRNA (si-Ctrl) and si-NCL in the presence or absence of mature miR-103. Each data sample was normalized to the endogenous reference gene GAPDH by the 2−Δct method. (E) Luciferase assay on HeLa cells transfected with a reporter vector containing the 3′ UTR of DICER downstream the firefly luciferase gene along with the scrambled siRNA (si-Ctrl) and si-NCL in the presence or absence of mature miR-103. (D and E) Values represent the mean ± SD of three independent sets of experiments performed in triplicate. *, P < 0.01 compared with the si-Ctrl–transfected cells. (F and G) TIMP-3 (F) and FAS (G) protein levels in HeLa cells transfected with si-NCL or si-Ctrl with or without miR-221 or miR-21 rescue. β-ACTIN was used as loading control. Numbers below the blots indicate densitometric analysis showing TIMP-3/β-ACTIN and PTEN/ β-ACTIN ratios. (H) Expression of the indicated proteins by immunoblot analysis of HeLa cells transiently transfected with si-NCL or si-Scr in the presence or absence of miR-221/222. miR-26a was used as a PTEN-targeting, NCL-independent miRNA control. (F–H) Images are representative of at least three different experiments.
Figure 3.
Figure 3.
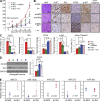
NCL, through the regulation of a subset of miRNAs, modulates cancer cell proliferation in vivo. (A) MDA-MB-231 cells were injected subcutaneously into the flanks of nude mice. 1 wk after injection, mice with comparable tumor sizes were selected (n = 8 for each group of treatment). Mice were treated with intratumoral injections of si-Scr, si-NCL + miRNAs, si-NCL, or si-NCL + Scr. The graph represents the mean tumor volume (mm3) at the indicated days during the experiment for the four groups. Values represent the mean ± SD. (B) Representative images of hematoxylin and eosin (H&E) and IHC staining for Ki-67, NCL, PTEN, pAKT, and active Caspase-3 in xenograft tumors for each treatment group (si-NCL ± Scr groups were unified). (C) Quantitative analysis of IHC stainings reported in B (n = 8). Reported data represent the mean ± SD from three independent slides stained in triplicate. (D) Representative images of immunoblot analysis of total protein extracts from xenograft tumors obtained from the four different groups of treatment using anti-NCL and anti-DICER antibodies (left). GAPDH was used as internal loading control, and densitometric analysis ± SD is also reported (n = 8; right). (A–D) All data reported are representative of three independent experiments. (E) Evaluation by qRT-PCR of mature miR-21, miR-103, miR-222, miR-221, and miR-30a expression levels in subcutaneous xenograft tumors from MDA-MB-231 cells after si-NCL or si-Scr treatment as described in A. Each data sample was normalized for the endogenous RNU48 by the 2−Δct method. Horizontal lines indicate the median.
Figure 4.
Figure 4.
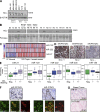
NCL and its target miRNAs are frequently overexpressed in breast cancer. (A) Immunoblot analysis of NCL in total protein extracts from different breast cancer cell lines. Numbers represent the densitometric analysis compared with β-ACTIN as internal loading control. (B) Immunoblot analysis of NCL in total protein extracts from human breast cancer specimens (T) and their normal counterpart (N) that were normalized by total loaded proteins detected by Ponceau staining. “B” indicates benign specimens. (C) Overview of 240 breast samples (57 normal and 183 TNBC) analyzed by NanoString miRNA technology distributed in function of miR-103, miR-222, and miR-21 expression (red, up-regulation; blue, down-regulation). (D) IHC of NCL in three samples of TNBC, which are representative of the different scores assigned to the NCL staining. Insets represent higher magnification (40×) of selected areas. (E) miR-21, miR-103, miR-222, miR-30a, and miR-155 relative expression in NCL-negative, NCL-positive “+”, and NCL-positive “++” samples were determined by NanoString technology. The relative expression values were used to design box and whisker plots. Dots in the boxes indicate outlier points. Kruskal-Wallis analysis assessed that the three miRNAs were differentially expressed among NCL-negative versus NCL-positive “+” samples and NCL-negative versus NCL-positive “++” samples of the Bartlett test (P < 0.001). (F) Representative IHC and miRNA ISH for NCL (red) and miR-221 (left) or miR-21 (right; green) in breast cancer samples. Colocalization (yellow) between NCL and miRNAs was evaluated using the Nuance system. (G) Representative miRNA ISH using a specific miR-21 probe or a nonspecific miRNA scramble (Scr) probe on breast cancer samples.
Figure 5.
Figure 5.
AS1411, through posttranscriptional regulation of NCL-targeted miRNAs, affects gene expression in breast cancer cells. (A) miRNA (left) and pri-miRNA (right) expression levels from MCF-7 cells treated with 10 µM AS1411 or its control drug (DCT) at different time points (24, 48, 72, and 96 h) were analyzed by qRT-PCR. For miRNA and pri-miRNA analysis, values were normalized to DCT at the same treatment time. The experiments were performed in triplicate and represent the mean ± SD. The red line represents a trend toward miRNA down-regulation upon AS1411 treatment. (B) Immunoblot analysis of either cytoplasmic (Cyt) or nuclear (N) extracts from MCF-7 cells using antibodies directed to the indicated proteins in the presence of control (DCT) or AS1411 treatment. LAMIN-B1, HSP90, and DROSHA were used as internal control for nucleocytoplasmic separation. Reported data represent three independent experiments. (C) Immunoprecipitation (IP) experiments on HeLa cells transfected with Flag-DGCR8 expression vector and treated with 10 µM AS1411 or control (DCT) for 24 h. Total cell lysates were immunoprecipitated using anti-Flag or control IgG antibodies and analyzed by immunoblot using the indicated antibodies. Inputs are also reported. (D) qRT-PCR analysis of the indicated genes on MCF-7 cells after AS1411 at different time points. *, P < 0.05; **, P < 0.01, relative to DCT-treated cells. Reported data represent the mean ± SD from three independent experiments in triplicate.
Figure 6.
Figure 6.
AS1411 affects NCL target miRNAs and cancer cell proliferation in vivo. (A) MDA-MB-231 cells were injected subcutaneously into the flanks of nude mice (n = 20), and at 1 wk after injection, mice with comparable tumor sizes (n = 16) were selected for treatment. Mice were treated with subcutaneous injection near the tumor area of 10 µM AS1411 or DCT (eight mice for each group of treatment). The graph represents the mean tumor volume (mm3) at the indicated days during the treatments for the two groups. Values represent the mean ± SD (n = 8). *, P < 0.01. (B and C) Immunoblot analysis showing DICER, NCL, VIMENTIN, total AKT, phosphorylated AKT (pAKT), PTEN, and BCL-2 protein expression levels from xenograft tumors of treated mice (AS1411 and DCT). GADPH and β-ACTIN were the internal loading control. (C) Densitometric analysis is reported ± SD. *, P < 0.01. (D) qRT-PCR analysis of mature miR-21, miR-221, miR-222, miR-103, miR-30a, and let-7a on extracted tumoral RNA from AS1411-treated samples. Values represent mean ± SD from three independent sets of experiments performed in triplicate. *, P < 0.05 in comparison with the DCT-treated cells. (A–D) All data reported are representative of at least three independent experiments. (E) Hematoxylin and eosin (H&E) and IHC analysis for Ki-67, vimentin, fibronectin, active Caspase-3, pAKT, and NCL in subcutaneous tumors. (F) Quantitative analysis of cytosolic NCL-positive staining from AS1411-treated mice (n = 8) compared with the control group (n = 8). All results are presented as mean ± SD. *, P < 0.01.
Figure 7.
Figure 7.
NCL targeting increases the sensitivity of breast cancer cells to Fulvestrant treatment. (A) MTS assay performed in MCF-7 cells treated with increasing concentration of Fulvestrant (50–150 nM), transfected or treated as listed. *, P < 0.01 relative to control-treated cells. (B) Growth curves obtained by MTS assay on MCF-7F cells, cultured in standard conditions (100 nM Fulvestrant) and treated or transfected as indicated. *, P < 0.01 relative to control-transfected or untreated cells. (C) Apoptosis associated with different concentrations (100 nM [top] and 150 nM [bottom]) of Fulvestrant in MCF-7F cells treated with DCT + si-Scr, DCT + si-NCL, AS1411+ si-Scr, and AS1411 + miRNAs was evaluated at 72 h by Annexin V staining. PI, propidium iodide. (A–C) All data are presented as mean ± SD of three independent experiments performed in triplicate.
Figure 8.
Figure 8.
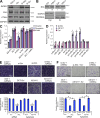
NCL impairment affects mobility and aggressiveness of breast cancer cells in vitro. (A and B) Immunoblot analysis using the indicated antibodies of total (A) and nuclear/cytoplasmic (B) extracts from MDA-MB-231 cells treated or transfected as indicated. Numbers under the blots indicate densitometric analysis, normalized for nuclear (DROSHA) or cytoplasmic (GAPDH) markers. (C) Vimentin, Fibronectin, and ICAM1 mRNA expression levels normalized to GADPH mRNA expression in MDA-MB-231 after 96 h of treatment and/or transfection with 10 µM of only aptamers (AS1411 or DCT), or aptamers + miRNAs, or RNA interference (si-NCL or si-Scr). Values represent the mean ± SD. *, P < 0.01. The experiments were performed in triplicate, in three independent experiments. (D) miRNA and pri-miRNA expression levels in MDA-MB-231 cells after different treatments as indicated. Controls (Ctrl) include DCT treatments and si-Scr transfection experiments. Values represent the mean ± SD. The experiments were repeated in triplicate. *, P < 0.01. All data reported are representative of at least three independent experiments. (E) Representative pictures of transwell migration assay (top) and absolute quantifications of cells migrated through the transwell measured by absorbance at 595 nm (bottom) performed on MDA-MB-231 cells transfected with si-Scr, si-Scr + miRNAs, si-NCL, and si-NCL + miRNAs or treated with 10 µM AS1411 or DCT with or without miRNAs. **, P < 0.001. (F) Matrigel invasion assay (top) and absolute quantification (bottom) performed on MDA-MB-436 cells treated as indicated. *, P < 0.01 relative to control-transfected or -treated cells. (E and F) Values represent mean ± SD from three independent sets of experiments performed in triplicate.
Figure 9.
Figure 9.
NCL-targeting compound interferes with aggressiveness of breast cancer cells in vivo. (A) 106 viable Luc+ MDA-MB-231 cells were injected into the fourth left-side mammary fat pad of female NOD-SCID mice (n = 34). 2 wk after orthotopic injections, mice with comparable visible tumors were treated with intraperitoneal injections (5 mg/kg) of AS1411 (n = 10) or control drug (DCT; n = 10) Monday through Friday for 3 wk. An additional 14 mice, treated with AS1411 as described above, were randomly divided into one group (n = 7) also treated Monday, Wednesday, and Friday for 3 wk with intratumoral injections of an miRNA pool including miR-103, miR-221, miR-222, and miR-21 and another group (n = 7) with a mixture of scrambled sequences. Once a week, the bioluminescence intensity of the injected mice was evaluated. Chart represents bioluminescence intensity (BLI) assessed every week in the four different groups of mice inoculated with 106 viable Luc+ MDA-MB-231 cells as indicated. 2 wk after cell inoculation, mice were treated with intraperitoneal injections of AS1411 (5 mg/kg) or DCT and, where indicated, with intratumoral injection of miRNAs/Scr. 4 wk after cell inoculation, the bioluminescence intensity signal in the primary tumors reached saturation in all experimental groups. (B) Representative bioluminescence imaging after 5 wk of combined treatments showing increase of bioluminescence intensity signal in the lungs of the mice treated with control aptamer (DCT) or with intratumoral miRNA injection upon AS1411 treatment. (C) Representative hematoxylin and eosin staining of lung lesions for each group of treatments. (D) Quantification of metastatic dissemination in the different group of treatments. Analyses were performed on histological sections of the lungs (four sections per lung) for each mouse stained with hematoxylin and eosin. Horizontal bars indicate the median. *, P < 0.01. (A–D) Data are representative of three independent experiments.

Similar articles

Cited by

References

    1. Abdelmohsen K., Tominaga K., Lee E.K., Srikantan S., Kang M.J., Kim M.M., Selimyan R., Martindale J.L., Yang X., Carrier F., et al. 2011. Enhanced translation by Nucleolin via G-rich elements in coding and non-coding regions of target mRNAs. Nucleic Acids Res. 39:8513–8530. 10.1093/nar/gkr488 - DOI - PMC - PubMed
    1. Akar U., Ozpolat B., Mehta K., Lopez-Berestein G., Zhang D., Ueno N.T., Hortobagyi G.N., Arun B. 2010. Targeting p70S6K prevented lung metastasis in a breast cancer xenograft model. Mol. Cancer Ther. 9:1180–1187. 10.1158/1535-7163.MCT-09-1025 - DOI - PubMed
    1. Bartel D.P. 2004. MicroRNAs: genomics, biogenesis, mechanism, and function. Cell. 116:281–297. 10.1016/S0092-8674(04)00045-5 - DOI - PubMed
    1. Bates P.J., Choi E.W., Nayak L.V. 2009a. G-rich oligonucleotides for cancer treatment. Methods Mol. Biol. 542:379–392. 10.1007/978-1-59745-561-9_21 - DOI - PubMed
    1. Bates P.J., Laber D.A., Miller D.M., Thomas S.D., Trent J.O. 2009b. Discovery and development of the G-rich oligonucleotide AS1411 as a novel treatment for cancer. Exp. Mol. Pathol. 86:151–164. 10.1016/j.yexmp.2009.01.004 - DOI - PMC - PubMed

Publication types

MeSH terms