. 2013 Apr 25;3(4):1164-74.
doi: 10.1016/j.celrep.2013.03.028. Epub 2013 Apr 18.

p21 both attenuates and drives senescence and aging in BubR1 progeroid mice

Affiliations

p21 both attenuates and drives senescence and aging in BubR1 progeroid mice

Darren J Baker et al. Cell Rep. .

Abstract

BubR1 insufficiency occurs with natural aging and induces progeroid phenotypes in both mice and children with mosaic variegated aneuploidy syndrome. In response to BubR1 insufficiency, skeletal muscle, fat, and lens tissue engage p19(Arf) to attenuate senescence and age-related deterioration. Here, we address how p19(Arf) exerts this caretaker role using BubR1 progeroid mice lacking p53 or its transcriptional target p21. We show that p53 delays functional decline of skeletal muscle and fat in a p21-dependent fashion by inhibiting p16(Ink4a)-mediated senescence of progenitor cells. Strikingly, p53 also attenuates the formation of cataractous lenses, but here its antiaging effect is p21 independent, as we found p21 to promote senescence of lens epithelial cells and cataract formation. Together, these results demonstrate that p53 counteracts tissue destruction in response to BubR1 insufficiency through diverse mechanisms and uncover a causal link between senescence of the progenitor cell compartment and age-related dysfunction.


Figures

Figure 1
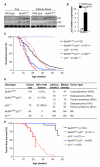
Figure 1. p53 Promotes Longevity in BubR1 Hypomorphic Mice through p21
(A) Western blots of eye and adipose tissue extracts from 2-month-old wild-type and BubR1H/H mice probed with p21 and p53 antibodies. Tubulin antibody served as a loading control. (B) qRT-PCR analysis of gastrocnemius muscles from 2-month-old mice analyzed for p21 expression. n = 5 mice of each genotype ±SD. (C) Kaplan-Meier overall survival curves of the indicated mice. Asterisks denote significance compared to BubR1H/H mice using log-rank tests. The maximum lifespan of BubR1H/H;p53−/− and BubR1H/H;p21−/− mice was significantly shortened compared to BubR1H/H mice (p = 0.0226 and p = 0.0034, respectively; two-sided Wang/Allison test referring to the proportion of mice alive at the 90th percentile survival point). (D) Tumor incidence and latency of mice indicated in (C). The time to osteosarcoma formation in BubR1H/H;p53−/− mice is significantly faster than in p53−/− mice. (E) Tumor-free survival curves of mice dying of cancer from (C). The BubR1H/H;p53−/− and p53−/− curves are both significantly different from BubR1H/H (log-rank test). No BubR1H/H;p21−/− or p21−/− mice died of tumors over the duration of the experiment. *p < 0.05; **p < 0.01; ***p < 0.001. See also Figures S1 and S2.
Figure 2
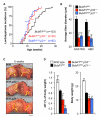
Figure 2. p53 Exerts its Antiaging Effects in Skeletal Muscle and Fat of BubR1H/H Mice through p21
(A) Incidence and latency of lordokyphosis in mice of the indicated genotypes. (B) Average muscle fiber size of gastrocnemius and abdominal muscles of 6-week-old mice. (C) Skinned 6-week-old BubR1H/H, BubR1H/H; p53−/−, and BubR1H/H;p21−/− mice. Note the profound lordokyphosis (black dotted line) and the markedly reduced adipose depots in the BubR1 progeroid mice lacking p53 or p21 (yellow arrows and hashed area). Scale bar represents 1 cm. (D) IAT (left) and body weight (right) are both reduced when p53 or p21 is lost from 6-week-old BubR1 hypomorphic mice. Data in (B) and (D) are mean ±SD (n = 5 mice per genotype). Asterisks denote significant changes from BubR1H/H values. **p < 0.01; ***p < 0.001. See also Figures S1 and S2.
Figure 3
Figure 3. p53-Mediated Induction of p21 Attenuates Senescence in BubR1H/H Skeletal Muscle and fat
(A) IAT of 2-month-old BubR1H/H, BubR1H/H;p53−/− and BubR1H/H;p21−/− mice stained for SA-β-gal activity. Scale bar, 5 mm. (B and C) qRT-PCR analysis of senescence marker expression in IAT (B) and gastrocnemius muscles (C) of 2-month-old BubR1H/H, BubR1H/H;p53−/− and BubR1H/H;p21−/− mice relative to wild-type mice. Values were normalized against wild-type values. (D) Cell proliferation rates in adipose tissue and skeletal muscle of 2-month-old male mice analyzed by in vivo BrdU incorporation as a measure for in vivo senescence. ABD, abdominal muscle; PARA, paraspinal muscle. Data in (B)–(D) are mean ±SD (n = 5 mice per genotype). Asterisks denote significant changes from BubR1H/H values. **p < 0.01. See also Figure S2.
Figure 4
Figure 4. Fat Progenitor Cells of BubR1 Hypomorphic Mice Are Senescence Prone
(A) SA-β-gal-positive cells from IAT accumulate in regions that track along blood vessels (red dotted line) and not in mature adipocytes of 5-month-old BubR1H/H mice. Scale bars represent 1 mm (left) and 100 μm (right). (B) Quantitation of ASCs/PACs in IAT of 2-month-old mice. Values are expressed as percent of Sca1+ cell numbers to account for differences in input material among genotypes. (C) qRT-PCR analysis for p16Ink4a expression in sorted adipose cells from 2-month-old wild-type and BubR1H/H mice. Values are normalized to wild-type endothelial cells (Endo). AC, adipocyte. (D) qRT-PCR analysis for senescence marker expression in ASCs/PACs from 2-month-old mice relative to wild-type cells. Data in (B)–(D) are mean ±SD (n = 3 mice per genotype). Asterisks denote significant changes from BubR1H/H values. *p < 0.05; **p < 0.01. See also Figure S3.
Figure 5
Figure 5. p21 Counteracts Progenitor Cell Senescence and Promotes Tissue Regeneration in BubR1H/H Skeletal Muscle
(A) qRT-PCR analysis for p16Ink4a expression in sorted cells from gastrocnemius muscle of 2-month-old wild-type and BubR1H/H mice. Values are normalized to wild-type Q-SCs. (B) qRT-PCR analysis for senescence marker expression in FAPs from 2-month-old gastrocnemius muscle. Expression is relative to wild-type cells. (C) Gastrocnemius muscles of 2-month-old animals on day 18 after cardiotoxin injection. Note the centralized nuclei present in the myofibers of wild-type and BubR1H/H muscle, indicative of restoration of muscle architecture. In contrast, BubR1H/H;p53−/− and BubR1H/H;p21−/− animals have been unable to restore normal structure and still exhibit a profound hypercellular response. Scale bar represents 100 μm. Data in (A) and (B) are mean ±SD (n = 3 mice per genotype). Asterisks denote significant changes from BubR1H/H values. *p < 0.05; **p < 0.01; ***p < 0.001. See also Figure S3.
Figure 6
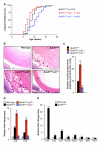
Figure 6. p53 Delays while p21 Drives Cataractogenesis in BubR1 Progeroid Mice
(A) Incidence and latency of cataract formation in BubR1H/H, BubR1H/H;p53−/−, and BubR1H/H; p21−/− animals as detected by use of slit light after dilating the eyes. (B) Hematoxylin and eosin-stained lenses of 2-month-old mice. Arrowheads indicate posteriorly located lens epithelial cells. Asterisks mark Morgagnian globules. Scale bar represents 100 μm. (C) Quantitation of the average number of posteriorly located cells (defined as cells that have migrated past the lens epithelial bow) in lenses of the indicated genotypes. Data are mean ±SD (n = 4 mice per genotype, two lenses per mouse). We note that no cells are detectable in this area of wild-type mice. (D) qRT-PCR analysis of p16Ink4a and p19Arf expression in eye tissue of 2-month-old mice. Data are mean ±SD (n = 5 mice of each genotype). (E) qRT-PCR analysis on lens tissue of 6-month-old wild-type and BubR1H/H mice. Data are mean ±SD (n = 10 mice per genotype). Asterisks denote significant differences compared to BubR1H/H mice. *p < 0.05; **p < 0.01; ***p < 0.001. See also Figure S4.

Similar articles

Cited by

References

    1. Babu JR, Jeganathan KB, Baker DJ, Wu X, Kang-Decker N, van Deursen JM. Rae1 is an essential mitotic checkpoint regulator that cooperates with Bub3 to prevent chromosome missegregation. J. Cell Biol. 2003;160:341–353. - PMC - PubMed
    1. Baker DJ, Jeganathan KB, Cameron JD, Thompson M, Juneja S, Kopecka A, Kumar R, Jenkins RB, de Groen PC, Roche P, van Deursen JM. BubR1 insufficiency causes early onset of aging-associated phenotypes and infertility in mice. Nat. Genet. 2004;36:744–749. - PubMed
    1. Baker DJ, Jeganathan KB, Malureanu L, Perez-Terzic C, Terzic A, van Deursen JM. Early aging-associated phenotypes in Bub3/Rae1 haploinsufficient mice. J. Cell Biol. 2006;172:529–540. - PMC - PubMed
    1. Baker DJ, Jin F, van Deursen JM. The yin and yang of the Cdkn2a locus in senescence and aging. Cell Cycle. 2008a;7:2795–2802. - PMC - PubMed
    1. Baker DJ, Perez-Terzic C, Jin F, Pitel KS, Niederländer NJ, Jeganathan K, Yamada S, Reyes S, Rowe L, Hiddinga HJ, et al. Opposing roles for p16Ink4a and p19Arf in senescence and ageing caused by BubR1 insufficiency. Nat. Cell Biol. 2008b;10:825–836. - PMC - PubMed

Publication types

MeSH terms

Substances

Supplementary concepts