. 2013 Apr 16:2:e00459.
doi: 10.7554/eLife.00459.

The ART-Rsp5 ubiquitin ligase network comprises a plasma membrane quality control system that protects yeast cells from proteotoxic stress

Affiliations

The ART-Rsp5 ubiquitin ligase network comprises a plasma membrane quality control system that protects yeast cells from proteotoxic stress

Yingying Zhao et al. Elife. .

Abstract

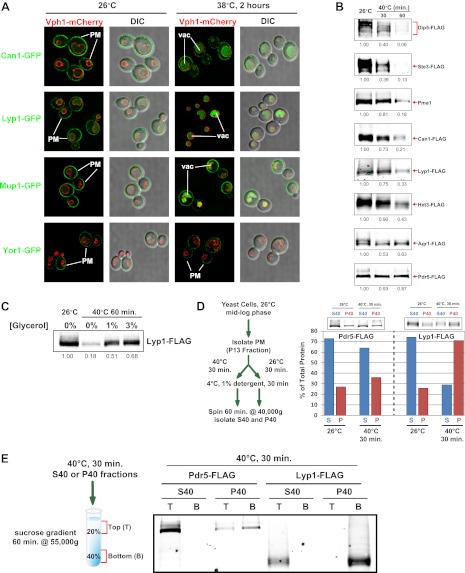
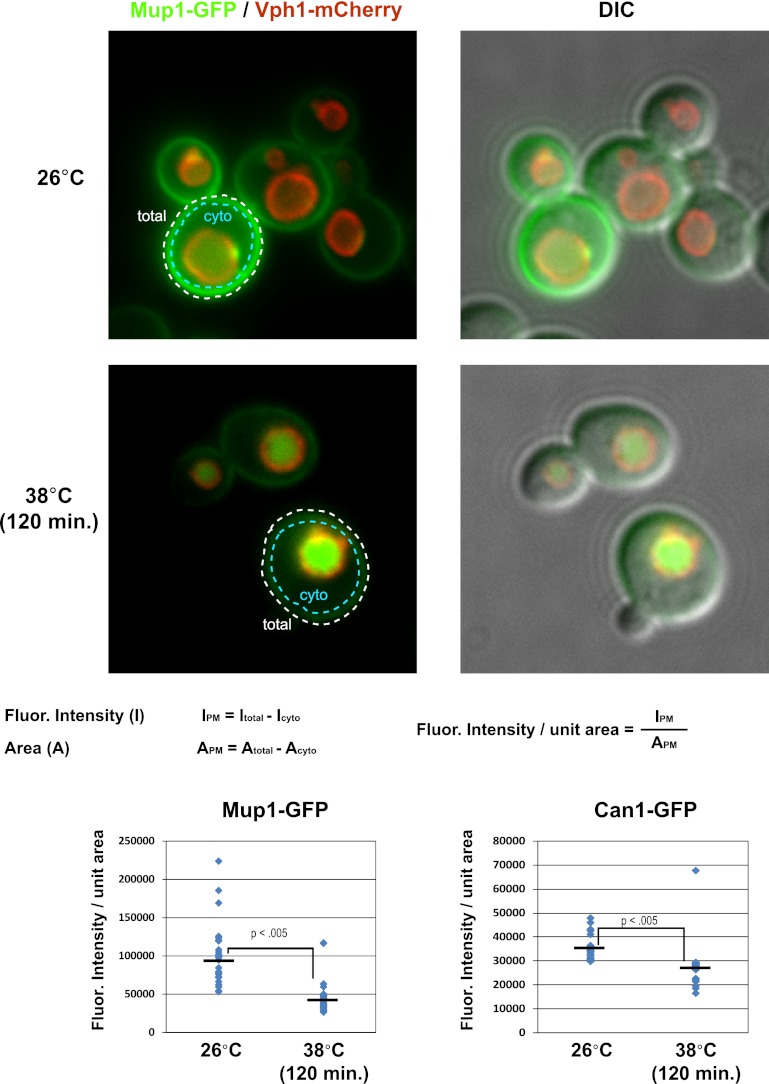
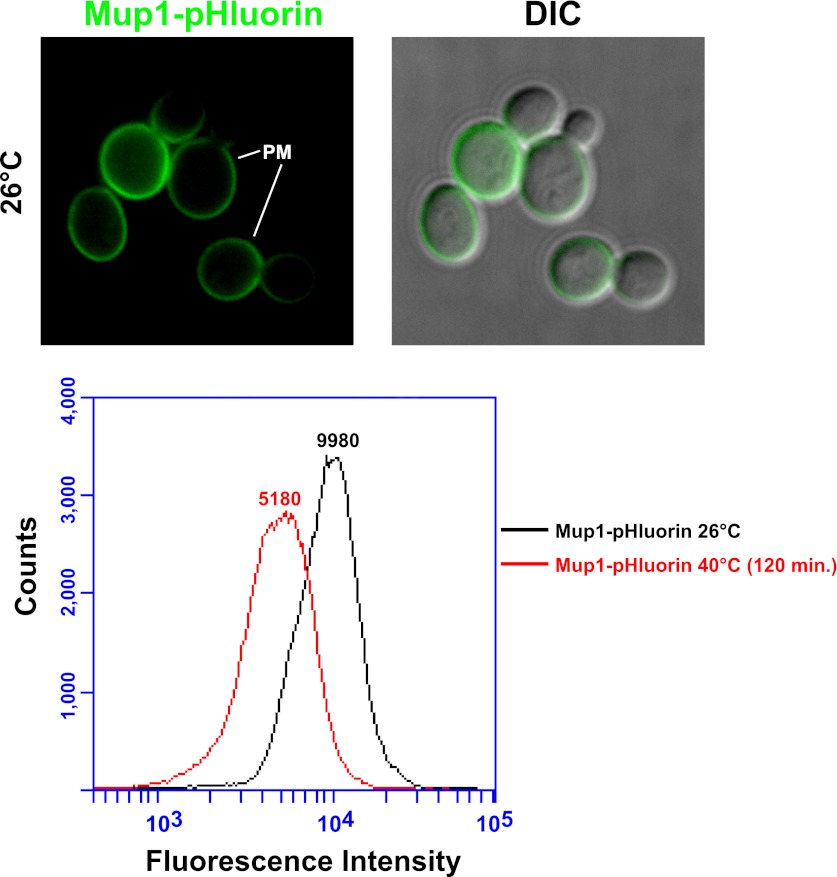
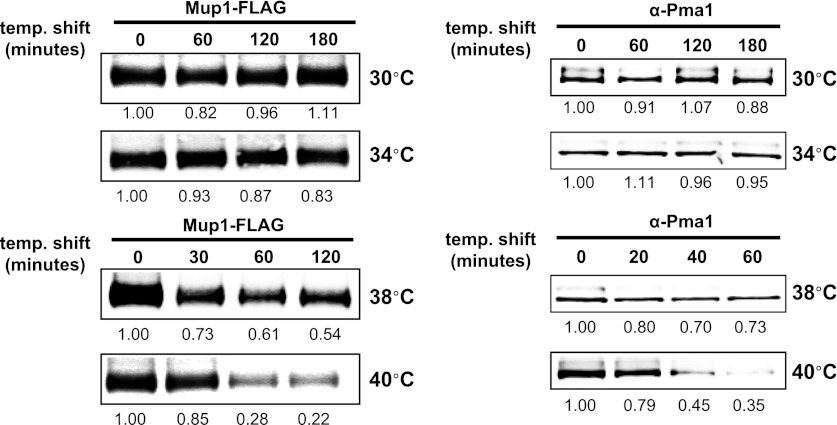
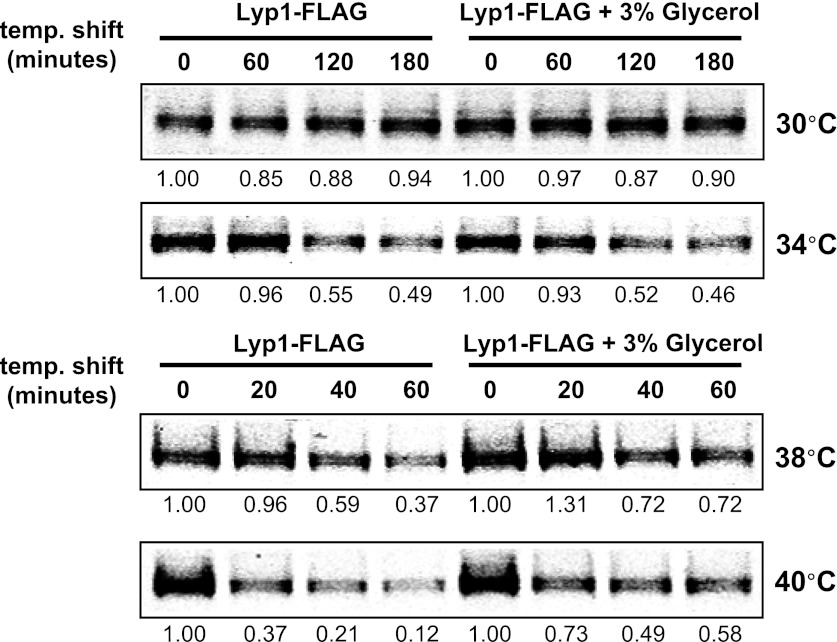
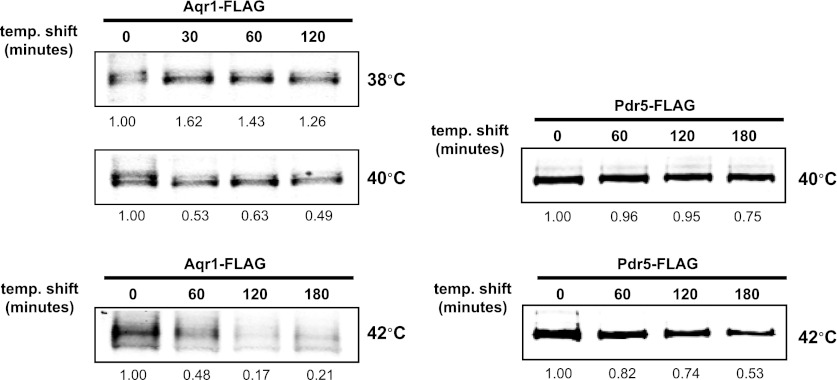
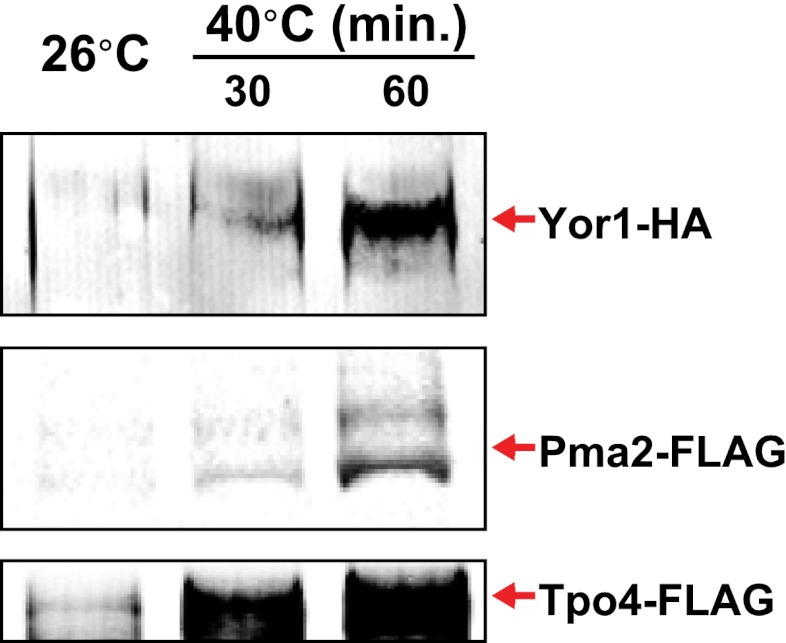
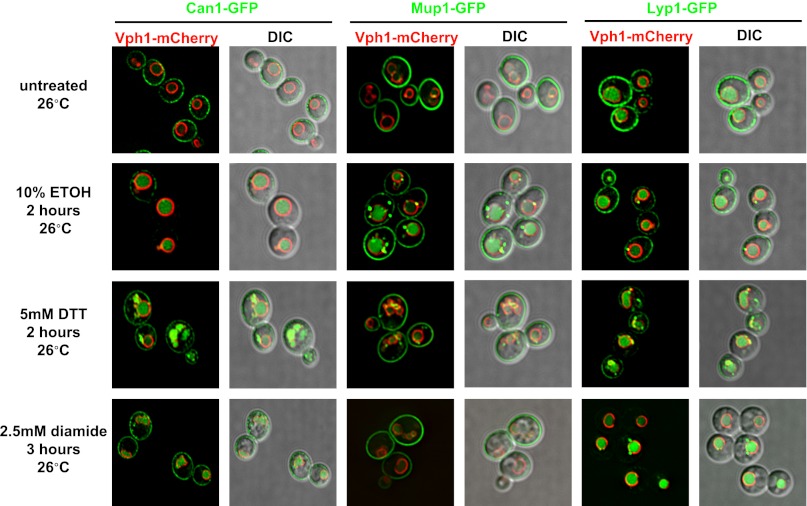
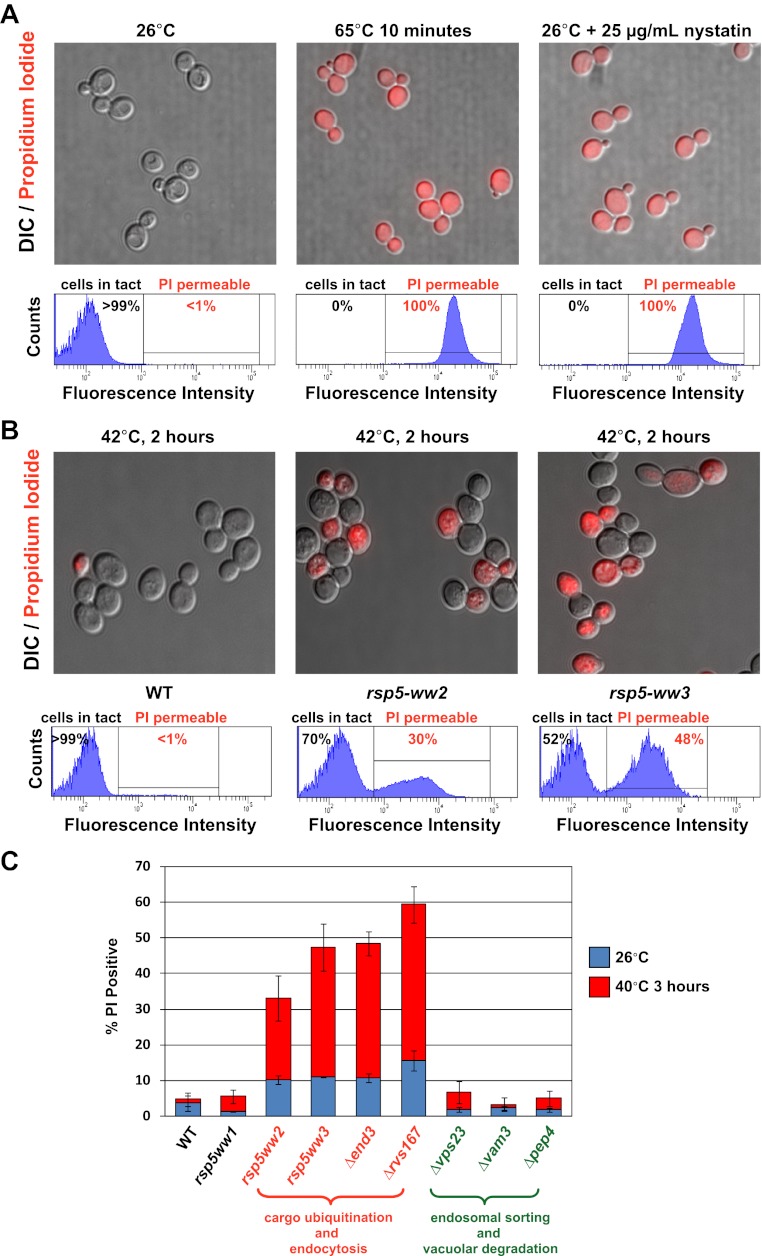
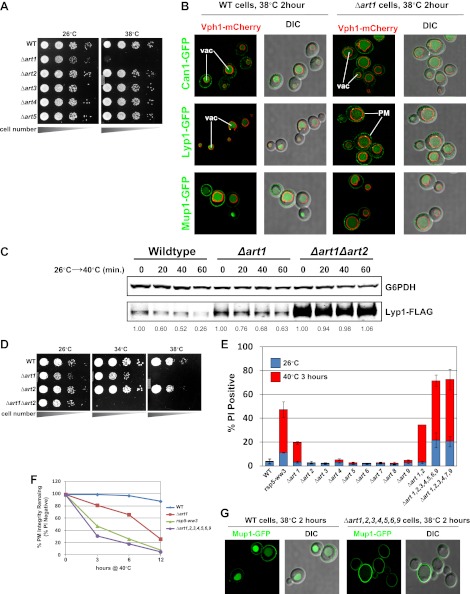
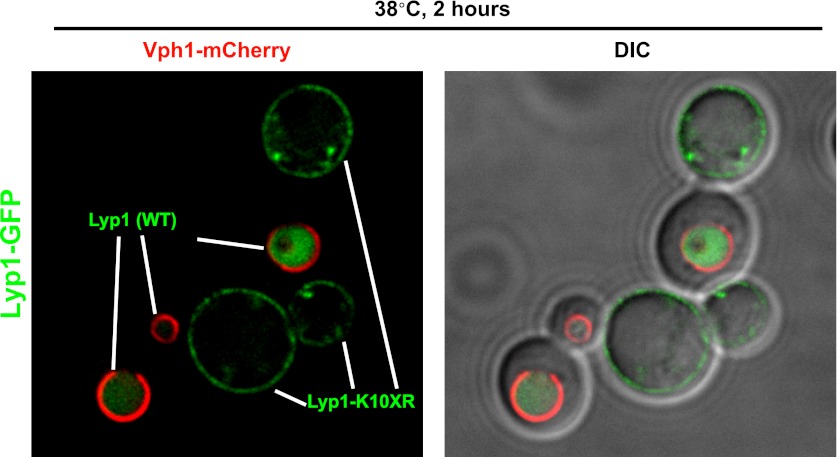
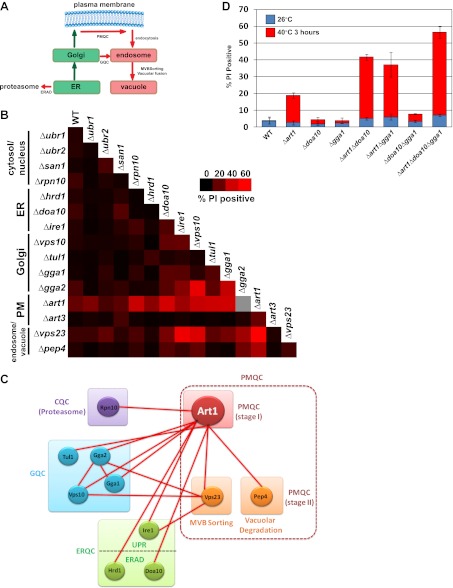
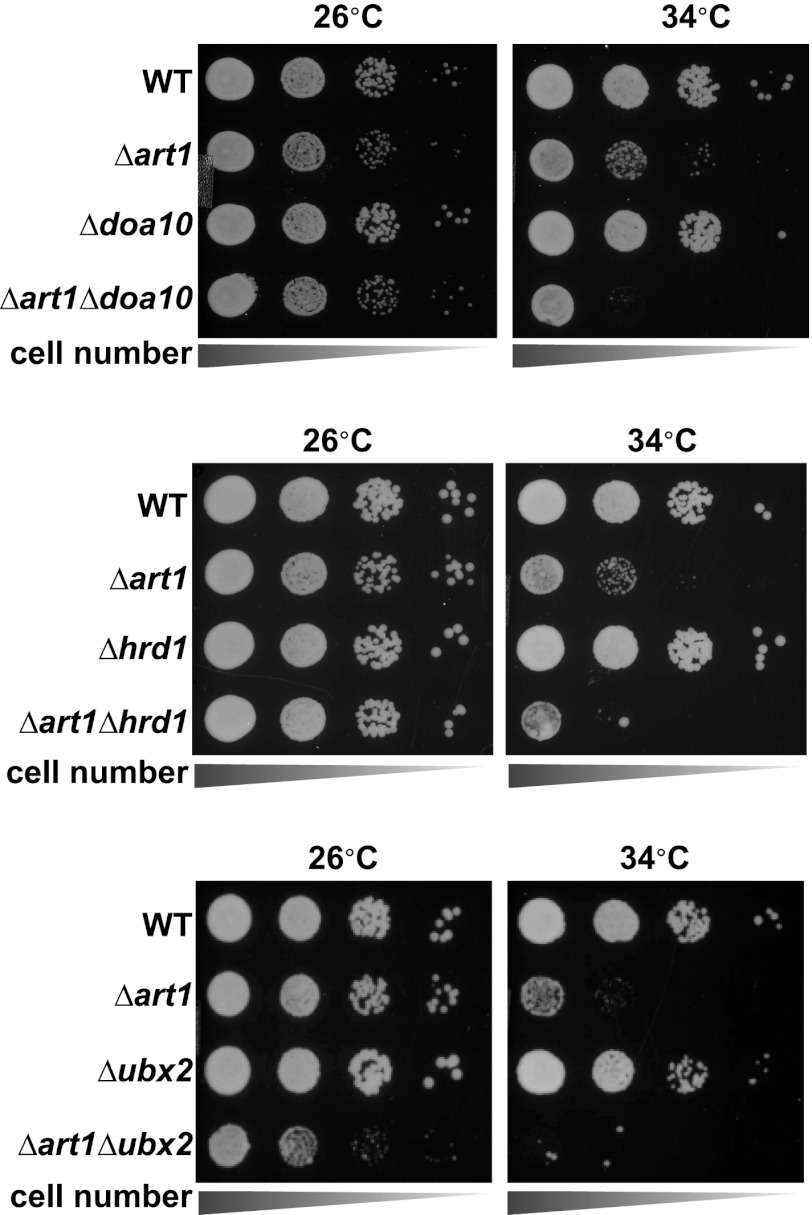
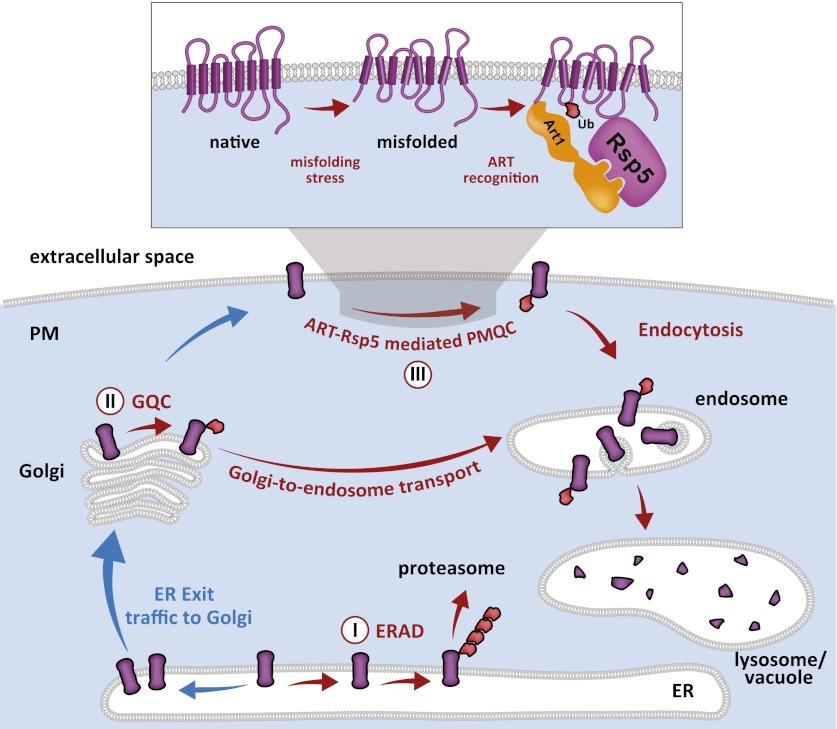
Secretory cargo that cannot fold properly in the ER are selectively targeted for removal by a well-studied ER-associated degradation pathway, or ERAD. In contrast, very little is known about post-ER quality control mechanisms for damaged or misfolded integral membrane proteins. Here we describe a quality control function of the Rsp5-ART ubiquitin ligase adaptor network that functions to protect plasma membrane (PM) integrity. Failure to mediate this protective response during heat stress leads to toxic accumulation of misfolded integral membrane proteins at the cell surface, which causes loss of PM integrity and cell death. Thus, the Rsp5-ART network comprises a PM quality control system that works together with sequential quality control pathways in the ER and Golgi to (i) target the degradation of proteins that have exceeded their functional lifetime due to damage and/or misfolding and (ii) limit the toxic accumulation of specific proteins at the cell surface during proteotoxic stress. DOI:http://dx.doi.org/10.7554/eLife.00459.001.

Keywords: S. cerevisiae; endocytosis; membrane traffic; proteostasis; quality control; ubiquitin.


Conflict of interest statement

The authors declare that no competing interests exist.

Figures

Figure 1.
Figure 1.. Heat stress triggers endocytic downregulation.
(A) Fluorescence distribution of GFP-tagged endocytic cargoes (green) was analyzed in wildtype yeast cells expressing the vacuolar marker Vph1-mCherry (red). Cells were grown to mid-log phase at 26°C (left panels) and then shifted to 38°C for 2 hr (right panels). Plasma membrane (‘PM’) and vacuole (‘vac’) localization are indicated. Note that the GFP moiety of cargo fusions resists hydrolysis and thus fluorescence signal accumulates in the vacuole even as the protein appears to be degraded as monitored by immunoblot. (B) Stability of affinity-tagged cargoes was analyzed following temperature shift from 26°C (left lane) to 40°C. The number beneath each lane indicates quantification of protein abundance (relative to 26°C, t = 0 and normalized to G6PDH as a loading control) determined using the Li-Cor system. (C) Analysis of heat-induced degradation of Lyp1 in the presence of glycerol, a chemical chaperone. (D) Detergent solubility of a thermostable cargo (Pdr5) and a thermolabile cargo (Lyp1) was analyzed at low and high temperature. A schematic representation for the experimental design is shown at the left. (E) Detergent soluble (S40) and insoluble (P40) fractions from membranes incubated at 40°C for 30 min were analyzed for mobility on sucrose step gradients. Top (T) fractions were immobile on the gradient, while bottom (B) fractions migrated through the gradient. DOI: http://dx.doi.org/10.7554/eLife.00459.003
Figure 1—figure supplement 1.
Figure 1—figure supplement 1.. Cell surface fluorescence intensity was measured for Mup1-GFP and Can1-GFP following growth at 26°C or following a shift to 38°C for 2 hr.
Top panels illustrate how PM fluorescence intensity was measured and calculated and bottom panels depict fluorescence intensity measurements over many cells (n > 30 cells). DOI: http://dx.doi.org/10.7554/eLife.00459.004
Figure 1—figure supplement 2.
Figure 1—figure supplement 2.. Mup1-pHluorin was used to quantify surface abundance of Mup1 for a population of yeast cells at 26°C or following a shift to 38°C for 2 hr (bottom panel).
Mup1 pHluorin signal originates almost exclusively from the PM (top panel). DOI: http://dx.doi.org/10.7554/eLife.00459.005
Figure 1—figure supplement 3.
Figure 1—figure supplement 3.. Stability of affinity-tagged Mup1 and Pma1 was analyzed following temperature shift from 26°C to indicated temperatures.
DOI: http://dx.doi.org/10.7554/eLife.00459.006
Figure 1—figure supplement 4.
Figure 1—figure supplement 4.. Stability of Lyp1 was analyzed following temperature shift from 26°C to indicated temperatures in the presence or absence of 3% glycerol.
DOI: http://dx.doi.org/10.7554/eLife.00459.007
Figure 1—figure supplement 5.
Figure 1—figure supplement 5.. Stability of affinity-tagged Aqr1 and Pdr5 was analyzed following temperature shift from 26°C to indicated temperatures.
DOI: http://dx.doi.org/10.7554/eLife.00459.008
Figure 1—figure supplement 6.
Figure 1—figure supplement 6.. Identification of integral PM proteins induced by shifting cells to 40°C.
DOI: http://dx.doi.org/10.7554/eLife.00459.009
Figure 1—figure supplement 7.
Figure 1—figure supplement 7.. Various proteotoxic stresses trigger endocytic downregulation.
Fluorescence distribution of GFP-tagged endocytic cargoes (green) was analyzed in wildtype yeast cells expressing the vacuolar marker Vph1-mCherry (red). Cells were grown to mid-log at 26°C and then subject to the following types of proteotoxic stress: 10% ethanol for 2 hr, 5 mM DTT for 2 hr, or 2.5 mM diamide for 3 hr. Trafficking of Can1-GFP (left), Mup1-GFP (middle), and Lyp1-GFP (right) was analyzed. Plasma membrane (‘PM’) and vacuole (‘vac’) localization are indicated. DOI: http://dx.doi.org/10.7554/eLife.00459.010
Figure 1—figure supplement 8.
Figure 1—figure supplement 8.. Analysis of cargo thermostability.
For each heat-induced degradation timecourse experiment, the half-life of each cargo was estimated at each temperature using linear regression. Cargo half-life is shown plotted as a function of temperature for each cargo, revealing different cargoes exhibit different thermostability profiles. The graph on the left shows the thermostability of Lyp1, Mup1, and Aqr1. The graph on the right includes the same data but is scaled to also include thermostability data for Pdr5. DOI: http://dx.doi.org/10.7554/eLife.00459.011
Figure 1—figure supplement 9.
Figure 1—figure supplement 9.. Analysis of Lyp1 thermostability in the absence or presence of 3% glycerol.
See also Figure 1—figure supplement 2. DOI: http://dx.doi.org/10.7554/eLife.00459.012
Figure 1—figure supplement 10.
Figure 1—figure supplement 10.. Analysis of the kinetics of Mup1 lysosomal degradation following the addition of methionine at 26°C in the absence or presence of 3% glycerol.
DOI: http://dx.doi.org/10.7554/eLife.00459.013
Figure 2.
Figure 2.. Rsp5 mediates the heat-induced endocytic response.
(A) Fluorescence distribution of GFP-tagged endocytic cargoes (green) was analyzed in wildtype (left panels), rsp5-ww2 (middle panels), or rsp5-ww3 (right panels) yeast cells expressing the vacuolar marker Vph1-mCherry (red). Cells were grown to mid-log at 26°C and then shifted to 38°C for 2 hr. Plasma membrane (‘PM’) and vacuole (‘vac’) localization are indicated. (B) and (C) Stability of affinity-tagged cargoes was analyzed following temperature shift from 26°C (left lane) to 40°C. The number beneath each lane indicates quantification of protein abundance (relative to 26°C, t = 0 and normalized to G6PDH as a loading control) determined using the Li-Cor system. (D) Heat-sensitivity analysis of wildtype, rsp5-ww2, or rsp5-ww3 yeast cells. DOI: http://dx.doi.org/10.7554/eLife.00459.015
Figure 3.
Figure 3.. Rsp5-mediated endocytic clearance protects PM integrity during heat stress.
(A) Yeast cells that were either grown at 26°C to mid-log phase (left), heated to 65°C for 10 min (middle), or treated with nystatin (right) were stained with propidium iodide (PI) and analyzed by fluorescence microscopy (top) and flow cytometry (bottom). (B) Wildtype (left), rsp5-ww2 (middle), or rsp5-ww3 (right) yeast cells were grown to mid-log at 26°C, shifted to 42°C for 2 hr, stained with PI, and analyzed by fluorescence microscopy (top) and flow cytometry (bottom). (C) Flow cytometry was used to analyze PI staining of the indicated strains at 26°C (blue bars) or following growth at 40°C for 3 hr (red bars). DOI: http://dx.doi.org/10.7554/eLife.00459.016
Figure 4.
Figure 4.. ARTs protect plasma membrane integrity during heat stress.
(A) Heat-sensitivity analysis of wildtype and art mutant yeast cells. See Figure 4—figure supplement 1 for additional characterization of art mutant yeast cells. (B) Fluorescence distribution of GFP-tagged endocytic cargoes (green) was analyzed in wildtype (left panels) and Δart1 (right panels) yeast cells expressing the vacuolar marker Vph1-mCherry (red). Cells were grown to mid-log at 26°C and then shifted to 38°C for 2 hr. Plasma membrane (‘PM’) and vacuole (‘vac’) localization are indicated. (C) Stability of affinity-tagged Lyp1 was analyzed following temperature shift from 26°C (left lane) to 40°C. The number beneath each lane indicates quantification of protein abundance (relative to 26°C, t = 0) determined using the Li-Cor system. (D) Heat-sensitivity analysis of wildtype, Δart1, Δart2, and Δart1Δart2 mutant yeast cells. (E) Flow cytometry was used to analyze PI staining of the indicated strains at 26°C (blue bars) or following growth at 40°C for 3 hr (red bars). (F) Kinetic analysis of PI staining for a 40°C heat stress timecourse. (G) Fluorescence distribution of GFP-tagged Mup1 (green) was analyzed in wildtype (left panels) and Δart1Δart2Δart3Δart4Δart5Δart6Δart9 (right panels) yeast cells during heat stress. DOI: http://dx.doi.org/10.7554/eLife.00459.017
Figure 4—figure supplement 1.
Figure 4—figure supplement 1.. Heat-sensitivity analysis of wildtype and art mutant yeast cells.
DOI: http://dx.doi.org/10.7554/eLife.00459.018
Figure 4—figure supplement 2.
Figure 4—figure supplement 2.. Fluorescence distribution of GFP-tagged Art1 (green) was analyzed at 26°C and 38°C in yeast cells expressing the vacuolar marker Vph1-mCherry (red).
Cells were grown to mid-log at 26°C and then shifted to 38°C for 2 hr. Plasma membrane (‘PM’) and Golgi localization are indicated. DOI: http://dx.doi.org/10.7554/eLife.00459.019
Figure 4—figure supplement 3.
Figure 4—figure supplement 3.. Results of a screen to identify multicopy bypass suppressors of the Δart1 ts phenotype.
Overexpression of ART2 can suppress the ts phenotype but not the canavanine hypersensitivity phenotype of Δart1 mutant cells. DOI: http://dx.doi.org/10.7554/eLife.00459.020
Figure 5.
Figure 5.. Cargo accumulation at the PM is toxic during heat stress.
(A) heat-sensitivity analysis of wildtype, Δart1, Δlyp1, and Δart1Δlyp1 mutant yeast cells. (B) Empty vector or plasmids encoding Lyp1-FLAG expressed from different promoters (pCPY, pLYP1, pADH1) were transformed into Δart1Δlyp1 mutant yeast cells and the affect on heat tolerance was scored by growth at the indicated temperatures. Lyp1 expression level for each strain was analyzed by quantitative Western blot (Li-Cor). (C) Empty vector or plasmids encoding Lyp1-K10XR-FLAG (which lacks N-terminal lysine residues) expressed from different promoters (pCPY, pLYP1, pADH1, pTDH3) were transformed into wildtype yeast cells and the affect on heat tolerance was scored by growth at the indicated temperatures. (D) Flow cytometry was used to analyze PI staining of Δart1Δlyp1 mutant yeast cells expressing Lyp1 from different promoters (pCPY, pLYP1, pADH1) following growth at 40°C for 3 hr. (E) Flow cytometry was used to analyze PI staining of wildtype yeast cells coordinately expressing Lyp1 from the TDH3 promoter and Art1 from different promoters (pART1, pCPY, pADH1, pTDH3) following growth at 40°C for 3 hr. DOI: http://dx.doi.org/10.7554/eLife.00459.021
Figure 5—figure supplement 1.
Figure 5—figure supplement 1.. Heat-sensitivity analysis of wildtype yeast cells expressing titrated levels of Lyp1.
DOI: http://dx.doi.org/10.7554/eLife.00459.022
Figure 5—figure supplement 2.
Figure 5—figure supplement 2.. Stability of wildtype Lyp1 or the K10XR mutant, which cannot be ubiquitinated on its N-terminal cytosolic tail.
DOI: http://dx.doi.org/10.7554/eLife.00459.023
Figure 5—figure supplement 3.
Figure 5—figure supplement 3.. Fluorescence distribution of GFP-tagged wildtype Lyp1 (green, only in cells expressing Vph1-mCherry) or the K10XR mutant (green, only in cells without Vph1-mCherry) was analyzed following growth at 38°C for 2 hr.
DOI: http://dx.doi.org/10.7554/eLife.00459.024
Figure 6.
Figure 6.. Systems level coordination of integral membrane protein quality control.
(A) Model illustrating the major quality control mechanisms for integral membrane proteins: ERAD (proteasomal degradation), Golgi quality control (GQC; vacuolar/lysosomal degradation), and plasma membrane quality control (PMQC; vacuolar/lysosomal degradation). (B) Genetic array constructed for known quality control systems in the cell. Red color indicates the percentage of yeast cells staining PI positive following growth at 40°C for 3 hr (see key inset). Gray box indicates a strain which could not be obtained due to synthetic lethality in the SEY6210 background. (C) Node network illustrating all genetic interactions observed for protein quality control systems (cytosolic quality control, CQC; ER quality control, ERQC; Golgi quality control, GQC; PM quality control, PMQC) in Figure 6B. (D) Flow cytometry was used to analyze PI staining of the indicated strains following growth at 40°C for 3 hr. DOI: http://dx.doi.org/10.7554/eLife.00459.025
Figure 6—figure supplement 1.
Figure 6—figure supplement 1.. Heat-sensitivity analysis of wildtype and mutant yeast cells.
DOI: http://dx.doi.org/10.7554/eLife.00459.026
Figure 7.
Figure 7.. Cellular mechanisms of integral membrane protein quality control.
Integral membrane proteins are subject to sequential quality control mechanisms including ERAD in the ER (I), GQC in the Golgi (II), and ART-Rsp5 mediated PMQC at the PM (III). DOI: http://dx.doi.org/10.7554/eLife.00459.027

Similar articles

Cited by

References

    1. Apaja PM, Xu H, Lukacs GL. 2010. Quality control for unfolded proteins at the plasma membrane. J Cell Biol 191:553–70 doi: 10.1083/jcb.201006012 - DOI - PMC - PubMed
    1. Bernier V, Lagacé M, Bichet DG, Bouvier M. 2004. Pharmacological chaperones: potential treatment for conformational diseases. Trends Endocrinol Metab 15:222–8 doi: 10.1016/j.tem.2004.05.003 - DOI - PubMed
    1. Claessen JH, Kundrat L, Ploegh HL. 2011. Protein quality control in the ER: balancing the ubiquitin checkbook. Trends Cell Biol 22:22–32 doi: 10.1016/j.tcb.2011.09.010 - DOI - PMC - PubMed
    1. Fang NN, Ng AH, Measday V, Mayor T. 2011. Hul5 HECT ubiquitin ligase plays a major role in the ubiquitylation and turnover of cytosolic misfolded proteins. Nat Cell Biol 13:1344–52 doi: 10.1038/ncb2343 - DOI - PMC - PubMed
    1. Fredrickson EK, Rosenbaum JC, Locke MN, Milac TI, Gardner RG. 2011. Exposed hydrophobicity is a key determinant of nuclear quality control degradation. Mol Biol Cell 22:2384–95 doi: 10.1091/mbc.E11-03-0256 - DOI - PMC - PubMed

Publication types

MeSH terms

Substances