TherMos: Estimating protein-DNA binding energies from in vivo binding profiles
- PMID: 23595148
- PMCID: PMC3675472
- DOI: 10.1093/nar/gkt250
TherMos: Estimating protein-DNA binding energies from in vivo binding profiles
Abstract
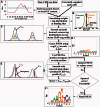
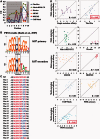
Accurately characterizing transcription factor (TF)-DNA affinity is a central goal of regulatory genomics. Although thermodynamics provides the most natural language for describing the continuous range of TF-DNA affinity, traditional motif discovery algorithms focus instead on classification paradigms that aim to discriminate 'bound' and 'unbound' sequences. Moreover, these algorithms do not directly model the distribution of tags in ChIP-seq data. Here, we present a new algorithm named Thermodynamic Modeling of ChIP-seq (TherMos), which directly estimates a position-specific binding energy matrix (PSEM) from ChIP-seq/exo tag profiles. In cross-validation tests on seven genome-wide TF-DNA binding profiles, one of which we generated via ChIP-seq on a complex developing tissue, TherMos predicted quantitative TF-DNA binding with greater accuracy than five well-known algorithms. We experimentally validated TherMos binding energy models for Klf4 and Esrrb, using a novel protocol to measure PSEMs in vitro. Strikingly, our measurements revealed strong non-additivity at multiple positions within the two PSEMs. Among the algorithms tested, only TherMos was able to model the entire binding energy landscape of Klf4 and Esrrb. Our study reveals new insights into the energetics of TF-DNA binding in vivo and provides an accurate first-principles approach to binding energy inference from ChIP-seq and ChIP-exo data.
Figures


Similar articles
-
MACE: model based analysis of ChIP-exo.Nucleic Acids Res. 2014 Nov 10;42(20):e156. doi: 10.1093/nar/gku846. Epub 2014 Sep 23. Nucleic Acids Res. 2014. PMID: 25249628 Free PMC article.
-
Improving analysis of transcription factor binding sites within ChIP-Seq data based on topological motif enrichment.BMC Genomics. 2014 Jun 13;15(1):472. doi: 10.1186/1471-2164-15-472. BMC Genomics. 2014. PMID: 24927817 Free PMC article.
-
Genome-wide identification of in vivo protein-DNA binding sites from ChIP-Seq data.Nucleic Acids Res. 2008 Sep;36(16):5221-31. doi: 10.1093/nar/gkn488. Epub 2008 Aug 6. Nucleic Acids Res. 2008. PMID: 18684996 Free PMC article.
-
Genome Wide Approaches to Identify Protein-DNA Interactions.Curr Med Chem. 2019;26(42):7641-7654. doi: 10.2174/0929867325666180530115711. Curr Med Chem. 2019. PMID: 29848263 Review.
-
DNA sequence motif: a jack of all trades for ChIP-Seq data.Adv Protein Chem Struct Biol. 2013;91:135-71. doi: 10.1016/B978-0-12-411637-5.00005-6. Adv Protein Chem Struct Biol. 2013. PMID: 23790213 Review.
Cited by
-
Decoupling of evolutionary changes in transcription factor binding and gene expression in mammals.Genome Res. 2015 Feb;25(2):167-78. doi: 10.1101/gr.177840.114. Epub 2014 Nov 13. Genome Res. 2015. PMID: 25394363 Free PMC article.
-
Quality versus accuracy: result of a reanalysis of protein-binding microarrays from the DREAM5 challenge by using BayesPI2 including dinucleotide interdependence.BMC Bioinformatics. 2014 Aug 27;15(1):289. doi: 10.1186/1471-2105-15-289. BMC Bioinformatics. 2014. PMID: 25158938 Free PMC article.
-
Bayesian Markov models consistently outperform PWMs at predicting motifs in nucleotide sequences.Nucleic Acids Res. 2016 Jul 27;44(13):6055-69. doi: 10.1093/nar/gkw521. Epub 2016 Jun 9. Nucleic Acids Res. 2016. PMID: 27288444 Free PMC article.
-
Evidence supporting the existence of a NUPR1-like family of helix-loop-helix chromatin proteins related to, yet distinct from, AT hook-containing HMG proteins.J Mol Model. 2014 Aug;20(8):2357. doi: 10.1007/s00894-014-2357-7. Epub 2014 Jul 24. J Mol Model. 2014. PMID: 25056123 Free PMC article.
-
Insights from resolving protein-DNA interactions at near base-pair resolution.Brief Funct Genomics. 2018 Mar 1;17(2):80-88. doi: 10.1093/bfgp/elx043. Brief Funct Genomics. 2018. PMID: 29211822 Free PMC article. Review.
References
-
- Stormo GD. Consensus patterns in DNA. Methods Enzymol. 1990;183:211–221. - PubMed
-
- Bailey TL, Elkan C. Proceedings of the Second International Conference on Intelligent Systems for Molecular Biology. Menlo Park, CA: August. AAAI Press; 1994. Fitting a mixture model by expectation maximization to discover motifs in biopolymers; pp. 28–36. - PubMed
Publication types
MeSH terms
Substances
LinkOut - more resources
Full Text Sources
Other Literature Sources
Molecular Biology Databases
Miscellaneous

