. 2013 Apr 11;153(2):307-19.
doi: 10.1016/j.cell.2013.03.035.

Master transcription factors and mediator establish super-enhancers at key cell identity genes

Affiliations

Master transcription factors and mediator establish super-enhancers at key cell identity genes

Warren A Whyte et al. Cell. .

Abstract

Master transcription factors Oct4, Sox2, and Nanog bind enhancer elements and recruit Mediator to activate much of the gene expression program of pluripotent embryonic stem cells (ESCs). We report here that the ESC master transcription factors form unusual enhancer domains at most genes that control the pluripotent state. These domains, which we call super-enhancers, consist of clusters of enhancers that are densely occupied by the master regulators and Mediator. Super-enhancers differ from typical enhancers in size, transcription factor density and content, ability to activate transcription, and sensitivity to perturbation. Reduced levels of Oct4 or Mediator cause preferential loss of expression of super-enhancer-associated genes relative to other genes, suggesting how changes in gene expression programs might be accomplished during development. In other more differentiated cells, super-enhancers containing cell-type-specific master transcription factors are also found at genes that define cell identity. Super-enhancers thus play key roles in the control of mammalian cell identity.


Figures

Figure 1
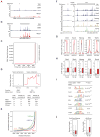
Figure 1. Enhancers and super-enhancers in ESCs
A,B) ChIP-Seq binding profiles (reads per million per base pair) for ESC transcription factors Oct4, Sox2, and Nanog (OSN), and the Mediator coactivator (Med1) at the Gck and miR-290-295 loci in ESCs. Gene models are depicted below the binding profiles. Enhancer bars and scale bars are depicted above the binding profiles. C) Distribution of Mediator ChIP-Seq signal (total reads) across the 8,794 ESC enhancers. Mediator occupancy is not evenly distributed across the enhancer regions, with a subset of enhancers (the 231 super-enhancers) containing exceptionally high amounts of Mediator. D) Metagenes of Mediator ChIP-Seq density (reads per million per base pair) across the 8,563 typical enhancers and the 231 super-enhancers. Metagenes are centered on the enhancer region (703 base pairs for typical enhancers and 8.7kb for super-enhancers), with 3kb surrounding each enhancer region. ChIP-Seq fold difference for enhancer features Mediator, H3K27ac, H3K4me1, and DNaseI hypersensitivity at super-enhancers versus typical enhancers are displayed below the metagenes. Fold difference at enhancers refers to the mean ChIP-Seq signal (total reads) at super-enhancers divided by the mean ChIP-Seq signal at typical enhancers. Fold difference at enhancer constituents refers to the mean ChIP-Seq density (reads per million per base pair) at super-enhancer constituents divided by the mean ChIP-Seq density at typical enhancer constituents. See also Figure S1A and Data S1. E) Distribution of Mediator, H3K27ac, H3K4me1, DNaseI hypersensitivity, and OSN normalized ChIP-Seq signal across a subset of the 8,794 ESC enhancers. For each enhancer feature, the plot was normalized by dividing the ChIP-Seq signal at each ESC enhancer by the maximum ChIP-Seq signal. The enhancers on the X-axis are ranked for each enhancer feature independently (i.e., the exact enhancer at position 8000 is different for each enhancer feature). The x- and y-axes are adjusted so that the differences in the distribution of each of the enhancer features can be visualized. See also Figure S1B. F) ChIP-Seq binding profiles for Oct4, Sox2, Nanog, Klf4, and Esrrb at the Gck and miR-290-295 loci in ESCs. G) Metagenes of Oct4, Sox2, Nanog, Klf4 and Esrrb ChIP-Seq density across the constituent enhancers within the 8,563 typical enhancers and the 231 super-enhancer regions. Each metagene is centered on a constituent enhancer with 2kb surrounding the constituent enhancer region. H) Box plots of Oct4, Sox2, Nanog, Klf4 and Esrrb ChIP-Seq density at constituent enhancers within the 8,563 typical enhancers and the 231 super-enhancers. P-values (Oct4= 0.012, Nanog= 10−4, Sox2= 0.11, Klf4= 10−34, Esrrb= 10−25) were calculated using a two-tailed t-test. I) Table depicting transcription factor binding motifs enriched at constituent enhancers within super-enhancer regions relative to genomic background, and associated p-values. CTCF and c-Myc are not enriched. J) Left panel, Box plot depicting the number of Oct4, Sox2, or Nanog binding motifs at constituent enhancers within typical enhancers and constituent enhancers within super-enhancers. Right panel, Box plot depicting the number of Klf4 or Esrrb binding motifs at constituent enhancers within typical enhancers and constituent enhancers within super-enhancer regions. P-values (Oct4/Sox2/Nanog= 0.36, Klf4/Esrrb= 10−45) were calculated using a two-tailed t-test.
Figure 2
Figure 2. Super-enhancers are associated with key ESC pluripotency genes
A) ChIP-Seq binding profiles for OSN and Med1 at the Klf4 locus in ESCs. Previously described Hi-C interaction frequency (normalized interaction counts), and genomic coordinates comprising a portion of a topological domain (Dixon et al., 2012), are indicated above the binding profiles. B) ChIP-Seq binding profiles for OSN and Med1 at the Oct4 and Sox2 loci in ESCs. Gene models are depicted below the binding profiles. C) List of selected genes associated with super-enhancers and playing prominent roles in ESC biology. D) Super-enhancers are associated with genes encoding transcription factors, coactivators and chromatin regulators important for maintenance of ESC state. The gene set enrichment analysis (GSEA) of super-enhancer-associated genes reveals these genes encode regulators whose shRNA knockdown most impact Oct4 expression and ESC state. Knockdown of genes important for ESC identity causes Oct4 loss, which is reflected by a negative Z-score. P-value (10−2) was calculated as part of the GSEA analysis. E) Gene ontology (GO) functional categories for super-enhancer-associated genes. Genes encoding factors important for DNA synthesis, protein synthesis, and metabolism were not enriched. See also Figure S2. F) Schematic diagram of a small portion of the ESC core regulatory circuitry. Genes encoding the master transcription factors are themselves driven by super-enhancers. These master factors form an interconnected feedback loop and regulate their own expression, as well as the expression of other transcription factors and non-coding RNAs that play prominent roles in ESC biology.
Figure 3
Figure 3. Super-enhancers confer high transcriptional activity and sensitivity to perturbation
A) Box plots of expression (reads per kilobase of exon per million mapped reads (RPKM)) from typical enhancer-, super-enhancer-, and all enhancer-associated genes, as well as the top 1,000 highest expressed housekeeping genes. The number of genes belonging to each category for which we have expression data is denoted. P-value (10−5) was calculated using a two-tailed t-test. See also Figure S3A and Table S4. B) Upper panel, ChIP-Seq binding profiles for OSN and Med1 at the Sgk1 typical enhancer and Esrrb super-enhancer loci. Grey bars with dashed borders indicates cloned regions. Lower panel, Plot of luciferase activity 24 hours post transfection, normalized to a transfected control plasmid. Enhancers neighboring selected genes were cloned into reporter plasmids containing the Luciferase gene regulated by the Oct4 promoter, and subsequently transfected into ESCs. P-value (0.02) was calculated using a two-tailed t-test. See also Figure S3B. C) Upper panel, Schematic diagram of ESCs transduced with shRNAs against Oct4. Lower panel, Box plots of fold change expression in differentiating ESCs (3, 4 and 5 days after transduction) relative to control ESCs transduced with shRNAs against GFP. P-values (day 3= 10−5, day 4=10−8, day 5= 10−10) were calculated using a two-tailed t-test. See also Figure S3C. D) Upper panel, Schematic diagram of ESCs transduced with shRNAs against the Mediator subunit Med12. Lower panel, Box plots of fold change expression in Mediator-depleted ESCs (3, 4, and 5 days after transduction) relative to control ESCs. P-values (day 3= 10−11, day 4=10−11, day 5= 10−13) were calculated using a two-tailed t-test.
Figure 4
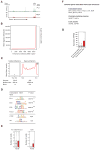
Figure 4. Super-enhancers in pro-B cells
A) ChIP-Seq binding profiles for PU.1, and Med1 at the Foxo1 locus in pro-B cells. B) Distribution of Mediator ChIP-Seq density across the 13,814 pro-B enhancers, with a subset of enhancers (the 395 super-enhancers) containing exceptionally high amounts of Mediator. See also Figure S4. C) Metagenes of Mediator density across the typical and super-enhancers in proB cells. Metagenes are centered on the enhancer region (422 base pairs for typical enhancers, and 15.4kb for super-enhancers), with 3kb surrounding each enhancer region. ChIP-Seq fold difference for Mediator at super-enhancers versus typical enhancers is displayed below the metagenes. D) Table depicting transcription factor binding motifs enriched at constituent enhancers within super-enhancer regions relative to genomic background and associated p-values. CTCF and Zfx are not enriched. E) Left panel, Box plot depicting the number of PU.1, Ebf1 or Foxo1 binding motifs at constituent enhancers within typical enhancers and constituent enhancers within super-enhancers. Right panel, Box plot depicting the number of E2A binding motifs at constituent enhancers within typical enhancers and constituent enhancers within super-enhancer regions. P-values (PU.1/Ebf1/Foxo1= 10−5, E2A= 10−22) were calculated using a two-tailed t-test. F) List of selected genes associated with super-enhancers and playing prominent roles in B cell biology. G) Box plots of expression from typical enhancer-, super-enhancer-, and all enhancer-associated genes in pro-B cells. The number of genes belonging to each category for which we have expression data is denoted. P-value (10−6) was calculated using a two-tailed t-test.
Figure 5
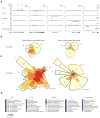
Figure 5. Super-enhancers are generally associated with key cell identity genes
A) ChIP-Seq binding profiles for master transcription factors (OSN in ESCs; PU.1 in pro-B cells; MyoD in myotubes; T-bet in Th cells; C/EBPα in macrophages), at the Esrrb, Inpp5d, Myod1, Tcf7 and Thbs-1 loci. See also Figure S5A,B. B) Venn diagrams of typical enhancer-associated and super-enhancer-associated genes in ESCs (blue border), pro-B cells (green border) and myotubes (orange border). C) Chow-Ruskey diagrams of typical enhancer-associated and super-enhancer-associated genes in ESCs (blue border), pro-B cells (green border), myotubes (orange border), Th cells (brown border) and macrophages (purple border). Color of the borders around each intersection corresponds to the cell types whose genes overlap. The red circle in the middle represents the overlap of all 5 cell types. Lighter shades of red, orange, and yellow represent the overlap of fewer cell types. Area of each intersection is proportional to number of genes within the intersection. D) Super-enhancers are associated with genes playing prominent roles in cell type-specific biology. The top 10 gene ontology terms of the genes associated with super-enhancers in ESCs, pro-B cells, myotubes, Th cells and macrophages are displayed. P-values corresponding to each of the gene ontology terms are displayed as a color bar, with color scale bar denoted below. See also Figure S5C,D.

Comment in

  • Gene expression: Super enhancers.
    Stower H. Stower H. Nat Rev Genet. 2013 Jun;14(6):367. doi: 10.1038/nrg3496. Epub 2013 Apr 23. Nat Rev Genet. 2013. PMID: 23609410 No abstract available.

Similar articles

Cited by

References

    1. Abujarour R, Efe J, Ding S. Genome-wide gain-of-function screen identifies novel regulators of pluripotency. Stem Cells. 2010;28:1487–1497. - PubMed
    1. Alinikula J, Kohonen P, Nera KP, Lassila O. Concerted action of Helios and Ikaros controls the expression of the inositol 5-phosphatase SHIP. Eur J Immunol. 2010;40:2599–2607. - PubMed
    1. Bernstein BE, Birney E, Dunham I, Green ED, Gunter C, Snyder M. An integrated encyclopedia of DNA elements in the human genome. Nature. 2012;489:57–74. - PMC - PubMed
    1. Borggrefe T, Yue X. Interactions between subunits of the Mediator complex with gene-specific transcription factors. Semin Cell Dev Biol. 2011;22:759–768. - PubMed
    1. Boyer LA, Lee TI, Cole MF, Johnstone SE, Levine SS, Zucker JP, Guenther MG, Kumar RM, Murray HL, Jenner RG, et al. Core transcriptional regulatory circuitry in human embryonic stem cells. Cell. 2005;122:947–956. - PMC - PubMed

Publication types

Associated data