. 2013 May;14(5):489-99.
doi: 10.1038/ni.2570. Epub 2013 Apr 7.

Sterol regulatory element-binding proteins are essential for the metabolic programming of effector T cells and adaptive immunity

Affiliations

Sterol regulatory element-binding proteins are essential for the metabolic programming of effector T cells and adaptive immunity

Yoko Kidani et al. Nat Immunol. 2013 May.

Abstract

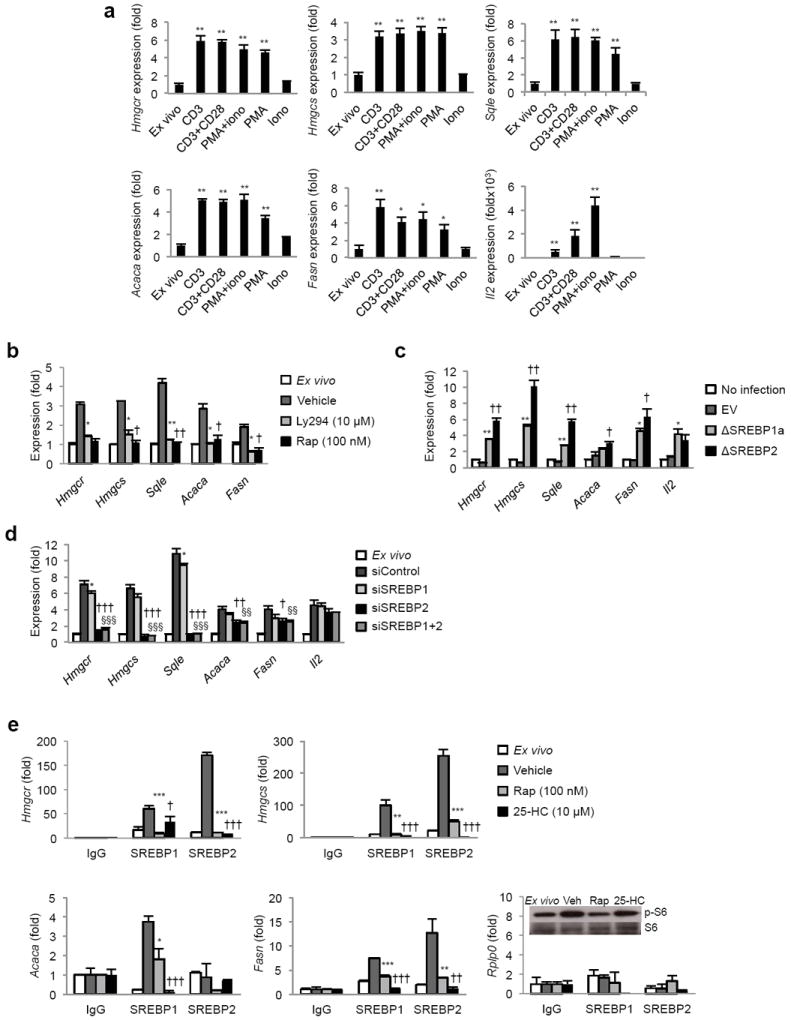
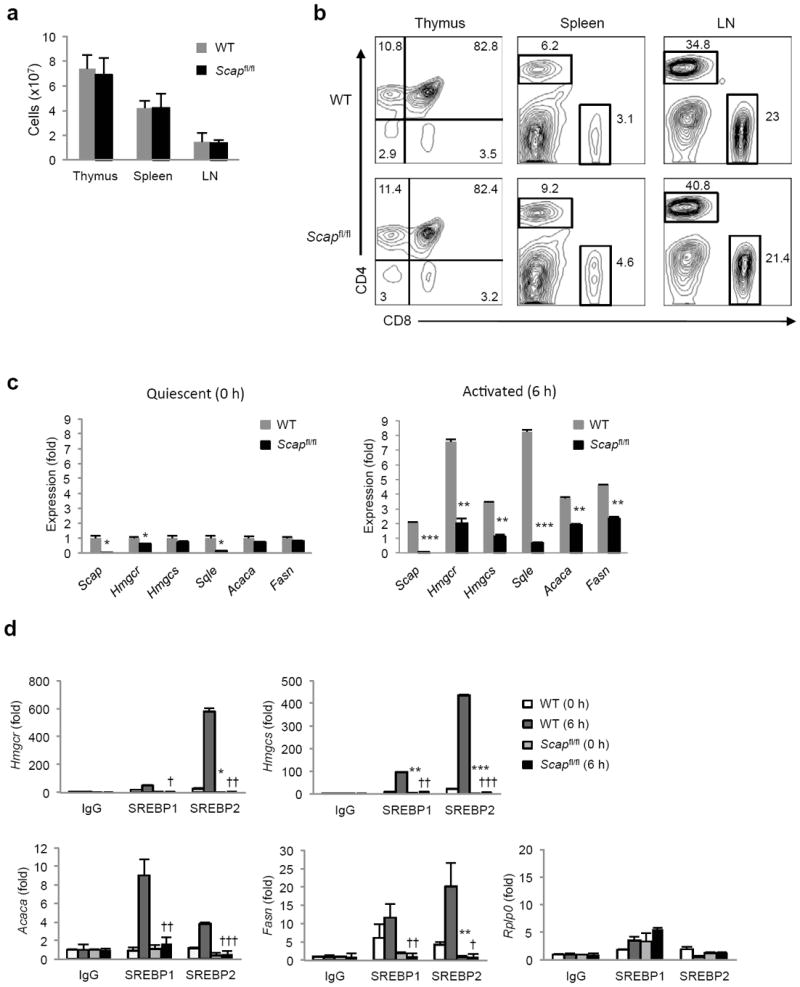
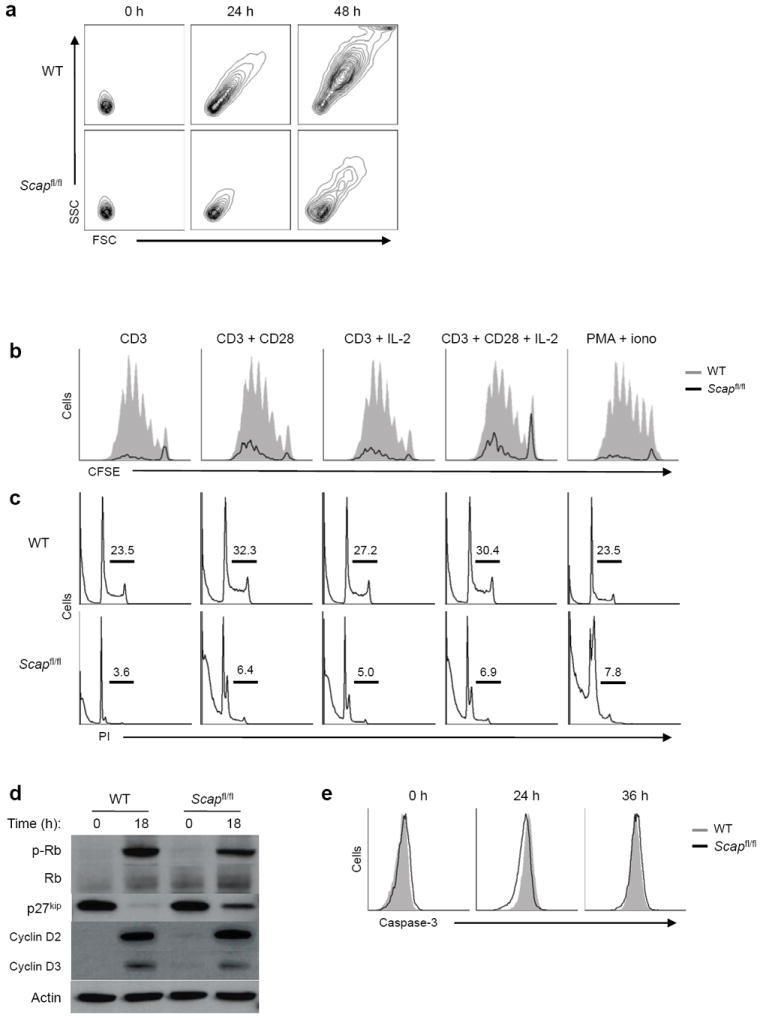
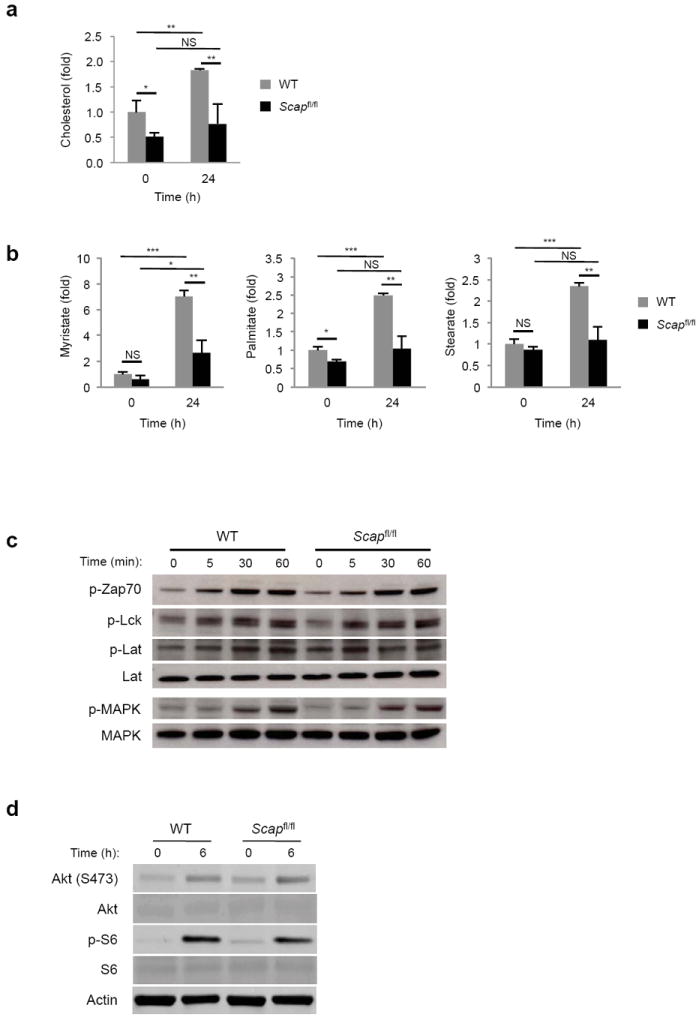
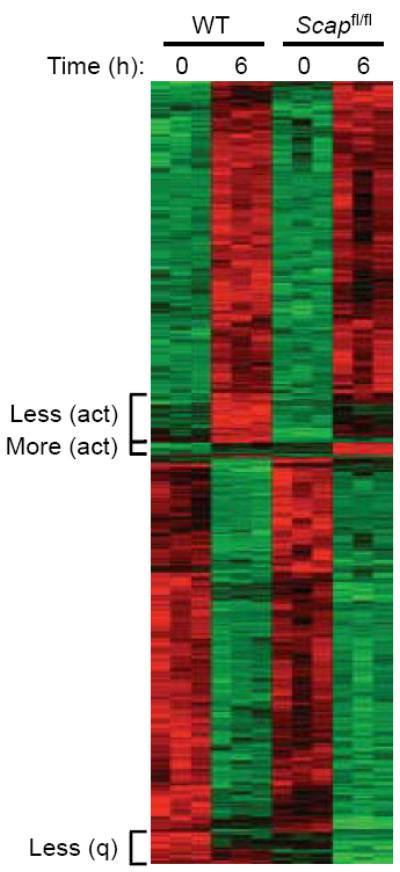
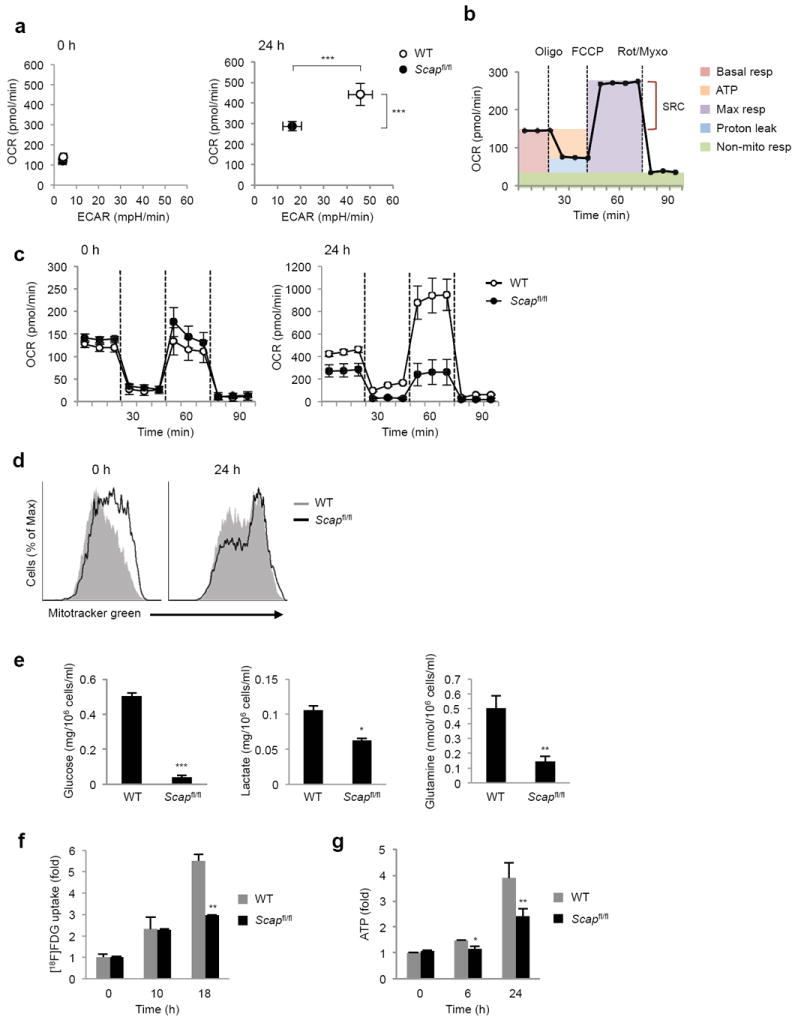
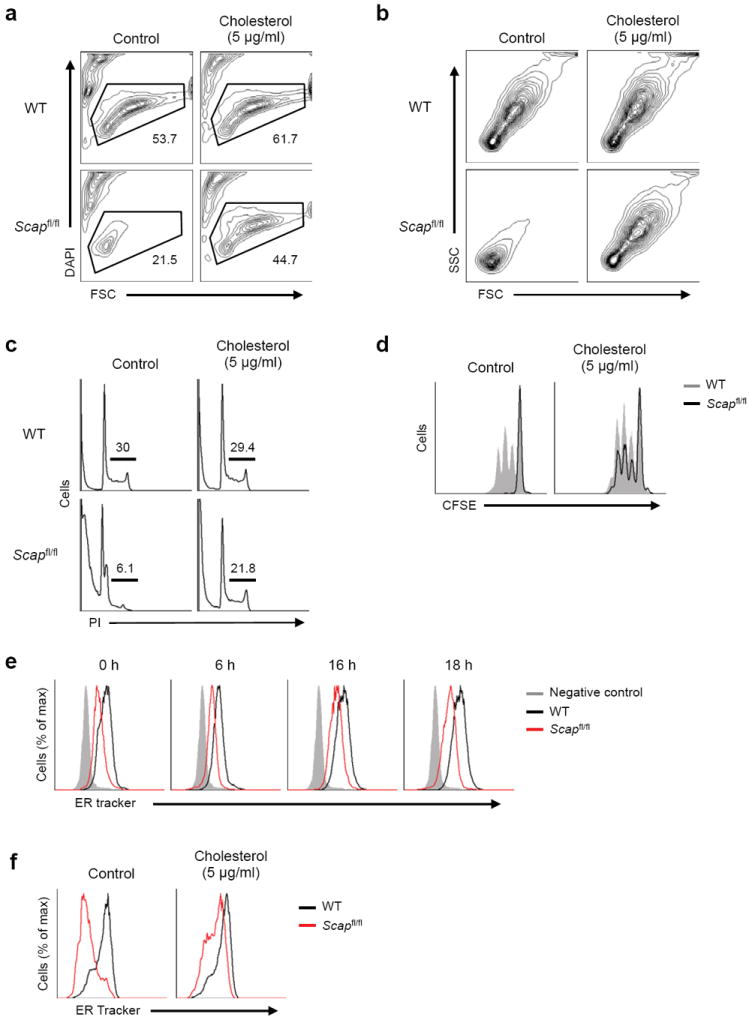
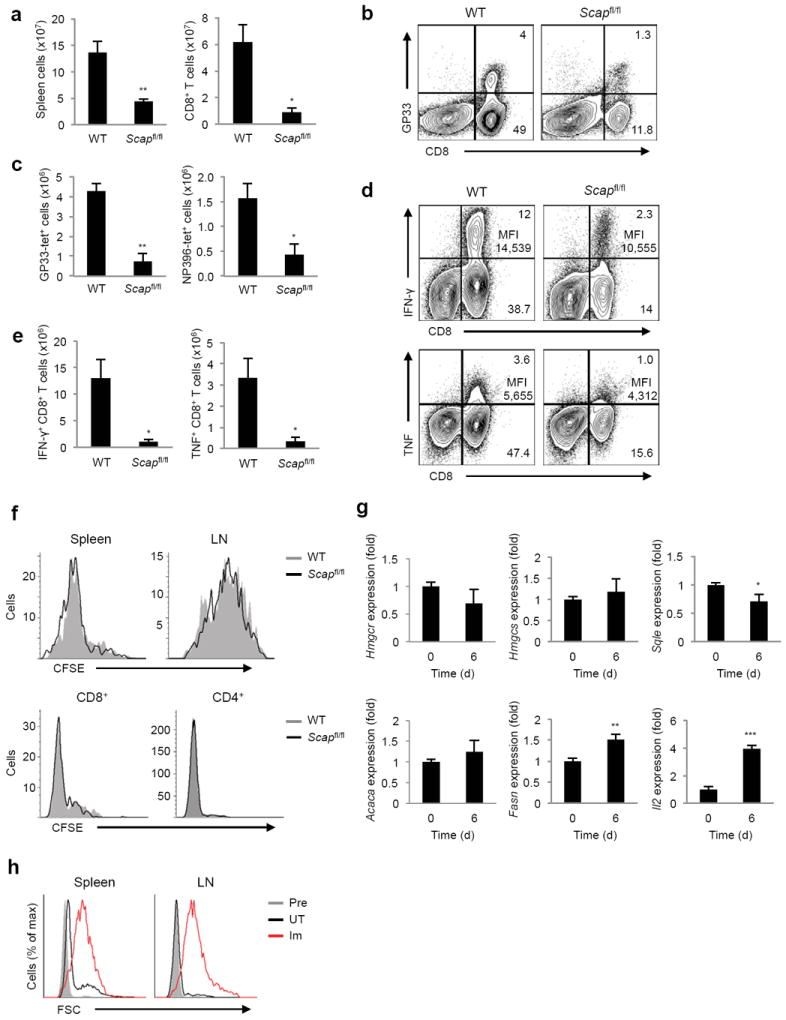
Newly activated CD8(+) T cells reprogram their metabolism to meet the extraordinary biosynthetic demands of clonal expansion; however, the signals that mediate metabolic reprogramming remain poorly defined. Here we demonstrate an essential role for sterol regulatory element-binding proteins (SREBPs) in the acquisition of effector-cell metabolism. Without SREBP signaling, CD8(+) T cells were unable to blast, which resulted in attenuated clonal expansion during viral infection. Mechanistic studies indicated that SREBPs were essential for meeting the heightened lipid requirements of membrane synthesis during blastogenesis. SREBPs were dispensable for homeostatic proliferation, which indicated a context-specific requirement for SREBPs in effector responses. Our studies provide insights into the molecular signals that underlie the metabolic reprogramming of CD8(+) T cells during the transition from quiescence to activation.


Figures

Figure 1
Figure 1. The lipid biosynthetic program of activated T cells is SREBP-dependent and sensitive to the PI3K-mTOR pathway
(a) Real-time PCR analysis of lipogenic genes from murine spleen and LN T cells activated for 6 h with plate-bound CD3+/-CD28, PMA and ionomycin as indicated. (b) Real-time PCR analysis of quiescent or 6 h activated T cells pretreated for 30 min with PI3K inhibitor LY294002 (10 μM) or mTOR inhibitor rapamycin (100 nM) before activation with CD3-28. (c) Real-time PCR analysis of lipogenic genes in activated T cells transduced with active SREBP (ΔSREBP1a or ΔSREBP2) or empty vector (EV) for 24 h. * denotes comparisons between empty vector and ΔSREBP1a, † denotes comparisons between empty vector and ΔSREBP2. Number of symbols indicates the p value. (d) Real-time PCR analysis of quiescent or T cells transfected with siSREBP1 alone, siSREBP2 alone, siSREBP1 and siSREBP2 or non-target control (siControl) and then activated with PMA-iono for 5 h. * denotes comparisons between siControl and siSREBP1, † denotes comparisons between siControl and siSREBP2, § denotes comparisons between siControl and siSREBP1+2. (e) Chromatin Immunoprecipitation analysis of SREBP1 and SREBP2 at the promoters of indicated genes in splenocytes ex vivo or 4 hours after activation with PMA. In addition, some cultures were pretreated for 30 minutes with rapamycin (100 nM) or 25-hydroxycholesterol (25-HC, 10 μM) before activation. Data is normalized to input and expressed relative to IgG control. Rplp0: non-SREBP target gene control. * Denotes comparisons between vehicle and rapamycin treated samples, † denotes comparisons between vehicle and 25-HC treated samples. Inset: Immunoblot of phospho and total S6 from whole cell lysates to confirm rapamycin function. For all experiments, data are presented as a mean of triplicates with standard deviation, and representative of at least three experiments. *p<0.05, **p<0.01, ***p<0.001 (statistical difference between other experimental groups is also noted by the number of other symbols, two-tailed unpaired Student’s t-test).
Figure 2
Figure 2. Deletion of Scap inhibits SREBP activity but does not affect T cell homeostasis
(a) Total cell number in thymus, spleen and lymph nodes (LN) from Cd4-Cre-Scapfl/fl mice (designated Scapfl/fl herein) and littermate controls (WT). Data is expressed as mean with standard deviation. (b) Flow cytometric analysis of CD4+ and CD8+ T cells in thymus, spleen and LN from Scapfl/fl and littermate control mice. Relative frequency indicated in plots. (c) Real-time PCR analysis of control and Scapfl/fl CD8+ T cells ex vivo or activated for 6 h with anti-CD3-28. (d) Chromatin immunoprecipitation analysis of SREBP1 and SREBP2 at the promoters of indicated genes in T cells ex vivo or 6 hours after activation (anti-CD3-28). Data are normalized to input and plotted relative to IgG control. Rplp0: non-SREBP target gene control. * denotes comparisons between WT T=0 and Scapfl/fl T=0, † denotes comparisons between WT T=6 and Scapfl/fl T=6. Data are mean of triplicates with standard deviation (c,d). *p<0.05, **p<0.01, ***p<0.001 (statistical difference between other experimental groups is also noted by the number of other symbols, two-tailed unpaired Student’s t-test). Data are representative of four independent experiments with three mice per group (a,b), or three independent experiments (c,d).
Figure 3
Figure 3. SREBP activity influences CD8+ T cell growth and proliferation
(a) Forward and side scatter plots of DAPI-negative (live) WT and Scapfl/fl CD8+ T cells activated with anti-CD3-28 for indicated time. (b) CFSE dilution of DAPI negative (live) WT and Scapfl/fl CD8+ T cells activated for 72 hours with indicated mitogens. (c) Flow cytometric analysis of DNA content from WT and Scapfl/fl CD8+ T cells activated for 48 hours with indicated stimuli. Cells were stained for DNA content with propidium iodide. Frequency of S and G2/M phase indicated in plots. (d) Immunoblots of G1 associated cell cycle proteins from whole cell lysates of quiescent or 18 h activated WT and Scapfl/fl CD8+ T cells with anti-CD3-28. (e) Flow cytometric analysis of intracellular cleaved caspase-3 in WT and Scapfl/fl CD8+ T cells activated with anti-CD3-28 for indicated time. Data are representative of three (a), or two (b,c,d,e) independent experiments.
Figure 4
Figure 4. Loss of SREBP signaling impacts lipid homeostasis but does not perturb proximal TCR signaling
(a,b) GC-MS determination of cholesterol (a) or indicated long-chain fatty acid (b) content of control and Scapfl/fl T cells ex vivo or 24 h after activation with anti-CD3-28. Data are normalized to cell numbers and plotted relative to control ex vivo (WT 0 h). Data is expressed as mean of triplicates with standard deviations. (c) Immunoblot analysis of WT and Scapfl/fl lymphocytes ex vivo or after stimulation with 1 μg/ml of soluble anti-CD3e for the indicated time. Whole cell lysates were blotted for indicated total and phosphorylated proteins. (d) Immunoblot analysis of the Akt pathway from WT and Scapfl/fl CD8+ T cells ex vivo or after 6 h of activation with anti-CD3-28. NS: not significant, *p<0.05, **p<0.01, ***p<0.001 (two-tailed unpaired Student’s t-test).
Figure 5
Figure 5. SREBP activity influences a transcriptional program related to lipid and RNA metabolism
Heat map of genes expressed in purified quiescent or 6 h stimulated (anti-CD3-28) WT and Scapfl/fl CD8+ T cells (all changes in gene expression met criteria of p<0.001 to be considered as significant). Less (act): less induced in activated Scapfl/fl CD8+ T cells. More (act): more induced in activated Scapfl/fl CD8+ T cells. Less (q): less induced in quiescent Scapfl/fl CD8+ T cells.
Figure 6
Figure 6. SREBP signaling is required for metabolic reprograming of activated CD8+ T cells
(a) Basal oxygen consumption rate (OCR) and extracellular acidification rate (ECAR) of quiescent and 24 h stimulated WT and Scapfl/fl CD8+ T cells. (b) A schematic of OCR in basal condition and in response to sequential treatment with oligomycin (oligo: ATPase inhibitor), FCCP (uncoupling agent) and rotenone-myxothiazol (Rot-Myxo: electron transport chain inhibitor). Basal resp: basal respiration, ATP: ATP production, Max resp: maximal respiration, Non-mito resp: non-mitochondrial respiration, SRC: spare respiratory capacity (c) OCR of 24 h activated WT and Scapfl/fl CD8+ T cells in basal state and in response to sequential treatment with oligomycin, FCCP and rotenone-myxothiazol. (d) Mitotracker staining of WT and Scapfl/fl CD8+ T cells ex vivo and after 24h of activation with anti-CD3-28. (e) Glucose and glutamine consumption, and lactate production measurement in spent media from activated WT and Scapfl/fl CD8+ T cell activated for 24 h with anti-CD3-28. (f) 2-deoxy-2-(18F)fluoro-D-glucose (FDG) uptake assay. CD8+ T cells were activated with anti-CD3-28 for indicated time. Cultures were pulsed with [18F]FDG for 60 min before analysis. (g) Cellular ATP levels in quiescent, 6 or 24 h activated WT and Scapfl/fl CD8+ T cells (anti-CD3-28). Data are mean of triplicates with standard deviation and representative of two (c) or three (d) independent experiments. *p<0.05, **p<0.01, ***p<0.001 (two-tailed unpaired Student’s t-test).
Figure 7
Figure 7. Addition of cholesterol rescues growth and proliferation impairment of Scap-deficient CD8+ T cells
(a) Viability of WT and Scapfl/fl CD8+ T cell activated with anti-CD3-28 for 48 h with or without 5 μg/ml of MβCD conjugated cholesterol in 10% FBS supplemented media. DAPI-negative (live) cell populations are gated and the frequencies are indicated in plots. (b) Forward and side scatter plots of DAPI-negative (live) WT and Scapfl/fl CD8+ T cell activated with anti-CD3-28 for 48 h with or without 5 μg/ml of MβCD-cholesterol in 10% FBS supplemented media. (c) Flow cytometric analysis of DNA content from WT and Scapfl/fl CD8+ T cells activated for 48 hours with or without 5 μg/ml of MβCD-cholesterol in 10% FBS supplemented media. Cells were stained for DNA content with propidium iodide. Frequency of S and G2/M phase indicated in plots. (d) CFSE dilution of DAPI negative (live) WT and Scapfl/fl CD8+ T cells activated for 48 hours with or without 5 μg/ml of MβCD-cholesterol in 10% FBS supplemented media. (e) ER-tracker staining of WT and Scapfl/fl CD8+ T cells ex vivo or after activation with anti-CD3-28 for indicated time. (f) ER-tracker staining of WT and Scapfl/fl CD8+ T cells activated for 48 hours with or without 5 μg/ml of MβCD-cholesterol in 10% FBS supplemented media.
Figure 8
Figure 8. Loss of SREBP activity impairs clonal expansion of antigen specific effector CD8+ T cells, but does not perturb homeostatic proliferation
(a) Absolute numbers of splenocytes and CD8+ T cells from spleen harvested on day 8 of LCMV Armstrong (Arm) infection. (b) Frequency of DbGP33-tetramer specific CD8+ T cells from spleen harvested on day 8 of LCMV-Arm infection. Frequency of cells marked in quadrants of FACS plots. (c) Absolute numbers of CD8+DbGP33-tetramer+ cells and CD8+NP396-tetramer+ cells from spleen harvested on day 8 of LCMV-Arm infection. (d,e) Frequency (d) and absolute number (e) of IFN-γ or TNF producing WT and Scapfl/fl CD8+ T cells harvested on day 8 of LCMV-Arm infection and stimulated with GP33-peptide for 5h in vitro. Frequency and mean fluorescent intensity (MFI) of cytokine producing CD8+ T cells indicated in right upper quadrant of FACS plots. (f) CFSE dilution gated on Thy1.2+ CD8+(top), and CD3+CD4+or CD3+CD8+ (bottom) cells on day 6 after adoptive transfer into RAG-deficient Thy1.1+ mice (top) or irradiated littermate WT mice (bottom). (g) Real-time PCR analysis of Thy1.1+ T cells adoptively transferred into RAG-deficient Thy1.2+ mice and sorted from spleens and LNs after 6 days. (h) Forward scatter plots of OT-I cells. Cells were adoptively transferred into RAG-deficient mice and either left untreated (UT) or immunized (Im) with OVA/IFA subcutaneously. Twenty-four hours later, cells from spleens and LNs were stained as described in Methods and analyzed on flow cytometry. Pre: pre-transfer. *p<0.05, **p<0.01 (two-tailed unpaired Student’s t-test).

Similar articles

Cited by

References

    1. Kim JW, Dang CV. Cancer’s molecular sweet tooth and the Warburg effect. Cancer Res. 2006;66:8927–8930. - PubMed
    1. Fox CJ, Hammerman PS, Thompson CB. Fuel feeds function: energy metabolism and the T-cell response. Nature reviews. Immunology. 2005;5:844–852. - PubMed
    1. Maciver NJ, et al. Glucose metabolism in lymphocytes is a regulated process with significant effects on immune cell function and survival. J Leukoc Biol. 2008;84:949–957. - PMC - PubMed
    1. Chen HW, Heiniger HJ, Kandutsch AA. Relationship between sterol synthesis and DNA synthesis in phytohemagglutinin-stimulated mouse lymphocytes. Proceedings of the National Academy of Sciences of the United States of America. 1975;72:1950–1954. - PMC - PubMed
    1. Rathmell JC, Elstrom RL, Cinalli RM, Thompson CB. Activated Akt promotes increased resting T cell size, CD28-independent T cell growth, and development of autoimmunity and lymphoma. European journal of immunology. 2003;33:2223–2232. - PubMed

Publication types

MeSH terms

Substances

Associated data