

Regulation of ENaC in mice lacking renal insulin receptors in the collecting duct
- PMID: 23558339
- PMCID: PMC3688749
- DOI: 10.1096/fj.12-223792
Regulation of ENaC in mice lacking renal insulin receptors in the collecting duct
Abstract
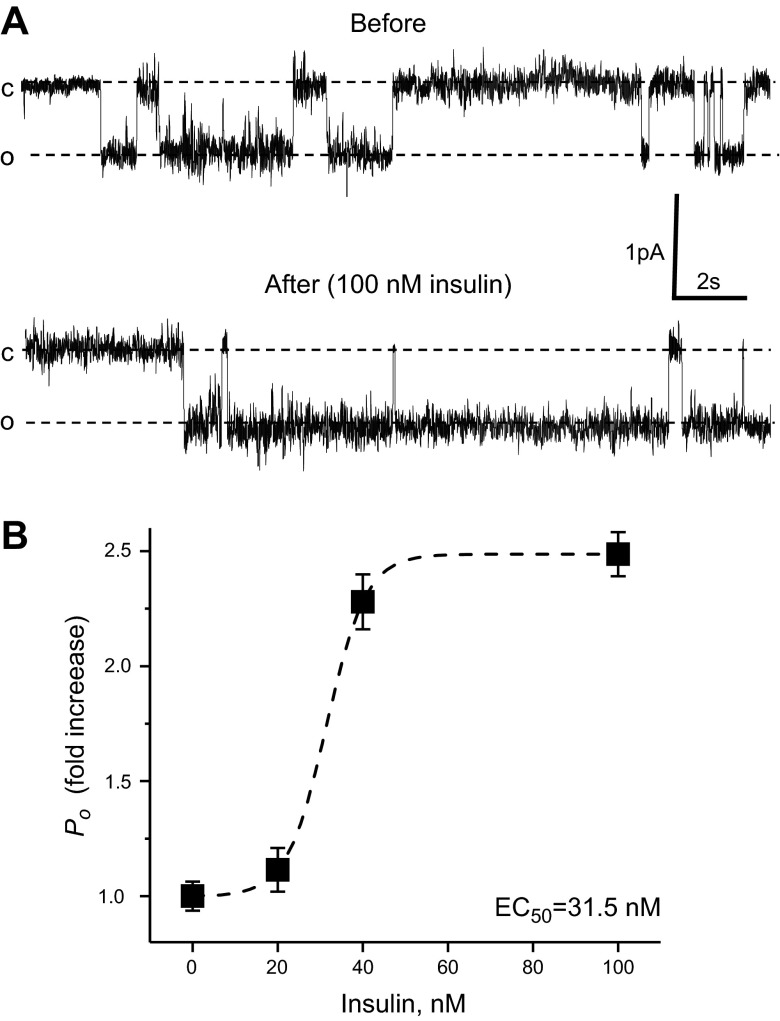
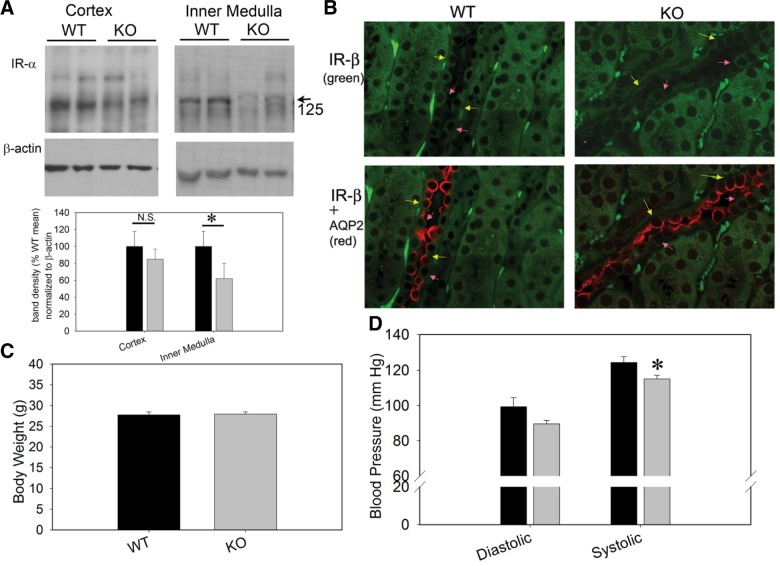
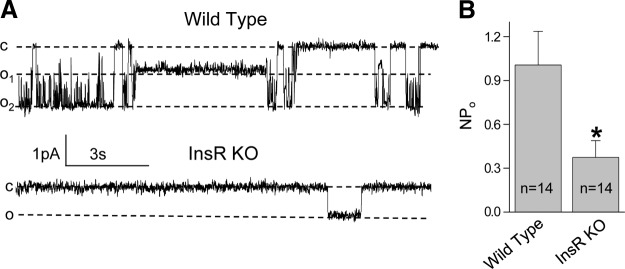
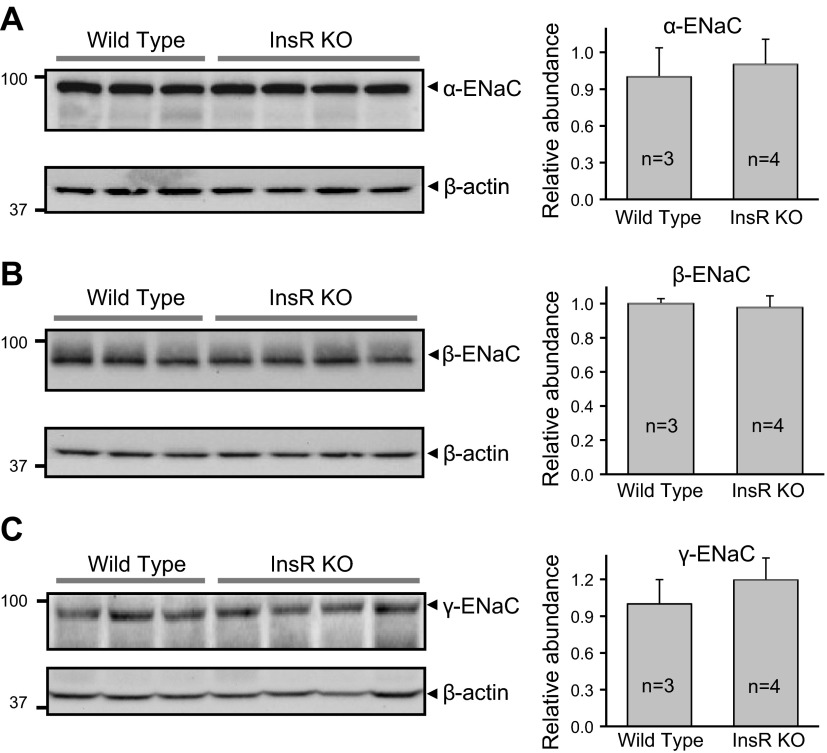
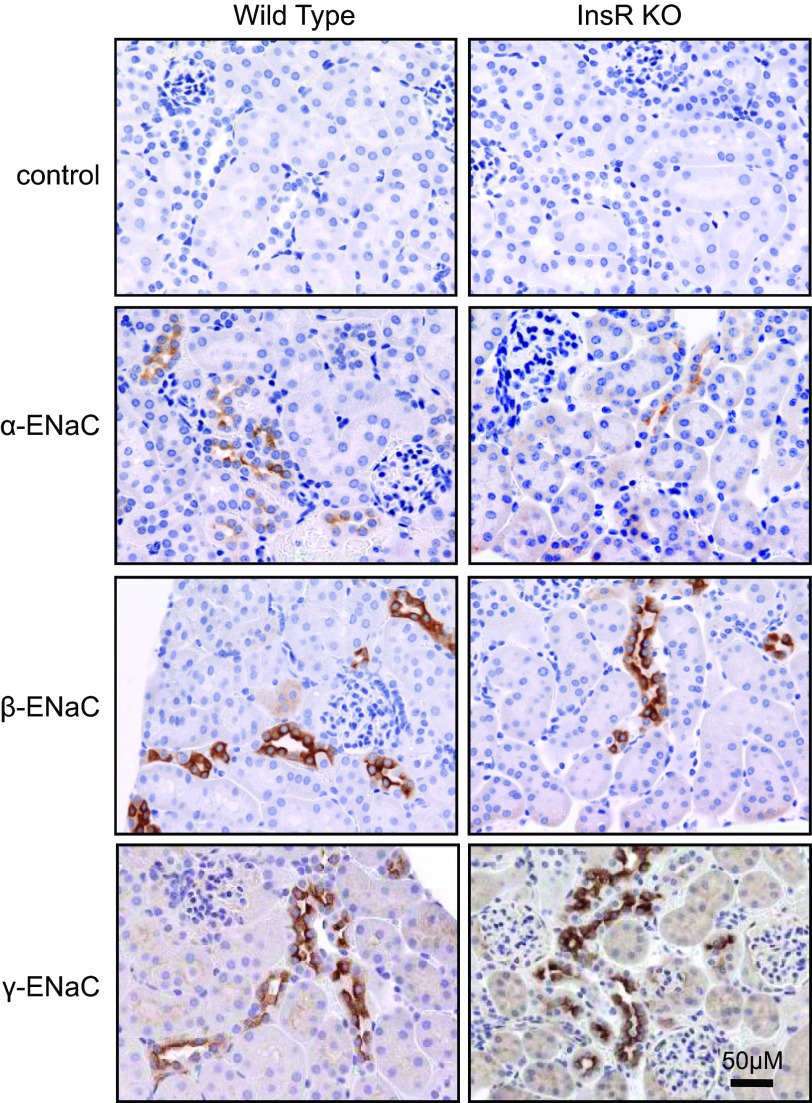
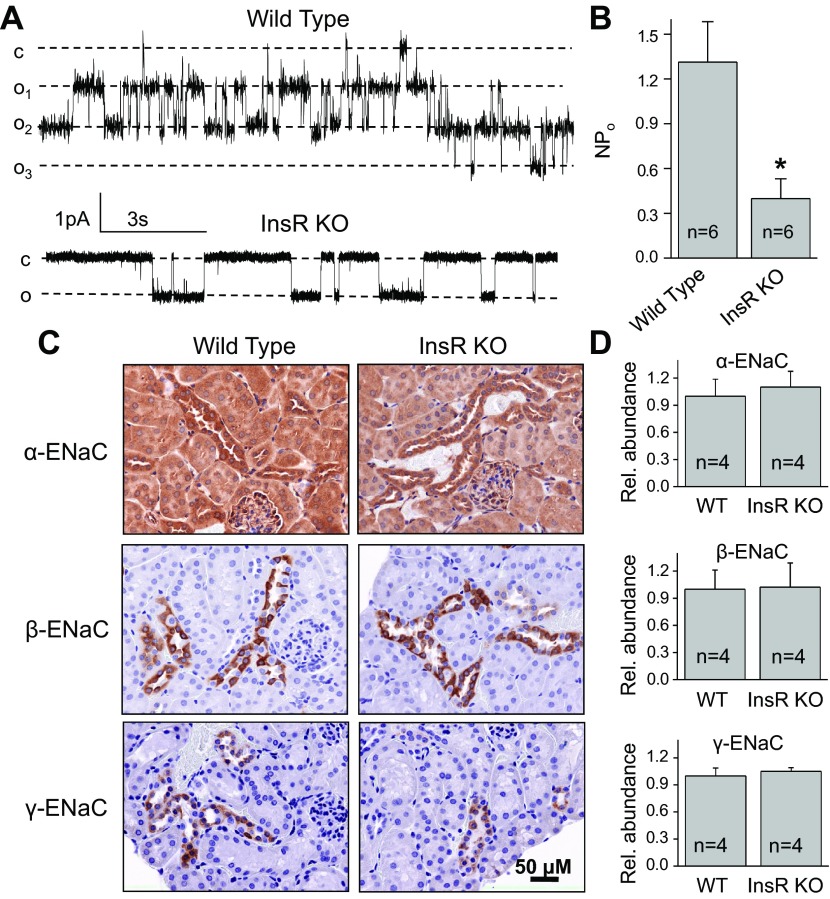
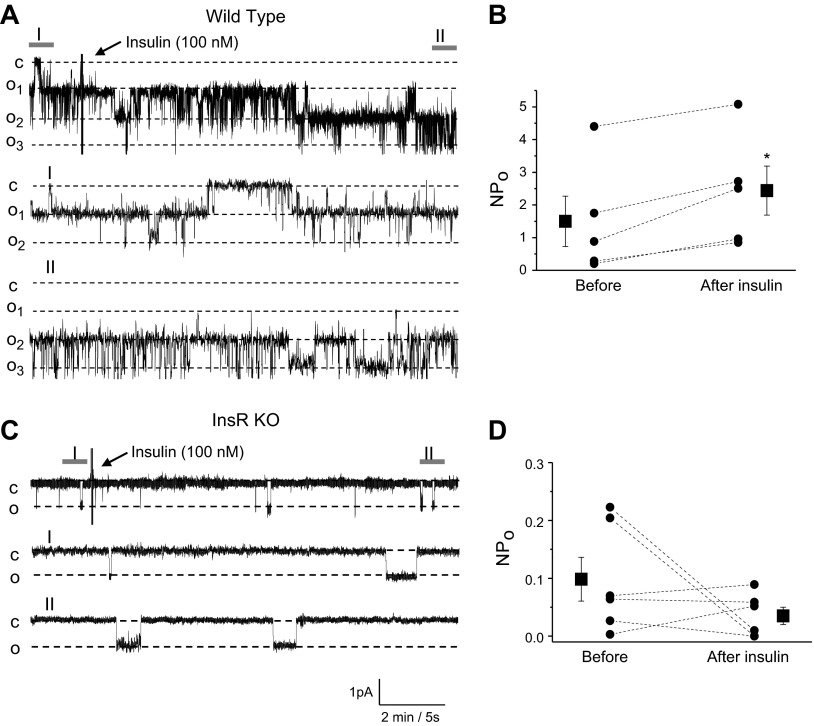
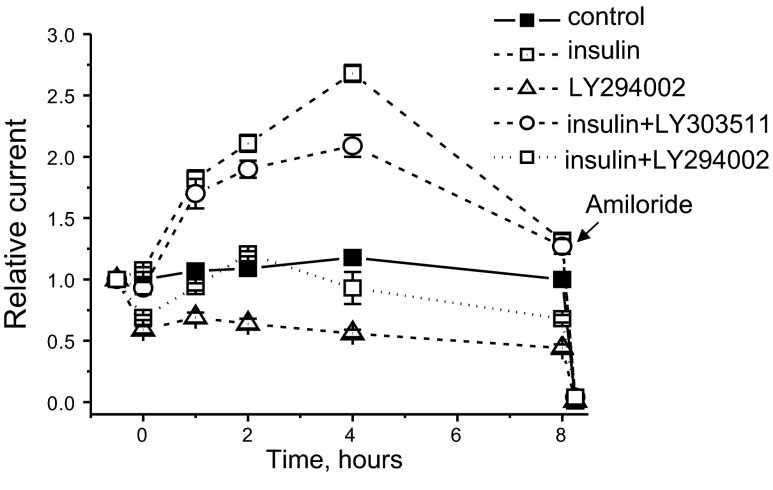
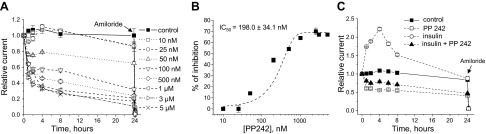
The epithelial sodium channel (ENaC) is one of the central effectors involved in regulation of salt and water homeostasis in the kidney. To study mechanisms of ENaC regulation, we generated knockout mice lacking the insulin receptor (InsR KO) specifically in the collecting duct principal cells. Single-channel analysis in freshly isolated split-open tubules demonstrated that the InsR-KO mice have significantly lower ENaC activity compared to their wild-type (C57BL/6J) littermates when animals were fed either normal or sodium-deficient diets. Immunohistochemical and Western blot assays demonstrated no significant changes in expression of ENaC subunits in InsR-KO mice compared to wild-type littermates. Insulin treatment caused greater ENaC activity in split-open tubules isolated from wild-type mice but did not have this effect in the InsR-KO mice. Thus, these results suggest that insulin increases ENaC activity via its own receptor affecting the channel open probability. To further determine the mechanism of the action of insulin on ENaC, we used mouse mpkCCDc14 principal cells. Insulin significantly augmented amiloride-sensitive transepithelial flux in these cells. Pretreatment of the mpkCCDc14 cells with phosphatidylinositol 3-kinase (LY294002; 10 μM) or mTOR (PP242; 100 nM) inhibitors precluded this effect. This study provides new information about the importance of insulin receptors expressed in collecting duct principal cells for ENaC activity.
Keywords: aldosterone-sensitive distal nephron; kidney; mTOR.
Figures
Similar articles
-
Acute regulation of the epithelial Na+ channel by phosphatidylinositide 3-OH kinase signaling in native collecting duct principal cells.J Am Soc Nephrol. 2007 Jun;18(6):1652-61. doi: 10.1681/ASN.2007010020. Epub 2007 Apr 18. J Am Soc Nephrol. 2007. PMID: 17442787
-
EGF and its related growth factors mediate sodium transport in mpkCCDc14 cells via ErbB2 (neu/HER-2) receptor.J Cell Physiol. 2010 Apr;223(1):252-9. doi: 10.1002/jcp.22033. J Cell Physiol. 2010. PMID: 20049896
-
mTORC2 regulates renal tubule sodium uptake by promoting ENaC activity.J Clin Invest. 2015 Jan;125(1):117-28. doi: 10.1172/JCI73935. Epub 2014 Nov 21. J Clin Invest. 2015. PMID: 25415435 Free PMC article.
-
Regulated sodium transport in the renal connecting tubule (CNT) via the epithelial sodium channel (ENaC).Pflugers Arch. 2009 May;458(1):111-35. doi: 10.1007/s00424-009-0656-0. Epub 2009 Mar 11. Pflugers Arch. 2009. PMID: 19277701 Review.
-
Collecting duct principal cell transport processes and their regulation.Clin J Am Soc Nephrol. 2015 Jan 7;10(1):135-46. doi: 10.2215/CJN.05760513. Epub 2014 May 29. Clin J Am Soc Nephrol. 2015. PMID: 24875192 Free PMC article. Review.
Cited by
-
Hydrogen peroxide (H2O2) mediated activation of mTORC2 increases intracellular Na+ concentration in the renal medullary thick ascending limb of Henle.Sci Rep. 2021 Mar 31;11(1):7300. doi: 10.1038/s41598-021-86678-1. Sci Rep. 2021. PMID: 33790341 Free PMC article.
-
Cross-talk between insulin and IGF-1 receptors in the cortical collecting duct principal cells: implication for ENaC-mediated Na+ reabsorption.Am J Physiol Renal Physiol. 2015 Apr 1;308(7):F713-9. doi: 10.1152/ajprenal.00081.2014. Epub 2015 Jan 28. Am J Physiol Renal Physiol. 2015. PMID: 25651558 Free PMC article.
-
Sex Modulates Response to Renal-Tubule-Targeted Insulin Receptor Deletion in Mice.Int J Mol Sci. 2023 Apr 29;24(9):8056. doi: 10.3390/ijms24098056. Int J Mol Sci. 2023. PMID: 37175762 Free PMC article.
-
Postprandial Effects on ENaC-Mediated Sodium Absorption.Sci Rep. 2019 Mar 12;9(1):4296. doi: 10.1038/s41598-019-40639-x. Sci Rep. 2019. PMID: 30862903 Free PMC article.
-
Salt-Sensitivity of Blood Pressure and Insulin Resistance.Front Physiol. 2021 Dec 13;12:793924. doi: 10.3389/fphys.2021.793924. eCollection 2021. Front Physiol. 2021. PMID: 34966295 Free PMC article. Review.
References
-
- Guan Y., Hao C., Cha D. R., Rao R., Lu W., Kohan D. E., Magnuson M. A., Redha R., Zhang Y., Breyer M. D. (2005) Thiazolidinediones expand body fluid volume through PPARgamma stimulation of ENaC-mediated renal salt absorption. Nat. Med. 11, 861–866 - PubMed
-
- Kotchen T. A., Zhang H. Y., Covelli M., Blehschmidt N. (1991) Insulin resistance and blood pressure in Dahl rats and in one-kidney, one-clip hypertensive rats. Am. J. Physiol. 261, E692–E697 - PubMed
-
- Tiwari S., Riazi S., Ecelbarger C. A. (2007) Insulin's impact on renal sodium transport and blood pressure in health, obesity, and diabetes. Am. J. Physiol. Renal Physiol. 293, F974–F984 - PubMed
Publication types
MeSH terms
Substances
Grants and funding
LinkOut - more resources
Full Text Sources
Other Literature Sources
Molecular Biology Databases
Research Materials
Miscellaneous
