Dysregulated RasGRP1 responds to cytokine receptor input in T cell leukemogenesis
- PMID: 23532335
- PMCID: PMC3737252
- DOI: 10.1126/scisignal.2003848
Dysregulated RasGRP1 responds to cytokine receptor input in T cell leukemogenesis
Abstract
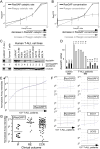
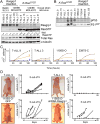
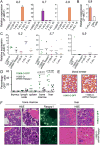
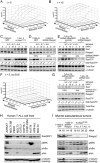
Enhanced signaling by the small guanosine triphosphatase Ras is common in T cell acute lymphoblastic leukemia/lymphoma (T-ALL), but the underlying mechanisms are unclear. We identified the guanine nucleotide exchange factor RasGRP1 (Rasgrp1 in mice) as a Ras activator that contributes to leukemogenesis. We found increased RasGRP1 expression in many pediatric T-ALL patients, which is not observed in rare early T cell precursor T-ALL patients with KRAS and NRAS mutations, such as K-Ras(G12D). Leukemia screens in wild-type mice, but not in mice expressing the mutant K-Ras(G12D) that encodes a constitutively active Ras, yielded frequent retroviral insertions that led to increased Rasgrp1 expression. Rasgrp1 and oncogenic K-Ras(G12D) promoted T-ALL through distinct mechanisms. In K-Ras(G12D) T-ALLs, enhanced Ras activation had to be uncoupled from cell cycle arrest to promote cell proliferation. In mouse T-ALL cells with increased Rasgrp1 expression, we found that Rasgrp1 contributed to a previously uncharacterized cytokine receptor-activated Ras pathway that stimulated the proliferation of T-ALL cells in vivo, which was accompanied by dynamic patterns of activation of effector kinases downstream of Ras in individual T-ALLs. Reduction of Rasgrp1 abundance reduced cytokine-stimulated Ras signaling and decreased the proliferation of T-ALL in vivo. The position of RasGRP1 downstream of cytokine receptors as well as the different clinical outcomes that we observed as a function of RasGRP1 abundance make RasGRP1 an attractive future stratification marker for T-ALL.
Conflict of interest statement
Figures


Comment in
-
Biochemical heterogeneity and developmental varieties in T-cell leukemia.Cell Cycle. 2013 May 15;12(10):1480-1. doi: 10.4161/cc.24858. Epub 2013 Apr 29. Cell Cycle. 2013. PMID: 23652920 Free PMC article. No abstract available.
Similar articles
-
Multiomics analysis reveals the involvement of NET1 in tumour immune regulation and malignant progression.Sci Rep. 2025 Jan 2;15(1):56. doi: 10.1038/s41598-024-83714-8. Sci Rep. 2025. PMID: 39747410 Free PMC article.
-
Depressing time: Waiting, melancholia, and the psychoanalytic practice of care.In: Kirtsoglou E, Simpson B, editors. The Time of Anthropology: Studies of Contemporary Chronopolitics. Abingdon: Routledge; 2020. Chapter 5. In: Kirtsoglou E, Simpson B, editors. The Time of Anthropology: Studies of Contemporary Chronopolitics. Abingdon: Routledge; 2020. Chapter 5. PMID: 36137063 Free Books & Documents. Review.
-
Enabling Systemic Identification and Functionality Profiling for Cdc42 Homeostatic Modulators.bioRxiv [Preprint]. 2024 Jan 8:2024.01.05.574351. doi: 10.1101/2024.01.05.574351. bioRxiv. 2024. Update in: Commun Chem. 2024 Nov 19;7(1):271. doi: 10.1038/s42004-024-01352-7 PMID: 38260445 Free PMC article. Updated. Preprint.
-
Impact of residual disease as a prognostic factor for survival in women with advanced epithelial ovarian cancer after primary surgery.Cochrane Database Syst Rev. 2022 Sep 26;9(9):CD015048. doi: 10.1002/14651858.CD015048.pub2. Cochrane Database Syst Rev. 2022. PMID: 36161421 Free PMC article. Review.
-
Defining the optimum strategy for identifying adults and children with coeliac disease: systematic review and economic modelling.Health Technol Assess. 2022 Oct;26(44):1-310. doi: 10.3310/ZUCE8371. Health Technol Assess. 2022. PMID: 36321689 Free PMC article.
Cited by
-
Therapeutic Targeting of mTOR in T-Cell Acute Lymphoblastic Leukemia: An Update.Int J Mol Sci. 2018 Jun 26;19(7):1878. doi: 10.3390/ijms19071878. Int J Mol Sci. 2018. PMID: 29949919 Free PMC article. Review.
-
Comprehensive functional characterization of cancer-testis antigens defines obligate participation in multiple hallmarks of cancer.Nat Commun. 2015 Nov 16;6:8840. doi: 10.1038/ncomms9840. Nat Commun. 2015. PMID: 26567849 Free PMC article.
-
Regulation of the Small GTPase Ras and Its Relevance to Human Disease.Methods Mol Biol. 2021;2262:19-43. doi: 10.1007/978-1-0716-1190-6_2. Methods Mol Biol. 2021. PMID: 33977469 Review.
-
mTOR and other effector kinase signals that impact T cell function and activity.Immunol Rev. 2019 Sep;291(1):134-153. doi: 10.1111/imr.12796. Immunol Rev. 2019. PMID: 31402496 Free PMC article. Review.
-
Abnormal RasGRP1 Expression in the Post-Mortem Brain and Blood Serum of Schizophrenia Patients.Biomolecules. 2022 Feb 18;12(2):328. doi: 10.3390/biom12020328. Biomolecules. 2022. PMID: 35204828 Free PMC article.
References
-
- Pui CH, Relling MV, Downing JR. Acute lymphoblastic leukemia. The New England journal of medicine. 2004;350:1535–1548. - PubMed
-
- Pui CH, Evans WE. Treatment of acute lymphoblastic leukemia. The New England journal of medicine. 2006;354:166–178. - PubMed
-
- Bhatia S, Sather HN, Pabustan OB, Trigg ME, Gaynon PS, Robison LL. Low incidence of second neoplasms among children diagnosed with acute lymphoblastic leukemia after 1983. Blood. 2002;99:4257–4264. - PubMed
-
- Graux C, Cools J, Michaux L, Vandenberghe P, Hagemeijer A. Cytogenetics and molecular genetics of T-cell acute lymphoblastic leukemia: from thymocyte to lymphoblast. Leukemia. 2006;20:1496–1510. - PubMed
-
- Armstrong SA, Look AT. Molecular genetics of acute lymphoblastic leukemia. J Clin Oncol. 2005;23:6306–6315. - PubMed
Publication types
MeSH terms
Substances
Grants and funding
- P01 AI091580/AI/NIAID NIH HHS/United States
- R01 CA114589/CA/NCI NIH HHS/United States
- UL1 TR001449/TR/NCATS NIH HHS/United States
- U54 CA143874/CA/NCI NIH HHS/United States
- U54CA143874/CA/NCI NIH HHS/United States
- R37 CA072614/CA/NCI NIH HHS/United States
- K99CA157950/CA/NCI NIH HHS/United States
- UL1 TR000041/TR/NCATS NIH HHS/United States
- R01 5CA114589-07/CA/NCI NIH HHS/United States
- T32 CA128583/CA/NCI NIH HHS/United States
- K99 CA157950/CA/NCI NIH HHS/United States
- R37CA72614/CA/NCI NIH HHS/United States
- R01 AI041570/AI/NIAID NIH HHS/United States
- T32 CA108462/CA/NCI NIH HHS/United States
- R01AI041570/AI/NIAID NIH HHS/United States
LinkOut - more resources
Full Text Sources
Other Literature Sources
Miscellaneous

