. 2013 May;23(5):812-25.
doi: 10.1101/gr.146886.112. Epub 2013 Mar 21.

Widespread and extensive lengthening of 3' UTRs in the mammalian brain

Affiliations

Widespread and extensive lengthening of 3' UTRs in the mammalian brain

Pedro Miura et al. Genome Res. 2013 May.

Abstract

Remarkable advances in techniques for gene expression profiling have radically changed our knowledge of the transcriptome. Recently, the mammalian brain was reported to express many long intergenic noncoding (lincRNAs) from loci downstream from protein-coding genes. Our experimental tests failed to validate specific accumulation of lincRNA transcripts, and instead revealed strongly distal 3' UTRs generated by alternative cleavage and polyadenylation (APA). With this perspective in mind, we analyzed deep mammalian RNA-seq data using conservative criteria, and identified 2035 mouse and 1847 human genes that utilize substantially distal novel 3' UTRs. Each of these extends at least 500 bases past the most distal 3' termini available in Ensembl v65, and collectively they add 6.6 Mb and 5.1 Mb to the mRNA space of mouse and human, respectively. Extensive Northern analyses validated stable accumulation of distal APA isoforms, including transcripts bearing exceptionally long 3' UTRs (many >10 kb and some >18 kb in length). The Northern data further illustrate that the extensions we annotated were not due to unprocessed transcriptional run-off events. Global tissue comparisons revealed that APA events yielding these extensions were most prevalent in the mouse and human brain. Finally, these extensions collectively contain thousands of conserved miRNA binding sites, and these are strongly enriched for many well-studied neural miRNAs. Altogether, these new 3' UTR annotations greatly expand the scope of post-transcriptional regulatory networks in mammals, and have particular impact on the central nervous system.


Figures
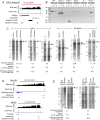
Figure 1.
Figure 1.
Evidence that annotated lincRNAs downstream from protein-coding gene pairs are 3′ UTR extensions. (A) Experimental strategy to test connectivity between a protein-coding gene and a downstream lincRNA. RNA-seq and polyA-seq evidence in the vicinity of eIF2C3 (also known as Ago3) and the proposed lincRNA AK047638. We designed primers to amplify bridge rt-PCR products and Northern probes, as shown. (B) Bridge rt-PCR using adult cerebral cortex RNA connects many protein-coding genes with their proposed downstream neighboring lincRNAs (Ponjavic et al. 2009); note Ar was previously referred to as Adr, and Ube2k was termed Hip2. Note that AK045737 was proposed to be a pair with Ube2k (Ponjavic et al. 2009); however, stranded RNA-seq data revealed that AK045737 is continuous with a spliced exon of Pds5a transcribed from the other strand (see Supplemental Figure S1A–C). (C) Northern analysis demonstrates that the predominant transcripts detected by probes for the protein-coding loci assayed in B are codetected by probes against their neighboring downstream lincRNAs. Conversely, we did not detect stable transcripts corresponding to the sizes of the annotated lincRNAs. Northern blots are also shown for ncRNAs described by Mattick and colleagues (Clark et al. 2012) and their protein-coding pairs Etv1 and Paqr9. (D) RNA-seq and PolyA-Seq tracks for cases of annotated lincRNAs that appear to be contained with exceptionally long, continuous 3′ UTRs of stable mRNAs. (E) Northern blots for proposed lincRNAs show a band of exceptional length that is of the same molecular weight as the bands identified by probes corresponding to the upstream protein-coding transcripts. Arrowheads identify dominant bands that correspond to size estimates based on RNA-seq data. Note that the sizes of the bands on the Northern blot are consistent with the RNA-seq evidence–based size estimates. Asterisks denote 28S and 18S ribosomal bands corresponding to 4.7 kb and 1.9 kb, respectively. Ladder information can be found in Supplemental Figure S4. For RNA-seq tracks, probe locations, and gene annotations, see Supplemental Figure S1D.
Figure 2.
Figure 2.
Reevaluation of mouse and human RNA-seq data reveals abundant 3′ UTR extensions. (A, left) Box plot comparing aggregate Ensembl v65 3′ UTR lengths (longest annotation per terminal exon) and those Ensembl v65 3′ UTRs that were specifically extended in this study. (Right) Histogram of the same data to highlight the abundance of newly annotated long 3′ UTRs. (B) Analyses similar to A, except plotting known and novel Ensembl v65 human 3′ UTRs. (C) Northern analysis validates the stable accumulation of many transcripts utilizing very distal polyadenylation signals in cerebellum or cortex, in several cases yielding 3′ UTRs >10 kb in length. Green arrowheads indicate predicted mRNA length of Ensembl v65 gene model. Red arrowheads indicate inferred mRNA lengths of novel 3′ UTR extension isoforms. Asterisks denote background hybridization to ribosomal RNAs.
Figure 3.
Figure 3.
Sequence and conservation features of known and novel 3′ termini. All analyses in this figure concern those mouse (top graphs) and human (bottom graphs) genes whose 3′ UTRs were confidently extended in this study. These comprise 691 Ensembl65 mouse gene models for which we precisely annotate 741 novel 3′ termini in one or more tissues, and 697 Ensembl65 human genes for which we precisely annotate 816 novel 3′ termini in one or more tissues. (A,B) Motif frequency in 50-nt bins in the vicinity of annotated 3′ termini. Motifs are listed at bottom, and include the downstream U/GU-rich region that promotes 3′ cleavage, the canonical PAS AAUAAA and its most common variant AUUAAA, a panel of low-frequency PAS variants, and genomically encoded hexa-A tracts. As expected for annotated mouse (A) and human (B) 3′ termini, there is strong positional enrichment of functional PAS upstream of the polyadenylation site and U/GU downstream. The collection of low-frequency PAS variants exhibits a broad background frequency, with mild enrichment at the normal location of canonical PAS. Unexpectedly, we observed enrichment of A6 at annotated 3′ termini, potentially reflecting internal priming events in this collection of curated 3′ termini. (C,D) The frequency and positional specificity of PAS and U/GU motifs in our novel mouse (C) and human (D) 3′ termini are relatively similar to known termini but lack substantial A6 enrichment at transcript ends. (E,F) Analysis of average phastCons scores in the vicinity of known and newly annotated 3′ termini in mouse (E) and human (F) shows that both populations of termini exhibit selective constraint that rises to a peak in the local sequence upstream of 3′ termini, and drops sharply in the downstream sequence. Note also that the aggregate conservation of the last ∼500 nt of proximal 3′ UTR sequences is higher than that of the distal novel 3′ UTR sequences, but the overall level of conservation 3′ of our mouse and human extensions drops to background. (G,H) Analysis of location of polyA-seq tags relative to known and newly annotated 3′ termini shows a similar positional enrichment at transcript 3′ termini. Comparison with a randomly selected set of 3′ ends from these transcripts shows no positional enrichment of polyA-seq tags, indicating that our novel annotations include genuine 3′ ends.
Figure 4.
Figure 4.
Systematic tissue comparisons show that 3′ UTR lengthening occurs preferentially in the brain. (A) Pairwise analysis of tissue-specific preferences of novel mouse 3′ UTR extensions using DEXSeq. Each gene is represented as a single point, such that the relative expression of the 3′ UTR extension between the pair of tissues (indicated at the left of each row and the bottom of each column) is plotted as the Y-coordinate, and the average expression of the 3′ UTR in that pair of tissues is plotted as the X-coordinate. For genes exhibiting a significant (greater than twofold, FDR < 0.01) difference between the two tissues the point is colored red if the relative usage is higher in the tissue indicated at the left of the row and blue if it was higher in the tissue indicated at the bottom of the column; all other 3′ UTRs are shown in gray. We observed a broad tissue-wide trend toward increased expression of lengthened 3′ UTRs in hippocampus, seen as a substantial excess of red points across the top row of tissue comparisons against hippocampus. No particular trend is observed among the other pairwise tissue comparisons. (B) Summary of the pairwise analysis of novel 3′ UTR extensions annotated in mouse. For each tissue, the set of genes that are detected by DEXSeq to have a higher fold expression of an extended 3′ UTR extension compared to at least one other tissue were counted. (C) Summary of DEXSeq tissue comparisons of novel 3′ UTR extensions in human (for all pairwise scatterplots, see also Supplemental Fig. 8). (D) DEXSeq analysis of our novel mouse 3′ UTR extensions, assessed in RNA-seq data from mES/neuron/MEF cells. In the scatterplot, mES data are in blue and differentiated neuron data are in red.
Figure 5.
Figure 5.
Northern analysis validates brain-specific 3′ UTR extensions. (A) Northern analyses that compare universal (proximal) probes with two probes directed against an intermediate and a very distal portion of a 3′ UTR extension. The gene models above show the known and newly recognized 3′ UTR extensions and locations of Northern probes. In all cases, the universal probes detect broadly expressed transcripts bearing short 3′ UTRs as well as longer 3′ UTR isoforms that are specific to cerebellum (CB) and/or cortex, while the extension probes detect exclusively the longer 3′ UTR isoforms in brain. Note that the intermediate probes (extension 1) for Sod2 and Dnajc15 detect intermediate 3′ UTR isoforms that are codetected by their respective universal probes but not by their most distal 3′ UTR probes. Asterisks denote cross-hybridization to abundant rRNA bands. (B) Additional examples of brain-specific distal APA events validated by Northern blots. Northern analysis using universal Northern probes (black bars) designed to detect all 3′ UTR isoforms reveal dominant isoforms used by all tissues examined along with brain-specific long 3′ UTR isoforms. Extension probes (red bars) designed to detect the 3′ UTR extensions reveal expression only in the brain and not in other tissues. Asterisks denote background hybridization to ribosomal RNAs; (CB) cerebellum.
Figure 6.
Figure 6.
In situ hybridization of mouse embryos reveals localization of extended 3′ UTR isoforms in specific brain regions. (A) RNA-seq data for Nedd4l indicate an alternative 4.9-kb-long 3′ UTR isoform that includes a proposed lincRNA AK038898. (B) Northern blotting demonstrates that an AK038898 probe detects the long 3′ UTR isoform of Nedd4l. (C) A Nedd4l universal probe detects expression in both brain and dorsal root ganglia (DRG). (D) A probe directed against the very distal portion of the Nedd4l 3′ UTR extension detects only brain expression. (E) RNA-seq data for Tcf4 indicate the existence of a 3′ UTR extension of the annotated gene model, with preferential expression in hippocampal data. (F) Tissue Northern blot using a distal probe confirms the existence of a discrete band expressed in brain that corresponds to a 3′ UTR extension isoform. (G) In situ hybridization to a probe in the common 3′ coding exon detects Tcf4 predominantly in the CNS and the intervertebral discs; (LV) lateral ventricle. A whole-embryo cross-section is shown at left, and the regions boxed are enlarged at right. (H) The Tcf4 3′ UTR extension probe only detects expression in the brain. (I) RNA-seq data for Rspo3 indicate a candidate 3′ UTR extension, although this level of expression (0.22 FPKM) was below our cutoff for genome-wide calls of 3′ UTR extensions. (J) A universal Rspo3 probe predominantly detects CNS expression in the cortex and hem, as well as PNS expression in the spinal cord, mainly in dorsal root ganglia (DRG). (K) The intermediate Rspo3 extension probe hybridizes specifically to the cortical hem. (L) A probe directed against the very low abundance Rspo3 extension region similarly detects expression in cortical hem.
Figure 7.
Figure 7.
Novel 3′ UTR extensions harbor thousands of functional miRNA target sites. (A) Signal-to-background ratio (S:B) of 7-mers found in the proximal 3′ UTR annotations compared with the novel extended 3′ UTR region annotated in mouse from all tissues analyzed. Note that target sites for several well-characterized neural miRNAs are found among the most well-conserved 7mers in both proximal and novel extended 3′ UTR regions, including miR-124, miR-137, miR-9, let-7, miR-96, and miR-125. Supplemental Figure S10 demonstrates that the signal for neural miRNA seed matches is driven by genes with neural-expressed 3′ UTR extensions. (B) Analysis of seed matches to mammalian-conserved miRNAs, that are present among mouse 3′ UTR extensions that lack companion expression evidence for an orthologous 3′ UTR extension in human (top graph) or that do have such experimental evidence for a human extension (bottom graph). The proportion of conserved miRNA binding sites is much higher among genes with evidence for a conserved 3′ UTR extension. (C) Regions surrounding miRNA target sites located in proximal (in blue) and novel distal 3′ UTR mouse extensions (in red) show enrichment of Ago HITS-CLIP tags over background. The signal:background (S:B) of clip tags at let-7 and miR-124 seed matches is actually higher in the novel 3′ UTR extension regions.

Similar articles

Cited by

References

    1. An JJ, Gharami K, Liao GY, Woo NH, Lau AG, Vanevski F, Torre ER, Jones KR, Feng Y, Lu B, et al. 2008. Distinct role of long 3′ UTR BDNF mRNA in spine morphology and synaptic plasticity in hippocampal neurons. Cell 134: 175–187 - PMC - PubMed
    1. Anders S, Reyes A, Huber W 2012. Detecting differential usage of exons from RNA-seq data. Genome Res 22: 2008–2017 - PMC - PubMed
    1. Andreassi C, Zimmermann C, Mitter R, Fusco S, De Vita S, Saiardi A, Riccio A 2010. An NGF-responsive element targets myo-inositol monophosphatase-1 mRNA to sympathetic neuron axons. Nat Neurosci 13: 291–301 - PubMed
    1. Blaess S, Bodea GO, Kabanova A, Chanet S, Mugniery E, Derouiche A, Stephen D, Joyner AL 2011. Temporal-spatial changes in Sonic Hedgehog expression and signaling reveal different potentials of ventral mesencephalic progenitors to populate distinct ventral midbrain nuclei. Neural Dev 6: 29. - PMC - PubMed
    1. Chi SW, Zang JB, Mele A, Darnell RB 2009. Argonaute HITS-CLIP decodes microRNA–mRNA interaction maps. Nature 460: 479–486 - PMC - PubMed

Publication types

Substances