. 2013;9(3):e1003377.
doi: 10.1371/journal.pgen.1003377. Epub 2013 Mar 14.

Histone deacetylase 2 (HDAC2) regulates chromosome segregation and kinetochore function via H4K16 deacetylation during oocyte maturation in mouse

Affiliations

Histone deacetylase 2 (HDAC2) regulates chromosome segregation and kinetochore function via H4K16 deacetylation during oocyte maturation in mouse

Pengpeng Ma et al. PLoS Genet. 2013.

Abstract

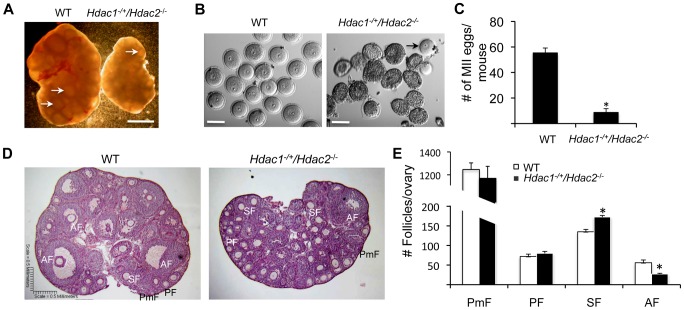
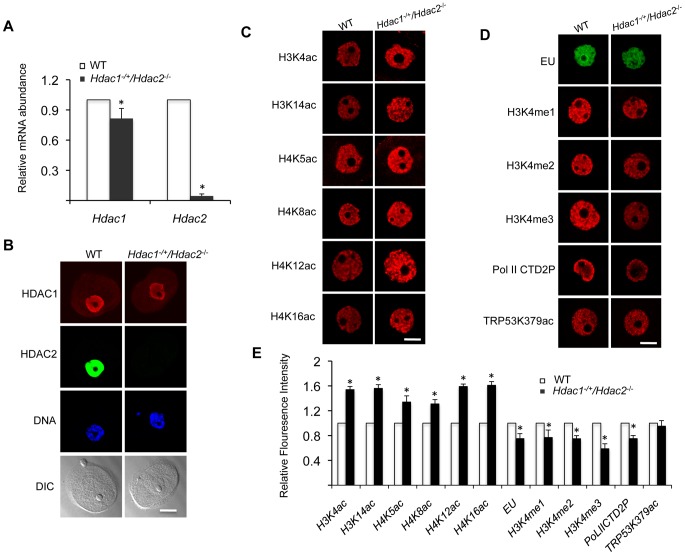
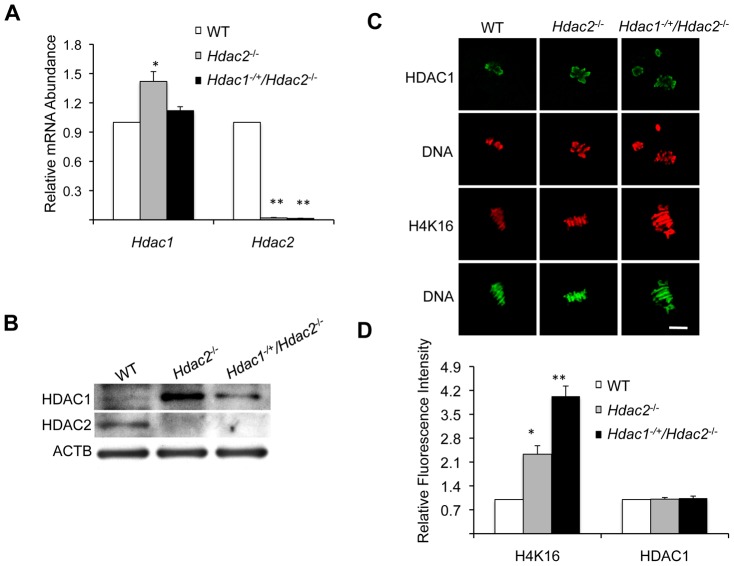
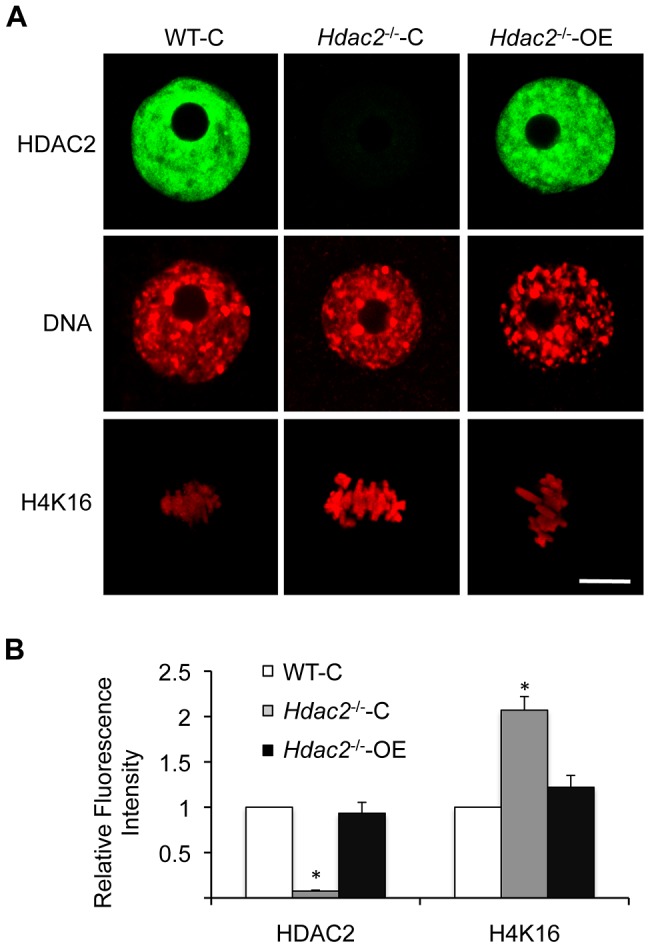
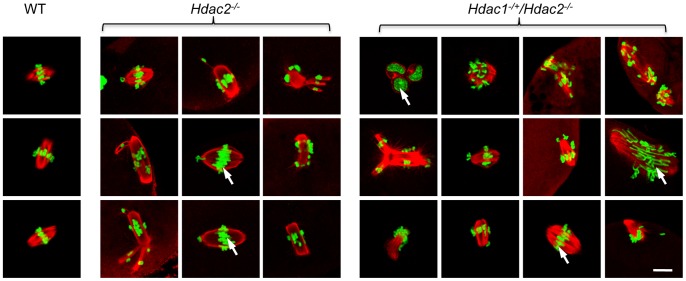
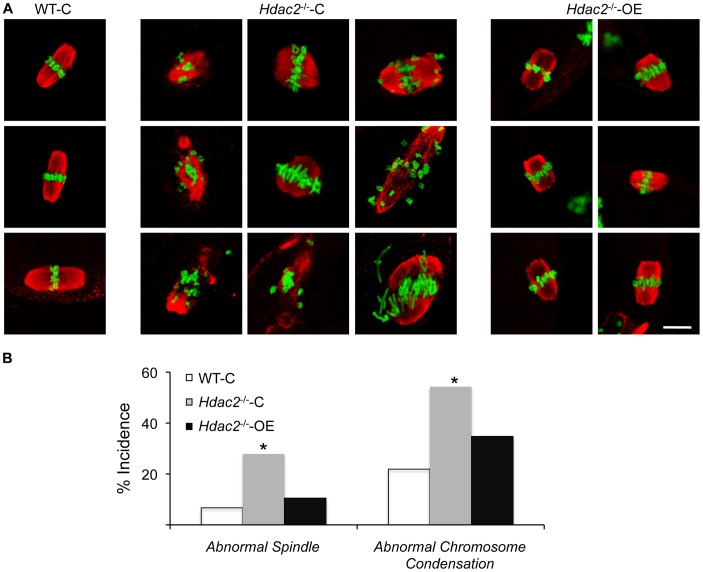
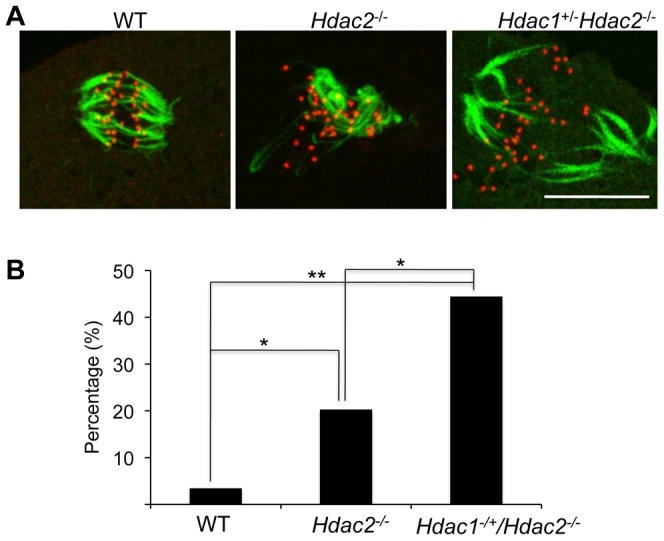
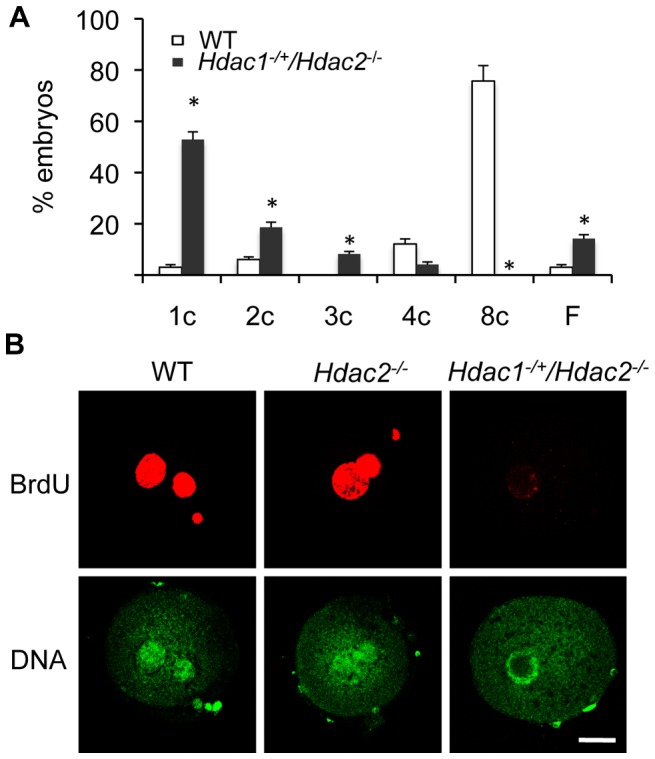
Changes in histone acetylation occur during oocyte development and maturation, but the role of specific histone deacetylases in these processes is poorly defined. We report here that mice harboring Hdac1(-/+)/Hdac2(-/-) or Hdac2(-/-) oocytes are infertile or sub-fertile, respectively. Depleting maternal HDAC2 results in hyperacetylation of H4K16 as determined by immunocytochemistry--normal deacetylation of other lysine residues of histone H3 or H4 is observed--and defective chromosome condensation and segregation during oocyte maturation occurs in a sub-population of oocytes. The resulting increased incidence of aneuploidy likely accounts for the observed sub-fertility of mice harboring Hdac2(-/-) oocytes. The infertility of mice harboring Hdac1(-/+)/Hdac2(-/-)oocytes is attributed to failure of those few eggs that properly mature to metaphase II to initiate DNA replication following fertilization. The increased amount of acetylated H4K16 likely impairs kinetochore function in oocytes lacking HDAC2 because kinetochores in mutant oocytes are less able to form cold-stable microtubule attachments and less CENP-A is located at the centromere. These results implicate HDAC2 as the major HDAC that regulates global histone acetylation during oocyte development and, furthermore, suggest HDAC2 is largely responsible for the deacetylation of H4K16 during maturation. In addition, the results provide additional support that histone deacetylation that occurs during oocyte maturation is critical for proper chromosome segregation.


Conflict of interest statement

The authors have declared that no competing interests exist.

Figures

Figure 1
Figure 1. Decreased ovary size and defective oogenesis following specific targeting of Hdac2 and reduction of Hdac1 in oocytes.
(A) Ovary morphology from WT and Hdac1−/+/Hdac2 −/− mice 6 weeks-of-age. WT ovary shows presence of mature follicles (arrows), whereas fewer of such follicles are present in Hdac1−/+/Hdac2 −/− mice. The bar corresponds to 1 mm. (B) Full-grown oocytes are recovered from WT mice, whereas increased number of immature follicles and only a few oocytes are recovered from Hdac1−/+/Hdac2 −/− mice. The bar corresponds to 100 µm. The arrow points to an oocyte that is nearly full-grown. (C) Fewer eggs are ovulated from Hdac1−/+/Hdac2 −/− mice after hormonal stimulation. WT and Hdac1−/+/Hdac2 −/− 6-week-old females were superovulated with an intraperitoneal injection of 5 I.U eCG followed by administration of 5 I.U. hCG 48 h later. At least 10 mice from each genotype were used, and the average number of ovulated oocytes per female is indicated. * P<0.05. (D) Histological analysis of ovaries obtained from WT and Hdac1−/+/Hdac2 −/− mice18 days-of-age. Primordial (PmF), primary (PF), secondary (SF), and antral follicles (AF) are indicated. The bar corresponds to 0.5 mm. (E) Follicle counts from ovaries obtained from WT and Hdac1−/+/Hdac2 −/− mice 18 days-of-age. Data are from 3 different ovaries and are presented as mean ± SEM. * P<0.05.
Figure 2
Figure 2. Increased histone acetylation, and decreased global transcription and histone H3K4 methylation in Hdac1−/+/Hdac2−/− growing oocytes.
(A) Relative abundance of Hdac1 and Hdac2 transcripts in oocytes obtained from WT and Hdac1−/+/Hdac2−/− mice 12 days-of-age. Data are expressed relative to that in WT oocytes. The experiment was performed four times and the data expressed as mean ± SEM. *, P<0.05. (B) Immunocytochemical detection of HDAC1 and HDAC2 in WT and Hdac1−/+/Hdac2 −/− oocytes obtained from mice 12-days-of-age. Oocytes were stained with an anti-HDAC1 antibody (Red), anti-HDAC2 antibody (Green) and DAPI (to detect DNA, Blue). Transmitted light micrographs are also shown (DIC). The bar corresponds to 20 µm. (C) Different acetylated histones were analyzed by immunocytochemistry using oocytes obtained from WT and Hdac1−/+/Hdac2 −/− mice 12 days-of-age. For each histone variant, at least 20 oocytes for each genotype were analyzed, and the experiment was conducted 3 times. Shown are representative images and only the nucleus is shown. The bar corresponds to 10 µm. (D) Immunocytochemical detection of H3K4 methylation, PolII-CTD-2P, EU and TRP53K379 acethylation in WT and Hdac1−/+/Hdac2 −/− oocytes obtained from mice 12-days-of-age. Shown are representative images and only the nucleus is shown. The bar corresponds to 10 µm. (E) Quantification of the data shown in panel D. Nuclear staining intensity of different proteins in WT oocytes was set to 1 and the data are expressed as mean ± SEM. At least 20 oocytes for each genotype and for each detected protein were analyzed; the experiment was conducted three times. *, p<0.05.
Figure 3
Figure 3. Loss of HDAC1/2 leads to H3K4me1-3 demethylation and up-regulation of KDM5B.
(A) Immunocytochemical detection of H3K4me1, H3K4me2 and H3K4me3 in oocytes obtained from mice 12-days-of-age and lacking different combinations of Hdac1 and Hdac2. For each histone variant, at least 20 oocytes for each genotype were analyzed, and the experiment was conducted 3 times. Shown are representative images and only the nucleus is shown. The bar corresponds to 10 µm. (B) Quantification of the data shown in panel A and relative abundance of Kdm5b mRNA in different genotype oocytes obtained from mice 12-days-of-age. For immunoflurosecence quantification, the nuclear staining intensity of H3K4me1-3 in the WT oocytes was set to 100. The relative abundance of Kdm5b transcript was assayed by qRT-PCR and expressed relative to WT Kdm5b mRNA level that was set as 1. UBF was used as internal control. All data are expressed as mean ± SEM.
Figure 4
Figure 4. Depletion of maternal HDAC2 results in increased histone H4K16 acetylation following oocyte maturation.
(A) Relative abundance of Hdac1 and Hdac2 transcripts in full-grown oocytes obtained from WT, Hdac2−/− and Hdac1−/+/Hdac2−/− mice. Data are expressed relative to that in WT oocytes. The experiment was performed four times and the data expressed as mean ± SEM. *, p<0.05; **, p<0.001. (B) Immunoblot analysis of HDAC1 and HDAC2 expression in WT and mutant full-grown oocytes; total protein was extracted from fully-grown oocytes (180 for HDAC1 and 80 for HDAC2) obtained from WT, Hdac2−/− and Hdac1−/+/Hdac2−/− mice for immunoblotting. The experiment was conducted 3 times, and similar results were obtained in each case. ACTB was used as a loading control. (C) Immunocytochemical detection of HDAC1 and histone H4K16 acetylation in WT, Hdac2−/− and Hdac1−/+/Hdac2 −/− MII eggs; at least 20 oocytes from each genotype were analyzed, and the experiment was conducted 3 times. Shown are representative images and the DNA was stained with Sytox Green (green) or propidium iodide (Red). The bar corresponds to 10 µm. (D) Quantification of the data shown in panel C. Staining intensity of different proteins in WT eggs was set to 1 and the data are expressed as mean ± SEM. At least 20 eggs for each genotype and for each detected protein were analyzed; the experiment was conducted three times. *, p<0.05; **, p<0.001.
Figure 5
Figure 5. Expression of HDAC2 in Hdac2 −/− oocytes restores maturation-associated deacetylation of histone H4K16.
(A) Mutant oocytes were injected with a cRNA (0.4 µg/µl) encoding either Egfp (Hdac2−/−-C) or Hdac2 (Hdac2−/−-OE) and incubated 24 h in CZB containing milrinone to prevent maturation; controls were wild-type oocytes (WT-C). A portion of the cells was removed for immunoctyochemical detection of HDAC2 whereas the other portion was allowed to mature following transfer to milrinone-free medium. The eggs were then processed for immunocytochemical detection of acetylated histone H4K16. At least 8 cells were analyzed in each group. Shown are representative images. DNA was counterstained with propidium iodide. The bars corresponds to 10 µm. (B) Quantification of the relative amount of acetylated histone H4K16. The data are expressed as mean ± SEM. *, p<0.01.
Figure 6
Figure 6. Loss of maternal HDAC2 causes defective chromosome condensation and congression in MII eggs.
Spindle morphology in WT, Hdac2−/− and Hdac1−/+/Hdac2−/− MII eggs. MII eggs were fixed and stained with anti-TUBB antibody (red); DNA was counterstained with Sytox green. Representative images are shown. The bar corresponds to 10 µm.
Figure 7
Figure 7. Expression of HDAC2 in Hdac2−/− oocytes restores normal chromosome condensation and spindle formation in MII eggs.
(A) Spindle morphology and chromosome alignment in MII eggs. Mutant oocytes were injected with a cRNA (0.4 µg/µl) encoding either Egfp (Hdac2−/−-C) or Hdac2 (Hdac2−/−-OE) and incubated 24 h in CZB containing milrinone to prevent maturation; controls were wild-type oocytes injected with Egfp cRNA (WT- C). The oocytes were allowed to mature following transfer to milrinone-free medium overnight. MII eggs were fixed and stained with ß-tubulin antibody (red); DNA was counterstained with Sytox green (green). Shown are representative images. The bar corresponds to 10 µm. (B) Frequency of abnormal spindles and abnormal chromosome condensation in WT-C, Hdac2−/−-C and Hdac2−/−-OE MII eggs. 104 WT-C eggs, 104 Hdac2−/−-C eggs and 76 Hdac2−/−-OE eggs were analyzed respectively. *, p<0.05, χ2.
Figure 8
Figure 8. Loss of maternal HDAC2 impairs kinetochore-microtubule attachment in MI oocytes.
(A) Full-grown oocytes from WT, Hdac2−/− and Hdac1−/+/Hdac2−/− mice were matured to MI by culturing them in CZB medium for 7 h prior to assaying for the presence of cold-stable microtubules. Kinetochores were detected by immunocytochemistry using CREST autoimmune serum (red) and anti-TUBB antibody (green) was used to detect microtubules. Shown are representative images. The bar corresponds to 10 µm. (B) Frequency of abnormal spindles and impaired kinetochore-microtubules attachment in WT, Hdac2−/−and Hdac1−/+/Hdac2−/− MI oocytes. 58 WT oocytes, 69 Hdac2−/− oocytes and 54 Hdac1−/+/Hdac2−/− oocytes were analyzed respectively. *, p<0.05, **, p<0.01, χ2.
Figure 9
Figure 9. Deletion of maternal Hdac2 leads to reduced CENP-A expression in mouse oocytes.
(A) Immunocytochemical detection of CENP-A in WT, Hdac2−/− and Hdac1−/+/Hdac2−/− full-grown oocytes; at least 20 oocytes from each genotype were analyzed, and the experiment was conducted 2 times. Shown are representative images and DNA was counterstained with Sytox green (green). The bar corresponds to 10 µm. The upper row shows an enlargement of the region in the outlined box. (B) Quantification of the data shown in panel A. Staining intensity of different proteins in WT eggs was set to 1 and the data are expressed as mean ± SEM. Signal intensities relative to WT in Hdac2−/− and Hdac1−/+/Hdac2−/− are 81±4%, and 55±6% respectively. *, p<0.05; **, p<0.01.
Figure 10
Figure 10. Deletion of maternal HDAC2 results in failure to replicate DNA 1-cell embryos.
(A) Embryos derived from Hdac1−/+/Hdac2−/− females crossed to WT males arrest early in development. Results are presented as % embryos (average) ± SEM from 3 independent experiments. Abbreviations: c, cell; F, fragmented. (B) Confocal images of WT, Hdac2−/− and Hdac1−/+/Hdac2−/− 1-cell embryos in which the incorporation of BrdU was detected by immunocytochemistry. Shown are representative images and DNA was counterstained with Sytox green (green). The experiment was conducted twice and at least 12 embryos were analyzed for each group. Only one of the two pronuclei was in the focal plane for the Hdac1 +/−/Hdac2 −/− sample. The bar corresponds to 10 µm.

Similar articles

Cited by

References

    1. Kouzarides T (2007) Chromatin modifications and their function. Cell 128: 693–705. - PubMed
    1. Iizuka M, Smith MM (2003) Functional consequences of histone modifications. Curr Opin Genet Dev 13: 154–160. - PubMed
    1. Jenuwein T, Allis CD (2001) Translating the histone code. Science 293: 1074–1080. - PubMed
    1. de Ruijter AJ, van Gennip AH, Caron HN, Kemp S, van Kuilenburg AB (2003) Histone deacetylases (HDACs): characterization of the classical HDAC family. Biochem J 370: 737–749. - PMC - PubMed
    1. Brunmeir R, Lagger S, Seiser C (2009) Histone deacetylase HDAC1/HDAC2-controlled embryonic development and cell differentiation. Int J Dev Biol 53: 275–289. - PubMed

Publication types