. 2013:4:1611.
doi: 10.1038/ncomms2608.

TRPM2 links oxidative stress to NLRP3 inflammasome activation

Affiliations

TRPM2 links oxidative stress to NLRP3 inflammasome activation

Zhenyu Zhong et al. Nat Commun. 2013.

Abstract

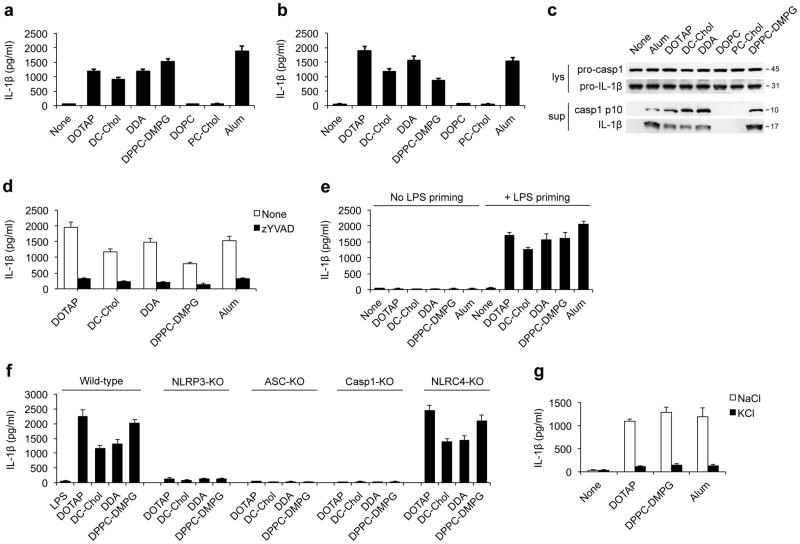
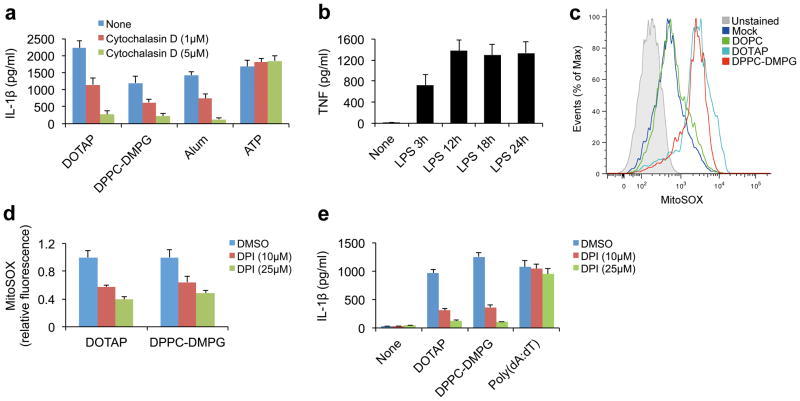
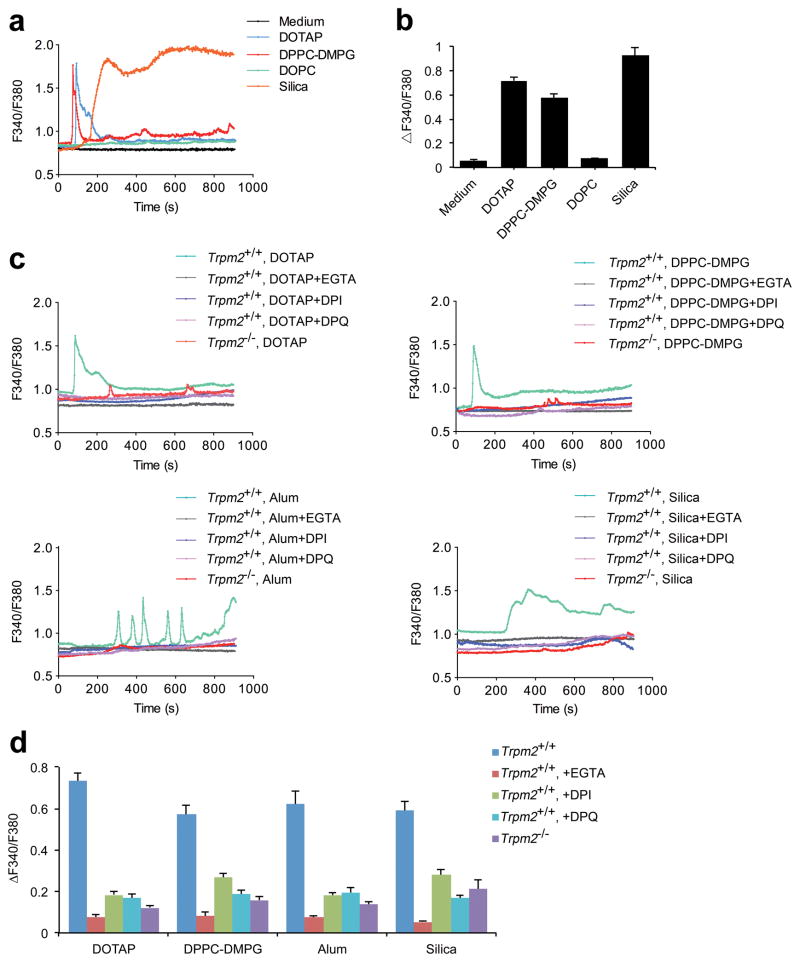
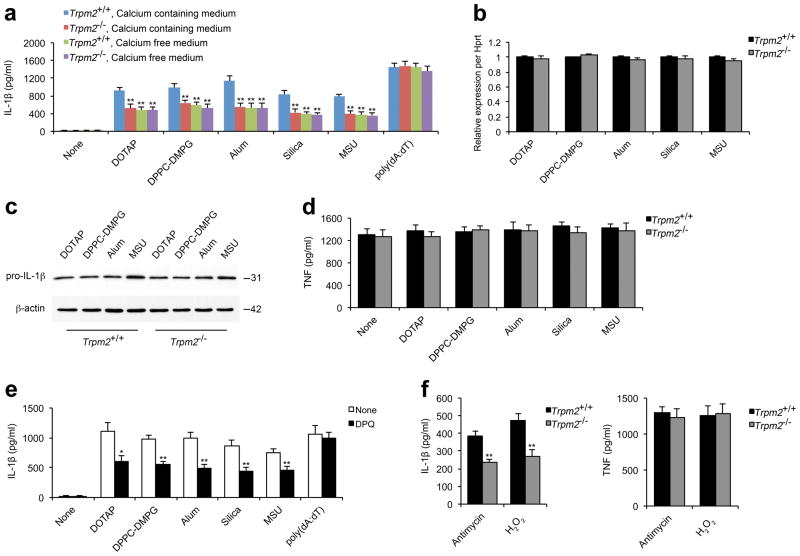
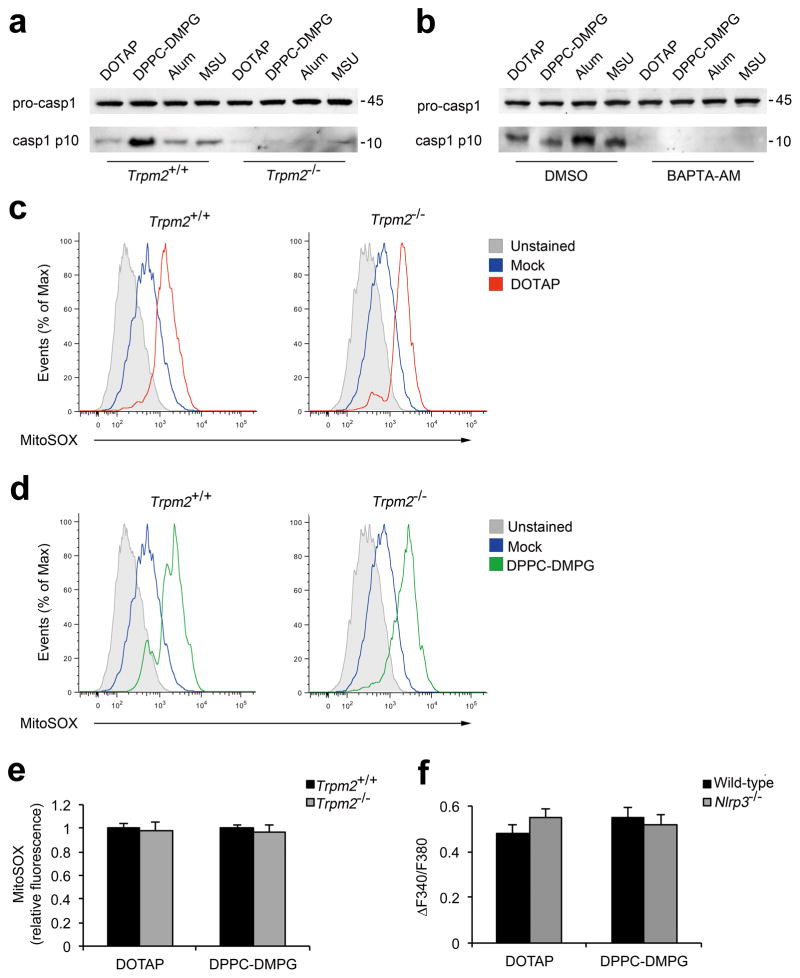
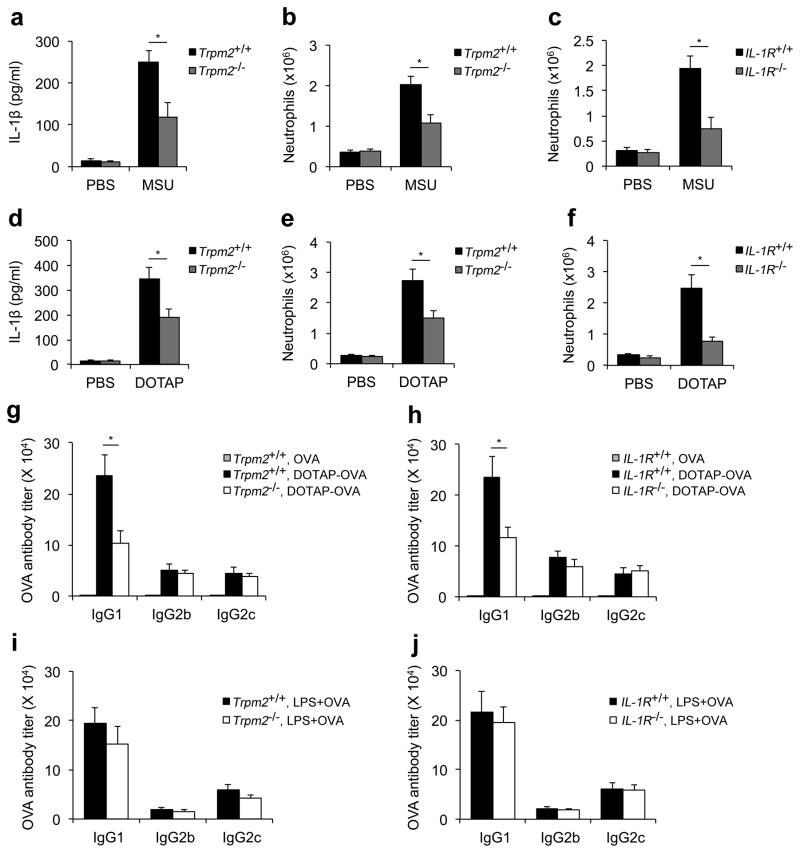
Exposure to particulate crystals can induce oxidative stress in phagocytes, which triggers NLRP3 inflammasome-mediated interleukin-1β secretion to initiate undesirable inflammatory responses that are associated with both autoinflammatory and metabolic diseases. Although mitochondrial reactive oxygen species have a central role in NLRP3 inflammasome activation, how reactive oxygen species signal assembly of the NLRP3 inflammasome remains elusive. Here, we identify liposomes as novel activators of the NLRP3 inflammasome and further demonstrate that liposome-induced inflammasome activation also requires mitochondrial reactive oxygen species. Moreover, we find that stimulation with liposomes/crystals induced reactive oxygen species-dependent calcium influx via the TRPM2 channel and that macrophages deficient in TRPM2 display drastically impaired NLRP3 inflammasome activation and interleukin-1β secretion. Consistently, Trpm2(-/-) mice are resistant to crystal-/liposome-induced interleukin-1β-mediated peritonitis in vivo. Together, these results identify TRPM2 as a key factor that links oxidative stress to the NLRP3 inflammasome activation. Therefore, targeting TRPM2 may be effective for the treatment of NLRP3 inflammasome-associated inflammatory disorders.


Conflict of interest statement

Competing financial interests: The authors declare no competing financial interests.

Figures

Figure 1
Figure 1. Charged liposomes activate the NLRP3 inflammasome to induce IL-1β secretion
ELISA for IL-1β from the supernatants of (a) LPS-primed wild-type BMDMs or (b) PMA-primed THP1 cells that were stimulated with either the indicated liposomes (30 μg/ml for BMDMs and 50 μg/ml for THP1 cells) or alum (250 μg/ml for BMDMs and 500 μg/ml for THP1 cells). (c) Immunoblots of procaspase-1, activated caspase-1 (p10), pro-IL-1β and cleaved IL-1β (p17) in the culture supernatants (Sup) and cell lysates (Lys) from LPS-primed BMDMs after stimulation with indicated liposomes or alum. (d) IL-1β from supernatants of LPS-primed BMDMs that were pretreated with caspase-1 inhibitor (z-YVAD-fmk, 10 μM) for 45 min followed by stimulations with indicated liposomes or alum. (e) ELISA for IL-1β from the supernatants of LPS-primed or unprimed wild-type BMDMs that were stimulated with indicated liposomes (30 μg/ml) or alum (250 μg/ml). (f) The IL-1β levels from the supernatants of LPS-primed immortalized mouse macrophages from wild-type, Nlrp3−/−, Asc−/−, Caspase-1−/− or Nlrc4−/− mice that were stimulated with liposomes (70 μg/ml). (g) ELISA for IL-1β from the supernatants of LPS-primed wild-type BMDMs that were cultured in 150 mM of KCl or NaCl followed by stimulation with liposomes or alum. Data in a, b and dg are shown as mean ± s.d., and all data are representative of at least three independent experiments.
Figure 2
Figure 2. Liposome-induced inflammasome activation requires uptake of liposomes and ROS
(a) IL-1β from the supernatants of PMA-primed THP1 cells that were pretreated with cytochalasin D before stimulation with indicated liposomes (DOTAP liposome 40 μg/ml, DPPC-DMPG liposomes 100 μg/ml), alum (500 μg/ml) or ATP (2 mM). (b) ELISA for TNF from the supernatants of wild-type BMDMs that were stimulated with 100 ng/ml LPS for various periods of time as indicated. (c) Mitochondrial ROS production was measured by flow cytometry in LPS-primed BMDMs that were stimulated with indicated liposomes (30 μg/ml) and labeled with MitoSOX. (d) LPS-primed wild-type BMDMs were pretreated with DPI for 30 min and then stimulated with indicated liposomes (30 μg/ml) for 6 h. The cells were then stained with MitoSOX and the levels of mitochondrial ROS were normalized to the untreated controls (n=3). (e) ELISA for IL-1β from the supernatants of LPS-primed (18 h) BMDMs that were pretreated with DPI before stimulation with indicated liposomes (30 μg/ml) or poly(dA:dT) (2 μg/ml). The data in a, b, d, and e are shown as mean ± s.d., and the data are representative of three (a, b, d, and e) and four (c) independent experiments.
Figure 3
Figure 3. Liposomes and crystals induce ROS-dependent Ca2+ influx via the TRPM2 channel
(a) The change in [Ca2+]i over time was represented by the fluorescence of Fura-2 at 340 nm to that at 380 nm (F340/F380) and (b) the maximum [Ca2+]i elevations, represented by ΔF340/F380, are shown in LPS-primed wild-type BMDMs treated with medium alone, cationic liposomes (DOTAP, 30 μg/ml), neutral liposomes (DOPC, 30 μg/ml), anionic liposomes (DPPC-DMPG, 30 μg/ml) or silica crystals (300 μg/ml). (c) The time-dependent change in [Ca2+]i, represented by F340/F380, in the LPS-primed Trpm2+/+ BMDMs cultured in calcium-containing solution that were pretreated with DPI (25 μM) or DPQ (200 μM) for 45min before the addition of the indicated liposomes (30 μg/ml) or crystals (alum, 400 μg/ml; silica, 300 μg/ml) is shown. The same doses of liposomes or crystals were also used to stimulate the LPS-primed Trpm2−/− BMDMs cultured in calcium-containing solution. The [Ca2+]i change over time, represented by F340/F380, after stimulation with liposomes or crystals in LPS-primed Trpm2+/+ BMDMs cultured in calcium-free 0.5 mM EGTA-containing solution is also shown. Inflammasome agonists were added 1 min after the initiation of calcium recording as shown in a and c. (d) The maximum [Ca2+]i elevations, represented by ΔF340/F380, are shown for LPS-primed BMDMs in response to the stimulations described in (c). The data are representative of at least three independent experiments and are shown as mean ± s.e.m. in b and d (n=22–31 in b, and n=21–34 in d).
Figure 4
Figure 4. Ca2+ influx via TRPM2 is crucial for liposome- or crystal-induced IL-1β secretion
ELISA for IL-1β (a) or TNF (d) from the supernatants of LPS-primed wild-type (Trpm2+/+) or Trpm2−/− BMDMs that were stimulated with indicated liposomes (30 μg/ml), crystals (alum, 250 μg/ml; silica and MSU crystals, 200 μg/ml) or poly(dA:dT) (2 μg/ml) for 6 h in calcium-containing or calcium-free medium. (b) The levels of pro-IL-1β mRNA were quantified by real-time RT-PCR in LPS-primed Trpm2+/+ or Trpm2−/− BMDMs after stimulation with indicated liposomes and crystals as in a. The gene expression data are presented as expression relative to HPRT1, and the relative gene expression levels in wild-type macrophages were designated as 1. (c) Immunoblots for pro-IL-1β and β-actin in the cell lysates from LPS-primed Trpm2+/+ or Trpm2−/− BMDMs after stimulation with liposomes or crystals as in a. (e) IL-1β from the supernatants of LPS-primed wild-type BMDMs that were pretreated with DPQ (200 μM) followed by inflammasome agonist stimulation as in a. (f) IL-1β (left) or TNF (right) from the supernatants of LPS-primed wild-type BMDMs that were stimulated with antimycin A (20 μg/ml) or H2O2 (10 mM) for 6 h. Experiments described in bf were performed in calcium-containing medium. All data are representative of at least three independent experiments, and are shown as mean ± s.d. in a, b, and df. *, p < 0.05, and **, p<0.01 versus controls. Statistical significance was determined by the standard two-tailed Student’s t-test.
Figure 5
Figure 5. TRPM2 directs caspase-1 activation but is dispensable for mitochondrial ROS production
(a) Immunoblots of procaspase-1 in lysates and caspase-1 p10 in culture supernatants of LPS-primed Trpm2+/+ and Trpm2−/−BMDMs that were stimulated with indicated liposomes (30 μg/ml) or crystals (250 μg/ml). (b) Immunoblots of procaspase-1 and caspase-1 p10 in LPS-primed wild-type BMDMs that were preteated with either BAPTA-AM (25 μM) or DMSO before stimulation with the indicated liposomes (50 μg/ml) and crystals (400 μg/ml). One of three independent experiments is shown in a and b. (c–e) LPS-primed Trpm2+/+ or Trpm2−/− BMDMs were treated with indicated liposomes (30 μg/ml) for 6 h. The cells were then stained with MitoSOX and the levels of mitochondrial ROS were measured by flow cytometry (c, d). The data are representative for three experiments and are normalized to the untreated controls (e, n=3). (f) The maximum [Ca2+]i elevations, represented by ΔF340/F380, are shown for LPS-primed immortalized murine wild-type or Nlrp3−/− macrophages in response to stimulation with liposomes (70 μg/ml). The data are shown as mean ± s.e.m. (n=23–28), and are representative of two independent experiments.
Figure 6
Figure 6. TRPM2 is critical for particle-induced IL-1β release and subsequent immune responses in vivo
The IL-1β concentration (a, d) and neutrophil recruitment (b, c, e and f) were quantified in peritoneal lavage fluid from wild-type (Il1rl+/+ and Trpm2+/+), Il1rI−/− or Trpm2−/− mice 6 h after intraperitoneal injection of PBS supplemented with either MSU crystals (ac) or DOTAP liposomes (df). The data are representative of two independent experiments (mean and s.e.m. of three to five mice per group). (gj) Six- to eight-week old female wild-type (Trpm2+/+and Il1rl+/+), Trpm2−/− (g, i) or Il1rl−/−(h, j) mice were subcutaneously immunized on day 0 and day 14 with 40 μg/mouse ovalbumin (OVA) alone or the same amount of OVA encapsulated within DOTAP liposomes (g and h) or mixed with LPS (25 μg/mouse, i and j). On day 24, the mice were sacrificed, and sera were collected and analyzed for OVA-specific IgG1, IgG2b, and IgG2c levels by ELISA. The data are shown as geometrical mean ± s.e.m., and are representative of at least two independent experiments (n=4–5 mice per group). *, p<0.05 versus controls. Statistical significance was determined by the standard two-tailed Student’s t-test.

Similar articles

Cited by

References

    1. Allison AG, Gregoriadis G. Liposomes as immunological adjuvants. Nature. 1974;252:252. - PubMed
    1. Al-Jamal WT, Kostarelos K. Liposomes: from a clinically established drug delivery system to a nanoparticle platform for theranostic nanomedicine. Acc Chem Res. 2011;44:1094–104. - PubMed
    1. Slingerland M, Guchelaar HJ, Gelderblom H. Liposomal drug formulations in cancer therapy: 15 years along the road. Drug Discov Today. 2012;17:160–6. - PubMed
    1. Christensen D, et al. Cationic liposomes as vaccine adjuvants. Expert Rev Vaccines. 2007;6:785–96. - PubMed
    1. Yan W, Chen W, Huang L. Mechanism of adjuvant activity of cationic liposome: phosphorylation of a MAP kinase, ERK and induction of chemokines. Mol Immunol. 2007;44:3672–81. - PubMed

Publication types