. 2013 May 10;288(19):13695-703.
doi: 10.1074/jbc.M112.444745. Epub 2013 Mar 18.

Chiral discrimination and writhe-dependent relaxation mechanism of human topoisomerase IIα

Affiliations

Chiral discrimination and writhe-dependent relaxation mechanism of human topoisomerase IIα

Yeonee Seol et al. J Biol Chem. .

Abstract

Background: Human topoisomerase IIα unlinks catenated chromosomes and preferentially relaxes positive supercoils.

Results: Supercoil chirality, twist density, and tension determine topoisomerase IIα relaxation rate and processivity.

Conclusion: Strand passage rate is determined by the efficiency of transfer segment capture that is modulated by the topoisomerase C-terminal domains.

Significance: Single-molecule measurements reveal the mechanism of chiral discrimination and tension dependence of supercoil relaxation by human topoisomerase IIα. Type IIA topoisomerases (Topo IIA) are essential enzymes that relax DNA supercoils and remove links joining replicated chromosomes. Human topoisomerase IIα (htopo IIα), one of two human isoforms, preferentially relaxes positive supercoils, a feature shared with Escherichia coli topoisomerase IV (Topo IV). The mechanistic basis of this chiral discrimination remains unresolved. To address this important issue, we measured the relaxation of individual supercoiled and "braided" DNA molecules by htopo IIα using a magnetic tweezers-based single-molecule assay. Our study confirmed the chiral discrimination activity of htopo IIα and revealed that the strand passage rate depends on DNA twist, tension on the DNA, and the C-terminal domain (CTD). Similar to Topo IV, chiral discrimination by htopo IIα results from chiral interactions of the CTDs with DNA writhe. In contrast to Topo IV, however, these interactions lead to chiral differences in relaxation rate rather than processivity. Increasing tension or twist disrupts the CTD-DNA interactions with a subsequent loss of chiral discrimination. Together, these results suggest that transfer segment (T-segment) capture is the rate-limiting step in the strand passage cycle. We propose a model for T-segment capture that provides a mechanistic basis for chiral discrimination and provides a coherent explanation for the effects of DNA twist and tension on eukaryotic type IIA topoisomerases.

Keywords: Biophysics; Chiral Discrimination; DNA Replication; DNA Topoisomerase; DNA Topology; Magnetic Tweezers; Single Molecule Biophysics.


Figures

FIGURE 1.
FIGURE 1.
DNA experimental geometry and supercoil relaxation data trace. A, DNA extension as a function of turns (linking number difference, ΔLk). Supercoiling was achieved by rotating a magnetic bead (green) attached to rotationally constrained DNA (blue) (inset graphic). Supercoiling twists the DNA until a buckling transition, past which the DNA twist remains constant, and further rotation of the bead is converted to writhe (plectonemes) that reduces the extension of the bead (49). Thus, DNA twist can be controlled by applied tension because the buckling transition occurs at higher twist density as the tension increases (50). At F = 0.2 pN (red circles), DNA extension decreases symmetrically for both positive and negative turns. At F = 2.0 (green circles), DNA extension decreases only for positive turns as negative turns lead to DNA melting, rather than plectoneme formation. B, a DNA braid is formed by wrapping two DNA molecules tethered to a bead around one another by rotating the bead. At 0.5 turns, the DNA extension (z) decreases sharply by an amount dependent on the distance between the two DNA molecules (ρ) and the length of the DNA (z0). At nbuckle > n > 0.5, the range of bead rotations (n) over which our measurements were made, the extension decreases as: z(n) = √ z02 − (2ρ + 2πR(n − 0.5))2, where R is the effective electrostatic diameter of the DNA molecule (∼11 nm under our conditions) (24, 37). At nbuckle < n (black dashed lines indicate nbuckle), the DNA braid forms a second order plectonemic structure. nbuckle is determined by the condition z(n)/z0 = 1/√(2) (37). C, trace of a htopo IIα supercoil relaxation experiment. Supercoils are introduced by rotating the magnets (pink arrows), and the DNA extension decreases as the DNA buckles and forms plectonemes. DNA extension increases when htopo IIα removes supercoils (green dashed lines). The magnets automatically rotate to reintroduce a fixed number of supercoils when the DNA extension reaches a threshold value (red dashed line), thereby creating a pseudo-infinite substrate for htopo IIα. Twait is defined by the time duration required for htopo IIα to complete N cycles (N is the half of the magnetic turns introduced each time the DNA extension reaches the threshold). The enzyme works processively until it falls off. The processivity was determined by counting the number of cycles completed during a processive burst (red shaded region).
FIGURE 2.
FIGURE 2.
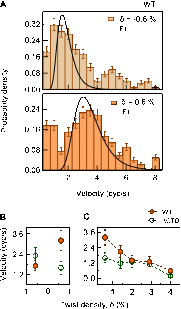
Relaxation rate of positive and negative supercoils by WT and ΔCTD htopo IIα. A, two representative WT htopo IIα relaxation rate distributions. The relaxation rate distributions (bars) were fitted with inverse Gamma distributions (black line, see “Experimental Procedures”) to obtain the mean rates. B, relaxation rates of negative and positive supercoiled DNA at low twist density. WT relaxes positive supercoils ∼2-fold faster than negative supercoils. On the other hand, ΔCTD demonstrates the opposite chiral preference, relaxing negative supercoils ∼1.4-fold faster than positive supercoils. Relaxation rates (cycles × s−1 (cyc/s)) measured for WT are: 1.7 ± 0.3 (δ = −0.6%; number of events, n = 183) and 3.2 ± 0.6 (δ = 0.6%; n = 238). For ΔCTD, relaxation rates are: 2.3 ± 0.5 (δ = −0.6%; n = 228) and 1.6 ± 0.4 (δ = 0.6%; n = 295). C, relaxation rate as a function of positive DNA twist density. The relaxation rates for both WT and ΔCTD decrease as a function of DNA twist density. Relaxation rates (cycles × s−1) measured for WT are: 3.2 ± 0.6 (δ = 0.6%; n = 238), 2.1 ± 0.5 (δ = 1.0%; n = 258), 1.4 ± 0.1 (δ = 2.0%; n = 61), 1.3 ± 0.5 (δ = 2.9%; n = 31), and 0.6 ± 0.1 (δ = 4.0%; n = 24). For ΔCTD, rates are: 1.6 ± 0.4 (δ = 0.6%; n = 300), 1.2 ± 0.4 (δ = 1.0%; n = 173), 1.3 ± 0.5 (δ = 2.0%; n = 87), and 1.2 ± 0.2 (δ = 2.9%; n = 202), and 0.2 ± 0.1 (δ = 4.0%; n = 53). Measurements for all figures are reported as mean ± S.D. of the fit parameters. The average relaxation rates plotted as a function of DNA twist are qualitatively the same and support the same overall conclusions concerning chiral discrimination and the effects of twist on strand passage rates (data not shown).
FIGURE 3.
FIGURE 3.
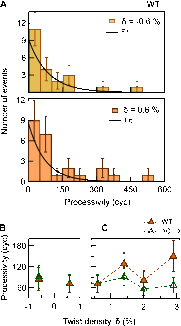
Processivity of WT and ΔCTD htopo IIα. A, two representative processivity distributions for WT htopo IIα. Error bars correspond to the square root of the number of events in each bin. Each distribution was fitted with a single exponential (black line) to obtain the mean processivity. B, comparison of processivity at low negative and positive DNA twist density. Processivity for both htopo IIα enzymes was slightly higher for negative supercoils. WT processivity was: 84 ± 33 (δ = −0.6%; n = 22) and 71 ± 24 (δ = 0.6%; n = 23), whereas ΔCTD processivity was: 91 ± 33 (δ = −0.6%; n = 19) and 71 ± 26 (δ = 0.6%; n = 18). C, processivity plotted as a function of positive DNA twist density. The processivity of the WT enzyme increased slightly with increasing twist density, unlike the processivity of the ΔCTD enzyme that was relatively constant. WT htopo IIα processivity was: 71 ± 24 (δ = 0.6%; n = 23), 128 ± 32 (δ = 1.0%; n = 41), 81 ± 27 (δ = 2.0%; n = 16), and 150 ± 44 (δ = 2.9%; n = 14). ΔCTD processivity was: 71 ± 26 (δ = 0.6%; n = 18), 91 ± 25 (δ = 1.0%; n = 25), 56 ± 18 (δ = 2.0%; n = 16), and 67 ± 22 (δ = 2.9%; n = 18).
FIGURE 4.
FIGURE 4.
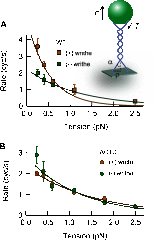
Braided DNA unlinking rate as a function of tension (T) fitted with an energy barrier-crossing model. A, WT htopo IIα unlinking rate for positive (gold squares) and negative (green squares) writhe as a function of applied tension. WT htopo IIα shows preferential unlinking of positive writhe at low tension (0.25 and 0.4 pN). The chiral preference disappears with increasing tension. Relaxation rates (cycles × s−1 (cyc/s)) measured for negative writhe are: 2.0 ± 0.2 (T = 0.25 pN, n = 70), 1.6 ± 0.3 (T = 0.4 pN; n = 40), 1.3 ± 0.1 (T = 0.6 pN; n = 27), 0.9 ± 0.1 (T = 1.1 pN; n = 7), and 0.3 ± 0.1 (T = 2.5 pN; n = 11). Relaxation rates for positive writhe are: 3.6 ± 0.5 (T = 0.25 pN; n = 38), 2.5 ± 0.2 (T = 0.4 pN; n = 63), 1.5 ± 0.1 (T = 0.6 pN; n = 25), 1 ± 0.3 (T = 1.1 pN; n = 5), and 0.3 ± 0.1 (T = 2.5 pN; n = 8). The relaxation rate of negative writhe as a function of tension was fit well with the energy barrier-crossing model but not the relaxation rate of positive writhe due to the chiral preference at low tension: v0positive = 5.2 ± 0.9 s−1, Δpositive = 8.1 ± 1.4 nm, and reduced χ2 = 10.8; v0negative = 2.2 ± 0.2 s−1, Δnegative = 3.5 ± 0.6 nm, and reduced χ2 = 1.9 (see “Results” for description of fit parameters). Inset: graphic (not to scale) of the braided DNA geometry. A magnetic bead (green) is tethered to the surface by two DNA molecules (blue), separated by a distance ρ. As the bead is rotated, the two DNA strands are wrapped around one another, creating writhe with an average juxtaposition angle α. No twist is introduced as rotationally unconstrained DNA molecules are used to form the interlinked braids. B, ΔCTD htopo IIα unlinking rates for positive (gold circle) and negative (green circle) writhe as a function of applied tension. ΔCTD shows a weak preferential unlinking of negative writhe at low tension (< 0.4 pN), which disappears with increasing tension similar to WT. Relaxation rates (cycles × s−1 (cyc/s)) measured for negative writhe are: 2.9 ± 0.4 (T = 0.25 pN, n = 100), 2.1 ± 0.5 (T = 0.4 pN; n = 43), 1.4 ± 0.2 (T = 0.6 pN; n = 67), 1.2 ± 0.1 (T = 1.1 pN; n = 25), 0.6 ± 0.1 (T = 2.5 pN; n = 18), and 0.4 ± 0.1 (T = 2.5 pN; n = 27). Relaxation rates for positive writhe are: 2.0 ± 0.1 (T = 0.25 pN; n = 85), 1.9 ± 0.3 (T = 0.4 pN; n = 50), 1.5 ± 0.2 (T = 0.6 pN; n = 63), 1.1 ± 0.1 (T = 1.1 pN; n = 86), 0.8 ± 0.1 (T = 1.8 pN; n = 23), and 0.4 ± 0.1 (T = 2.5 pN; n = 25). The relaxation rate of positive writhe as a function of tension was slightly better fit with the energy barrier-crossing model than the relaxation rate of negative writhe due to the chiral preference at the low tension: v0positive = 2.4 ± 0.1 s−1, Δpositive = 2.7 ± 0.3 nm, and reduced χ2 = 1.3; v0negative = 2.8 ± 0.3 s−1, Δnegative = 3.4 ± 0.4 nm, and reduced χ2 = 5.6. Error bars indicate mean ± S.D. in all panels.
FIGURE 5.
FIGURE 5.
Proposed model for CTD-dependent chiral discrimination by htopo IIα. A, graphic of the two-gate mechanism. The two-gate mechanism for strand passage by type IIA topoisomerases is well established (, , –10). (0) G-segment DNA (red) is bound at the DNA gate (orange). (i) The binding of ATP closes the N-gate (yellow) and captures a T-segment (green). (ii) G-segment DNA is cleaved, and the T-segment is transferred through the G-segment. (iii) G-segment religation leads to opening of the C-gate and release of the T-segment. The C-terminal domains (light blue) potentially interact with T-segment DNA in a chirality-dependent manner. B, model of chirality-dependent CTD-T-segment DNA interactions (top down view). For positive supercoil relaxation (top panel), in the absence of the CTDs (top left), the T-segment DNA clashes with the N-gate (yellow-colored domain), hindering T-segment capture, whereas when the CTDs are present, the tips of the CTDs play a role in guiding the T-segment and facilitating its capture. Green arrows indicate the direction in which the CTDs reorient the T-segment DNA, facilitating T-segment capture. For negative supercoil relaxation (bottom panel), the G-segment DNA bound to the core domain is favorably oriented for T-segment capture. For WT htopo IIα, on the other hand, the CTDs pose a steric hindrance, shifting the T-segment DNA, resulting in unfavorable crossing geometry for T-segment capture. The local distortions in the DNA plectoneme structure associated with T-segment capture are energetically less favorable as the tension, or twist, in the DNA is increased, resulting in the decrease in strand passage rate.

Similar articles

Cited by

References

    1. Liu L. F., Wang J. C. (1987) Supercoiling of the DNA template during transcription. Proc. Natl. Acad. Sci. U.S.A. 84, 7024–7027 - PMC - PubMed
    1. Champoux J. J. (2001) DNA topoisomerases: structure, function, and mechanism. Annu. Rev. Biochem. 70, 369–413 - PubMed
    1. Deweese J. E., Osheroff N. (2009) The DNA cleavage reaction of topoisomerase II: wolf in sheep's clothing. Nucleic Acids Res. 37, 738–748 - PMC - PubMed
    1. Forterre P., Gribaldo S., Gadelle D., Serre M.-C. (2007) Origin and evolution of DNA topoisomerases. Biochimie 89, 427–446 - PubMed
    1. Schoeffler A. J., Berger J. M. (2008) DNA topoisomerases: harnessing and constraining energy to govern chromosome topology. Q. Rev. Biophys. 41, 41–101 - PubMed

Publication types

LinkOut - more resources