. 2013 May;24(9):1454-68.
doi: 10.1091/mbc.E12-09-0669. Epub 2013 Mar 13.

Sp100A promotes chromatin decondensation at a cytomegalovirus-promoter-regulated transcription site

Affiliations

Sp100A promotes chromatin decondensation at a cytomegalovirus-promoter-regulated transcription site

Alyshia Newhart et al. Mol Biol Cell. 2013 May.

Abstract

Promyelocytic leukemia nuclear bodies (PML-NBs)/nuclear domain 10s (ND10s) are nuclear structures that contain many transcriptional and chromatin regulatory factors. One of these, Sp100, is expressed from a single-copy gene and spliced into four isoforms (A, B, C, and HMG), which differentially regulate transcription. Here we evaluate Sp100 function in single cells using an inducible cytomegalovirus-promoter-regulated transgene, visualized as a chromatinized transcription site. Sp100A is the isoform most strongly recruited to the transgene array, and it significantly increases chromatin decondensation. However, Sp100A cannot overcome Daxx- and α-thalassemia mental retardation, X-linked (ATRX)-mediated transcriptional repression, which indicates that PML-NB/ND10 factors function within a regulatory hierarchy. Sp100A increases and Sp100B, which contains a SAND domain, decreases acetyl-lysine regulatory factor levels at activated sites, suggesting that Sp100 isoforms differentially regulate transcription by modulating lysine acetylation. In contrast to Daxx, ATRX, and PML, Sp100 is recruited to activated arrays in cells expressing the herpes simplex virus type 1 E3 ubiquitin ligase, ICP0, which degrades all Sp100 isoforms except unsumoylated Sp100A. The recruitment Sp100A(K297R), which cannot be sumoylated, further suggests that sumoylation plays an important role in regulating Sp100 isoform levels at transcription sites. This study provides insight into the ways in which viruses may modulate Sp100 to promote their replication cycles.


Figures

FIGURE 1:
FIGURE 1:
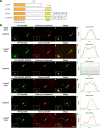
Sp100 is recruited to the CMV promoter of the inducible transgene in the U2OS and HeLa cell lines. (A) Diagram of the inducible transgene drawn to scale. Expression of YFP-lac repressor allows the transgene to be visualized in both the inactive and the active state. Transcription is induced from the minimal CMV promoter by the activators, YFP-tTA-ER or ER-tTA, in the presence of 4-OHT and rtTA in the presence of Dox. The transcribed RNA encodes CFP fused to a peroxisomal targeting signal (SKL). The RNA is visualized by YFP-MS2, which binds to the stem loops in the transcript. The 3′ end of the transcription unit is composed of the intron 2 splicing unit of the rabbit β-globin gene. YFP-tagged regulatory factors can be monitored for recruitment to the array by coexpression with the fluorescently tagged lac repressor and/or activator proteins. All of the factors are shown in YFP-tagged form. However, Cherry- and CFP-tagged versions are also used in different combinations in the assays as described in figures and legends. (B) Immunofluorescence localization of Sp100 at the inactive array, marked by YFP-lac repressor, in (a–d) U2OS (2-6-3) and (e–h) HeLa (HI 1-1) cells. Arrows indicate the location of the transgene array. Yellow lines in enlarged merge insets show the path through which the red, green, and blue intensities were measured in the intensity profiles (d, h). Asterisks mark the start of the measured lines. Scale bar, 5 μm. Scale bars in enlarged inset, 1 μm. (C) Diagram of the transgene showing the location of the primer pairs used for real-time PCR in the Sp100 ChIP assays with chromatin lysates prepared from inactive U2OS (2-6-3) and HeLa (HI 1-1) cell lines. Results are the average of at least three independent experiments. SDs are given in the form of error bars, and p values are calculated using unpaired t test.
FIGURE 2:
FIGURE 2:
Sp100 is enriched at the activated transgene arrays in U2OS and HeLa cells. (A) Immunofluorescence staining of Sp100 at the YFP-tTA-ER–activated transgene array in (a–d) U2OS (2-6-3) cells. (B) Immunofluorescence staining of Sp100 at the CFP-tTA-ER–activated transgene array in (a–d) control and (e–h) YFP-ICP0–expressing HeLa (HI 1-1) cells. YFP-lac repressor (b) is expressed in control cells to identify the array. Arrows indicate the location of the transgene array. Yellow lines in enlarged merged insets show the path through which the red, green, and blue intensities were measured in the intensity profiles (d, h). Asterisks mark the start of the measured lines. Scale bar, 5 μm. Scale bars in enlarged inset, 1 μm. (C) Average pixel areas of the activated arrays in HeLa (HI 1-1) cells (+/−) ICP0 as demarcated by the array-binding proteins. (D) Average intensities (total intensity/transgene array area) of Sp100 at the activated arrays in HeLa (HI 1-1) cells (+/−) ICP0. (E) Total intensity levels of Sp100 at the activated arrays in HeLa (HI 1-1) cells (+/−) ICP0. SDs are given in the form of error bars, and p values are calculated using the unpaired t test; (−) ICP0 (n = 20); (+) ICP0 (n = 28).
FIGURE 3:
FIGURE 3:
Analysis of Sp100 isoform recruitment to inactive and activated transgene arrays in U2OS cells. (A) Diagram of the domain organization of the Sp100 isoforms and the locations of the K297R sumoylation mutation in Sp100A and the W655Q mutation in the SAND domains of Sp100B, C, and HMG. (B) Localization of (a–h) YFP-Sp100A, (i–p) YFP-Sp100A(K297R), and (q–x) YFP-Sp100B at inactive arrays, marked by Cherry-lac repressor, and activated arrays, marked by Cherry-tTA-ER, in U2OS (2-6-3) cells. Arrows indicate the transgene array locations. Yellow lines in enlarged merge insets show the path through which the red and green intensities were measured in the intensity profiles (d, h, l, p, t, and x). Asterisks mark the start of the measured lines. Scale bar, 5 μm. Scale bars in enlarged inset, 1 μm.
FIGURE 4:
FIGURE 4:
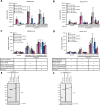
Measurements of Sp100 isoform recruitment and effects on transgene array decondensation in U2OS and HeLa Cells. YFP and YFP-tagged Sp100 isoform intensity levels at transgene arrays in (A) U2OS (2-6-3) and HeLa (HI 1-1) (B) cells. Levels were measured at inactive transgene arrays and transgene arrays activated in the presence and absence of ICP0. Measurements of transgene array pixel area in inactive and transcriptionally activated transgene arrays (+/−) ICP0 in (C) U2OS (2-6-3) and (D) HeLa (HI 1-1) cells expressing YFP and YFP-tagged Sp100 isoforms. SDs are given in the form of error bars, and p values are calculated using unpaired t test and listed in Table 1. Western blots of transiently expressed, YFP-tagged Sp100 isoforms in (E) U2OS (2-6-3) and (F) HeLa (HI 1-1) cells detected using α-GFP antibody. γ-Tubulin is used as a loading control. A higher exposure of YFP-Sp100C and HMG in U2OS cells and YFP-Sp100B, B(W655Q), C, and HMG in HeLa cells was needed to detect these isoforms. The different exposures are outlined separately.
FIGURE 5:
FIGURE 5:
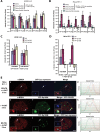
Sp100A cannot overcome Daxx- and ATRX-mediated transcriptional repression. Images of Cherry-MS2 accumulation at activated transgene arrays in (a–h) control, (e–h) YFP-Sp100A–, and (i–l) YFP-ICP0–expressing HeLa (HI 1-1) cells. Arrows indicate the locations of the transgene arrays. Yellow lines in enlarged merge insets show the path through which the red, green, and blue intensities were measured in the intensity profiles (d, h, l). Asterisks mark the start of the measured lines. Scale bar, 5 μm. Scale bars in enlarged inset, 1 μm. (B) Single-cell analysis of Cherry-MS2 intensity levels at inactive and activated transgene arrays in HeLa (HI 1-1) cells. Factors were transiently expressed from plasmids. Constructs expressed and N values are shown in the chart below the graph. (C) qRT-PCR analysis of mRNA levels in activated HeLa (HI 1-1) cells after lentiviral transduction of Sp100A alone or in combination with ICP0 or ICP0-FxE, deleted of the RING finger zinc-binding motif, which is required for activity. Constructs expressed are shown in the chart below the graph. Results are the average of at least three independent experiments. SDs are given in the form of error bars, and p values are calculated using the unpaired t test.
FIGURE 6:
FIGURE 6:
Sp100A promotes lysine acetylation at the activated CMV-promoter–regulated transgene array. Average intensity levels of YFP-tagged acetyl-lysine regulatory factors at transgene arrays in (A) U2OS (2-6-3) and (B) HeLa (HI 1-1) cells. Factors were expressed by transient transfection. For activated U2OS (2-6-3) cells, the activator (CFP-tTA-ER) was coexpressed with Cherry, Cherry- Sp100A, or Cherry-Sp100B and a YFP-tagged acetyl-lysine regulatory factor. For activated HeLa (HI 1-1) cells, the activator (tTA-ER) was coexpressed with Cherry, Cherry- Sp100A, or Cherry-Sp100B, a YFP-tagged acetyl lysine regulatory factor, and CFP-lac repressor (to identify the array). For analysis of the Sp100A's effects on acetyl-lysine regulatory factor recruitment to the inactive array, YFP-tagged factors were coexpressed with Cherry-Sp100A and CFP-lac repressor (to identify the array). SDs are given in the form of error bars, and p values are calculated using the unpaired t test and listed in Table 2. (C, D) Average intensity levels of endogenous Brd4 and histone H4 lysine 5 acetylation (H4AcK5) levels, detected by immunofluorescence staining, at CFP-tTA-ER activated arrays in (C) U2OS (2-6-3) and (D) HeLa (HI 1-1) cells coexpressing YFP, YFP-Sp100A, or YFP-Sp100B. SDs are given in the form of error bars, and p values are calculated using the unpaired t test and listed in Table 3. (E) Immunofluorescence localization of Brd4 at the activated array in (a–d) control and (e–h) YFP-Sp100A– and (i–l) YFP-Sp100B–expressing HeLa (HI 1-1) cells. YFP could not be imaged in control samples because it was extracted by the immunofluorescence staining protocol. Arrows indicate the locations of the transgene arrays. Yellow lines in enlarged merge insets show the path through which the red, green, and blue intensities were measured in the intensity profiles (d, h, l). Asterisks mark the start of the measured lines. Scale bar, 5 μm. Scale bars in enlarged inset, 1 μm.
FIGURE 7:
FIGURE 7:
Model of PML-NB/ND10-factor–mediated transcription regulation of the CMV promoter. Daxx and ATRX repress transcription from the CMV promoter and prevent RNA pol II recruitment. In the presence of Daxx and ATRX, Sp100A promotes chromatin decondensation and acetyl-lysine regulatory factor recruitment, and Sp100B prevents these events. ICP0 degrades PML and causes Daxx and ATRX to be displaced from the CMV-promoter–regulated transcription site. Under these conditions, RNA pol II is able to transcribe from the CMV promoter. ICP0 likely also displaces and/or recruits additional, as-yet-unidentified repressors and activators to the site.

Similar articles

Cited by

References

    1. Adler M, Tavalai N, Muller R, Stamminger T. Human cytomegalovirus immediate-early gene expression is restricted by the nuclear domain 10 component Sp100. J Gen Virol. 2011;92:1532–1538. - PubMed
    1. Baker LA, Allis CD, Wang GG. PHD fingers in human diseases: disorders arising from misinterpreting epigenetic marks. Mutat Res. 2008;647:3–12. - PMC - PubMed
    1. Bottomley MJ, Collard MW, Huggenvik JI, Liu Z, Gibson TJ, Sattler M. The SAND domain structure defines a novel DNA-binding fold in transcriptional regulation. Nat Struct Biol. 2001;8:626–633. - PubMed
    1. Chelbi-Alix MK, de The H. Herpes virus induced proteasome-dependent degradation of the nuclear bodies-associated PML and Sp100 proteins. Oncogene. 1999;18:935–941. - PubMed
    1. Everett RD. ICP0, a regulator of herpes simplex virus during lytic and latent infection. Bioessays. 2000;22:761–770. - PubMed

Publication types

MeSH terms