Clinical Trial
. 2013 Jun 15;207(12):1829-40.
doi: 10.1093/infdis/jit098. Epub 2013 Mar 12.

Therapeutic vaccination expands and improves the function of the HIV-specific memory T-cell repertoire

Collaborators, Affiliations
Clinical Trial

Therapeutic vaccination expands and improves the function of the HIV-specific memory T-cell repertoire

Joseph P Casazza et al. J Infect Dis. .

Abstract

Background: The licensing of herpes zoster vaccine has demonstrated that therapeutic vaccination can help control chronic viral infection. Unfortunately, human trials of immunodeficiency virus (HIV) vaccine have shown only marginal efficacy.

Methods: In this double-blind study, 17 HIV-infected individuals with viral loads of <50 copies/mL and CD4(+) T-cell counts of >350 cells/µL were randomly assigned to the vaccine or placebo arm. Vaccine recipients received 3 intramuscular injections of HIV DNA (4 mg) coding for clade B Gag, Pol, and Nef and clade A, B, and C Env, followed by a replication-deficient adenovirus type 5 boost (10(10) particle units) encoding all DNA vaccine antigens except Nef. Humoral, total T-cell, and CD8(+) cytotoxic T-lymphocyte (CTL) responses were studied before and after vaccination. Single-copy viral loads and frequencies of latently infected CD4(+) T cells were determined.

Results: Vaccination was safe and well tolerated. Significantly stronger HIV-specific T-cell responses against Gag, Pol, and Env, with increased polyfunctionality and a broadened epitope-specific CTL repertoire, were observed after vaccination. No changes in single-copy viral load or the frequency of latent infection were observed.

Conclusions: Vaccination of individuals with existing HIV-specific immunity improved the magnitude, breadth, and polyfunctionality of HIV-specific memory T-cell responses but did not impact markers of viral control.

Clinical trials registration: NCT00270465.

Keywords: HIV; cytotoxic T lymphocytes; humoral immunity; therapy; vaccination; viral latency.


Figures
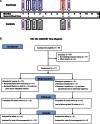
Figure 1.
Figure 1.
Vaccination regimen for Vaccine Research Center 101 study (VRC 101). Seventeen individuals were enrolled in VRC 101. Twelve individuals received 3 DNA prime vaccinations, with the first vaccination administered at enrollment and the second and third DNA priming vaccinations administered 1 and 2 months, respectively, after enrollment. A replication-deficient adenovirus type 5 (Ad5) boost vaccination was given at month 6. Five individuals received placebo injections. Blood draws used for immunologic assessment are shown by x's. Individuals who agreed to apheresis underwent this procedure in the month preceding vaccination and 1 month after recombinant Ad5 (rAd5) boosting. Primary immunologic end points were the differences between human immunodeficiency virus (HIV)–specific interferon γ responses at enrollment; at week 10, 2 weeks after the last DNA priming vaccination; and at week 28, 4 weeks after rAd5 boosting. Abbreviation: Vax, vaccination.
Figure 2.
Figure 2.
Vaccination increased the frequency of HIV-specific CD8 T cells. A, Frequency of interferon γ (IFN-γ)–producing cells per million peripheral blood mononuclear cells (PBMCs) after overnight incubation with vaccine-matched 15mer peptides overlapped by 11 residues, corresponding to the human immunodeficiency virus (HIV) clade B Gag, clade B Pol, clade B Nef, and clade A, B, and C Env gene products. Box plots represent the second and third quartiles; horizontal bars indicating median values. Whiskers indicate the 90% range for the data. Dots represent individual data outside the 10%–90% range. Blue bars show data from ELISpot analyses done using PBMCs prepared from blood drawn on day 1 before vaccination; red bars represent data from PBMCs prepared from blood draws 1 month after recombinant adenovirus type 5 (rAd5) vaccination. Significant differences in IFN-γ ELISpot frequencies before and 1 month after vaccination are indicated by horizontal lines. In vaccinees, incubation of PBMCs with clade B Gag, clade B Pol, and clade A, B, and C Env 15mers resulted in significantly greater response frequencies after vaccination. No significant difference was observed in the Nef responses after vaccination No significant difference responses to any peptide pools was observed in the placebo group pre- and post-vaccination. B, Frequency of IFN-γ–producing ELISpots per million PBMCs after overnight incubation with individual 15mers either before or after vaccination. In vaccinees, the frequency of postvaccination IFN-γ responses was significantly higher after vaccination (P < .001). No significant difference was observed in incubations containing PBMCs from placebos. C, Frequency of IFN-γ–producing CD8+ T cells measured by intracellular cytokine staining in response to 6-hour incubation with specific 15mers identified as inducing IFN-γ production either before or after vaccination. Responses are shown for Gag, Pol, Nef, and Env 15mers. No Env epitopes were identified in the placebo group. Postvaccination IFN-γ production was observed significantly more frequently in vaccinees after vaccination than before vaccination (P < .05). When grouped by HIV gene product, only Gag-specific responses were significantly increased by vaccination (P < .05). No significant difference was observed in the placebo group. Abbreviation: Vax, vaccination.
Figure 3.
Figure 3.
Functional, maturation, and activation profile of pre- and postvaccination CD8+ T-cell responses for different peptide epitopes. A, Pre- and postvaccination functional profiles in response to 6-hour incubation with 2 μg/mL optimized peptide epitope, showing the frequencies of memory CD8+ T cells displaying the depicted combinations of surface mobilization of CD107a (7) and intracellular production of interferon γ (IFN-γ; g), interleukin 2 (2), macrophage inflammatory protein 1β (M), and tumor necrosis factor α (T). Individual data points are represented by a blue dot, for prevaccination values, and a red dot, for postvaccination values. Six different peptide epitopes were tested using peripheral blood mononuclear cells (PBMCs) prepared from 4 different vaccinees (Supplementary Table 3). Bars represent the range of the second and third quartiles, with horizontal lines representing the median values for each of the 31 functional subgroups. The median prevaccination response frequency among memory CD8+ T cells was 0.09% (range, 0.04%–0.61%). The median postvaccination response frequency among memory CD8+ T cells was 0.37% (range, 0.1%–0.92%). A median 2-fold increase in response (range, 1.51–7.24-fold) was observed after vaccination. Median polyfunctionality was significantly increased, from 1.65 (range, 1.17–2.7) to 2.19 (range, 1.5–2.95), as determined by a Wilcoxon signed ranks test (P < .05). B, Maturational profile of IFN-γ–producing memory CD8+ T cells for both pre- and postvaccination responses, as determined by surface expression of CD27 and CD57. The red circles represent the maturation profile for the response to the B51-optimized epitope YI9. C, Activation profile of IFN-γ–producing memory CD8+ T cells for both pre- and postvaccination responses, based on surface expression of CCR5, HLA DR, and CD38 and intracellular expression of Ki67. Red circles represent the activation profile for the response to the B51-optimized epitope YI9.
Figure 4.
Figure 4.
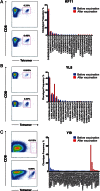
Clonotypic analysis of antigen-specific CD8+ T cells before and after vaccination show evidence of vaccine induced T-cell clonotypes. Pre- and postvaccination histographs showing tetramer-positive CD8+ T-cell populations for 3 different optimized epitopes and graphs showing the frequency of specific T-cell receptor clonotypes, as defined by CDR3β sequence, for each tetramer-defined population. Prevaccination clonotype frequencies are shown by blue bars; postvaccination clonotype frequencies are shown by red bars. A, Tetramer-specific T-cell receptor frequency for the optimized B57 epitope KF11. Seventy-seven clones were sequenced before vaccination, and 82 clones were sequenced after vaccination. B, Tetramer-specific T-cell receptor frequency for the positive responses to the optimized B08 epitope YL8. Eighty-six clones were sequenced before vaccination, and 85 clones were sequenced after vaccination. C, Tetramer-specific T-cell receptor frequencies for the optimized B51 epitope YI9. Seventy-three clones were sequenced before vaccination, and 92 clones were sequenced after vaccination.
Figure 5.
Figure 5.
Plot showing the functional sensitivity (FS) of a vaccine-induced response to the A clade epitope YI9 and the homologous B clade epitope YAPPISGQI. Sigmoidal fit of the frequency of interferon γ–producing cells in response to stimulation with different concentrations of peptide. Half-maximal concentrations for each 9mer peptide are shown on the graph.
Figure 6.
Figure 6.
Vaccination did not affect human immunodeficiency virus (HIV) load or CD4+ T-cell count. A, CD4+ T-cell counts during the Vaccine Research Center 101 study. Weeks after enrollment are indicated on the x-axis. Time of vaccination is indicated by text. Median CD4+ T-cell count is indicated for placebo recipients (blue circles) and vaccinees (red squares). Bars indicate the limit of data for the second and third quartile. B, Viral loads are shown for vaccine recipients (red dots) and placebo recipients (blue dots). The open bars shown for one of the vaccine recipients indicate an interruption in the trial, caused by the release of the results of the STEP trial. C, Single-copy HIV RNA levels for placebo recipients (blue dots) and vaccine recipients (red dots) on the day of enrollment prior to the first DNA priming vaccination, immediately prior to recombinant adenovirus type 5 (rAd5) boosting, 1 month after Ad5 boosting, and 3 months after Ad5 boosting. Horizontal bars indicate median values for vaccine recipients (red) and placebo recipients (blue). Values less than the lower limit of detection are shown below the black dashed line. D, Log plots of frequency of latently infected resting CD4+ T cells for both vaccine and placebo recipients, both before vaccination and 1 month after vaccination. Determinations in which the frequency of latently infected cells were less than the lower limit of detection are shown as open circles denoting the limit of detection. Abbreviation: Vax, vaccination.

Similar articles

Cited by

References

    1. Oxman MN. Zoster vaccine: current status and future prospects. Clin Infect Dis. 2010;51:197–213. - PubMed
    1. Goulder PJ, Phillips RE, Colbert RA, et al. Late escape from an immunodominant cytotoxic T-lymphocyte response associated with progression to AIDS. Nat Med. 1997;3:212–7. - PubMed
    1. Koup RA, Safrit JT, Cao Y, et al. Temporal association of cellular immune responses with the initial control of viremia in primary human immunodeficiency virus type 1 syndrome. Journal of Virology. 1994;68:4650–5. - PMC - PubMed
    1. Migueles SA, Sabbaghian MS, Shupert WL, et al. HLA B*5701 is highly associated with restriction of virus replication in a subgroup of HIV-infected long term nonprogressors. Proc Natl Acad Sci U S A. 2000;97:2709–14. - PMC - PubMed
    1. Salazar-Gonzalez JF, Salazar MG, Keele BF, et al. Genetic identity, biological phenotype, and evolutionary pathways of transmitted/founder viruses in acute and early HIV-1 infection. J Exp Med. 2009;206:1273–89. - PMC - PubMed

Publication types

MeSH terms

Associated data