. 2013 Apr 23;110(17):E1565-74.
doi: 10.1073/pnas.1220697110. Epub 2013 Mar 11.

Optically triggering spatiotemporally confined GPCR activity in a cell and programming neurite initiation and extension

Affiliations

Optically triggering spatiotemporally confined GPCR activity in a cell and programming neurite initiation and extension

W K Ajith Karunarathne et al. Proc Natl Acad Sci U S A. .

Abstract

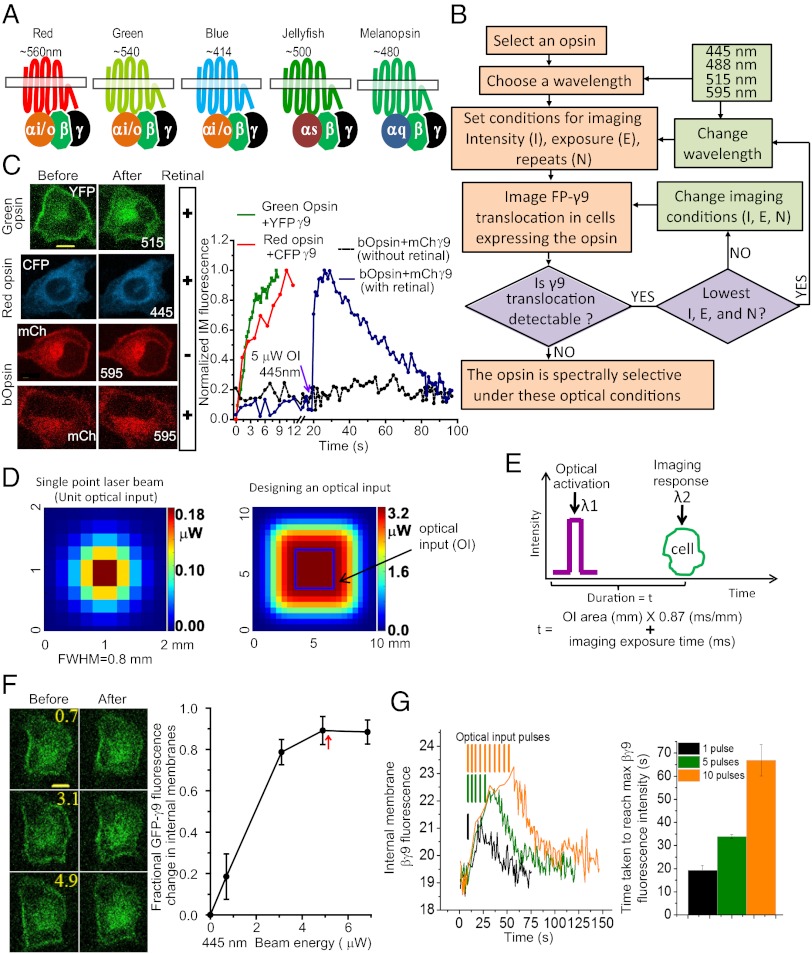
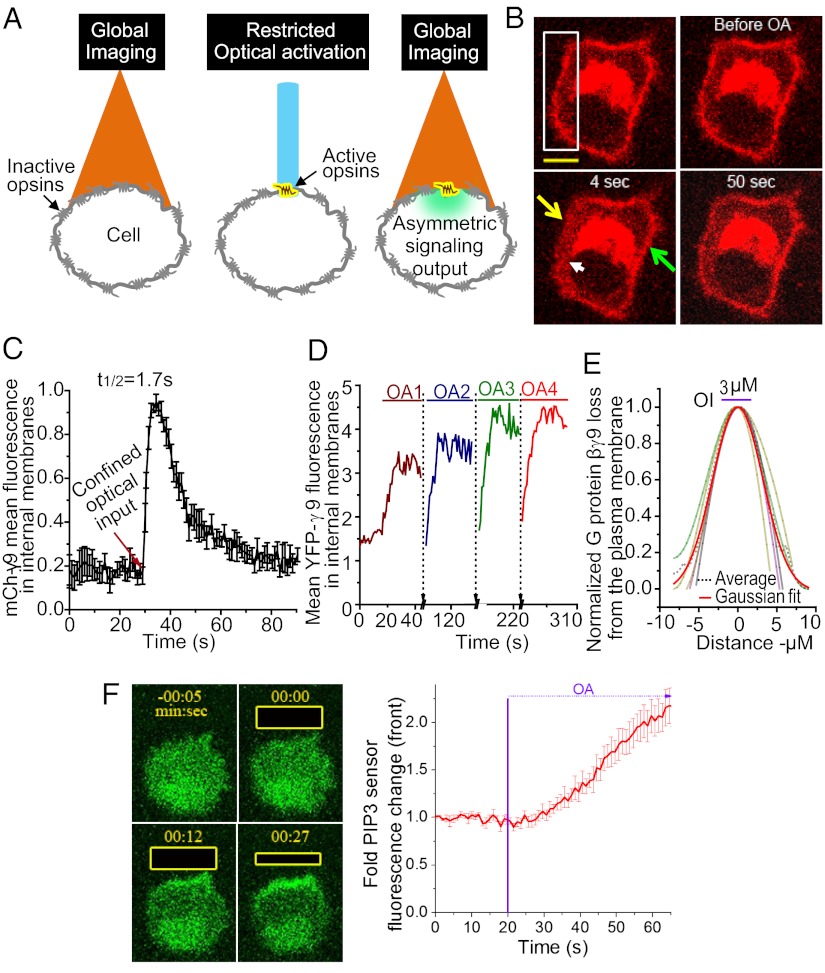
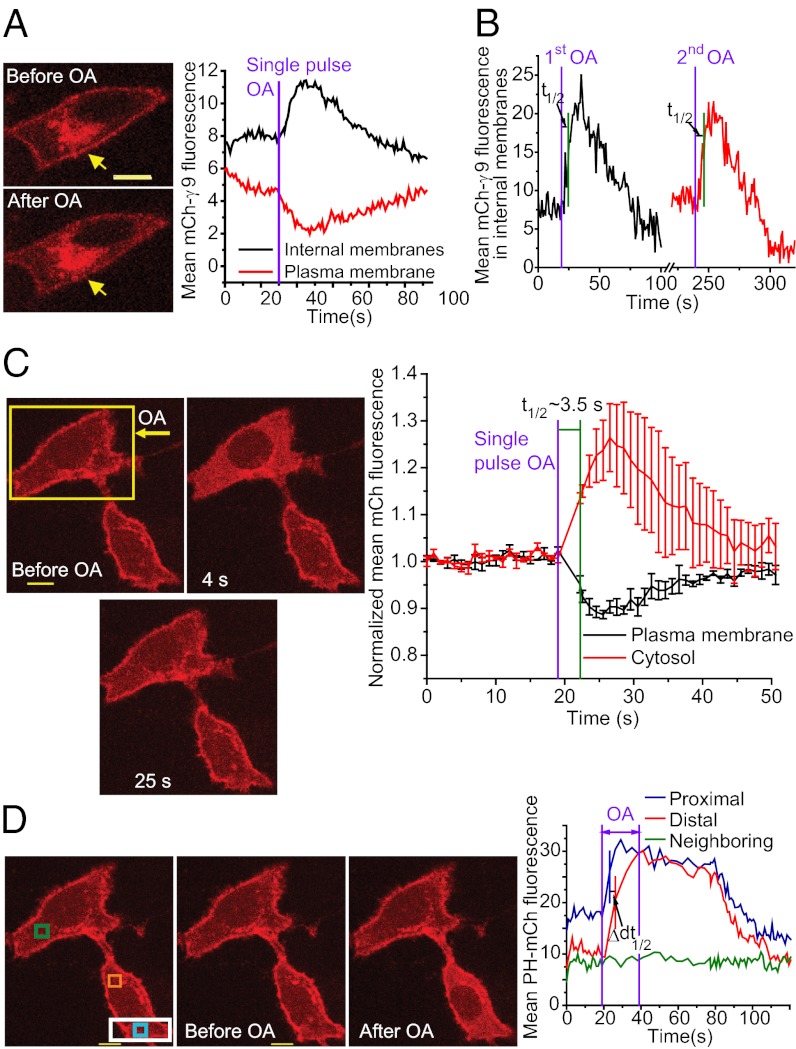
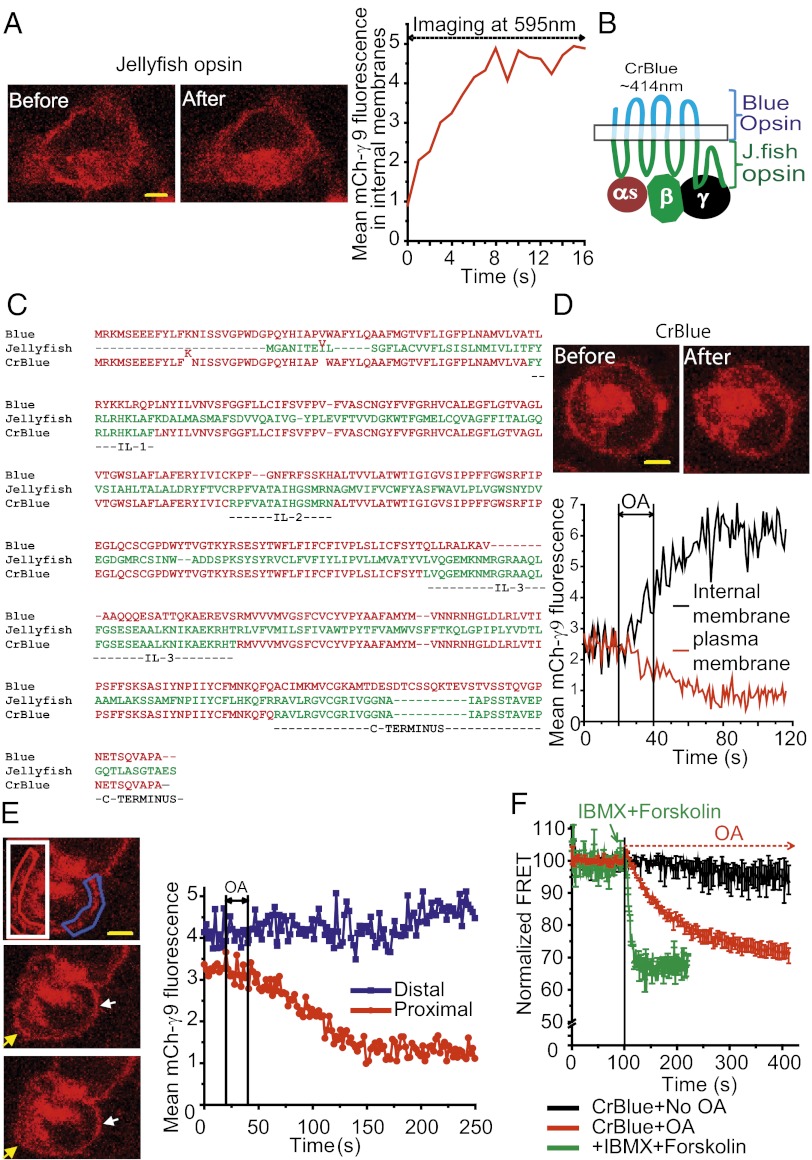
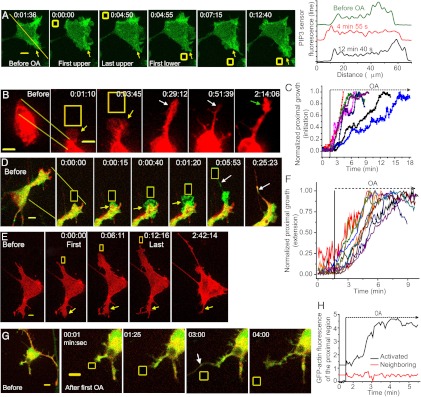
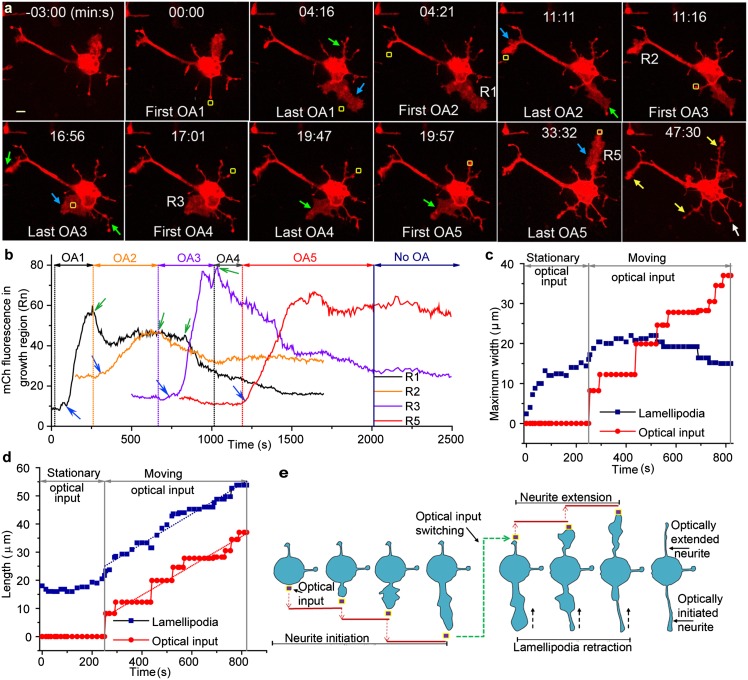
G-protein-coupled receptor (GPCR) activity gradients evoke important cell behavior but there is a dearth of methods to induce such asymmetric signaling in a cell. Here we achieved reversible, rapidly switchable patterns of spatiotemporally restricted GPCR activity in a single cell. We recruited properties of nonrhodopsin opsins--rapid deactivation, distinct spectral tuning, and resistance to bleaching--to activate native Gi, Gq, or Gs signaling in selected regions of a cell. Optical inputs were designed to spatiotemporally control levels of second messengers, IP3, phosphatidylinositol (3,4,5)-triphosphate, and cAMP in a cell. Spectrally selective imaging was accomplished to simultaneously monitor optically evoked molecular and cellular response dynamics. We show that localized optical activation of an opsin-based trigger can induce neurite initiation, phosphatidylinositol (3,4,5)-triphosphate increase, and actin remodeling. Serial optical inputs to neurite tips can refashion early neuron differentiation. Methods here can be widely applied to program GPCR-mediated cell behaviors.


Conflict of interest statement

The authors declare no conflict of interest.

Figures

Fig. 1.
Fig. 1.
Screening opsins for spectral selectivity and optimizing conditions for OIs and imaging. (A) Opsins used, their λ-max, and Gα-subtype specificity are shown. Individual opsins are described in the text. (B) Schematic for screening opsins for spectral selectivity. (C) Representative images of HeLa cells expressing green opsin and YFP-γ9 (green), red opsin and CFP-γ9 (blue), and bOpsin and mCh-γ9 (red). Cells were incubated with (+) or without (−) 11-cis retinal as indicated. For green opsin and red opsin, FP-γ9 distribution in the first (before) and last (after) images during image capture is shown. For bOpsin, images show mCh-γ9 distribution before and after optical activation (at 20 s after initiating image acquisition) with 445-nm, 5-μW optical inputs. Translocation of FP-βγ to intracellular membranes (IM) is plotted on the right (n = 8). bOpsin-expressing cells with retinal were activated with a single 5-μW pulse whereas cells without retinal did not show translocation even after optical activation with 30 pulses (n = 8). Here and in all optical activation experiments below, n values represent number of cells. (D) Designing an optical input (OI) for opsin activation. (Left) Single-point laser beam energy density profile of 445 nm, 5 μW at the image plane. Experimentally a cell can be exposed to this optical input by selecting the crosshair tool (┼) as the ROI. (Right) Energy density profile of square-shaped OI area (example: 3 × 3 μm) of laser raster scan. The galvo mirrors scan the ROI at 0.87 ms/μm2 and the area of the OI determines the duration of a single pulse. (E) Optical activation at one specific wavelength and intensity (purple) is followed by imaging at a different wavelength. (F) A single HeLa cell coexpressing bOpsin-mCh and YFP-γ9 was optically activated by varying laser intensities (445 nm). Individual cells were optically activated using a single-pulse OI that covered the entire cell (energy of the OI in microwatts is indicated on the image). After 20 s the cell was imaged to capture YFP-γ9 distribution. The cell was allowed a 1-min recovery and tested at the next intensity. The plot shows fractional YFP-γ9 intensity changes in internal membranes. The red arrow shows the selected intensity (5 μW) for optical activation of bOpsin in experiments below (n = 7). (G) Magnitude and duration of γ9 translocation can be controlled by varying the number of pulses in HeLa cells expressing bOpsin and mCh-γ9. The cell was initially imaged for 10 s (baseline reference) and then activated with 1, 5, and 10 (1 pulse every 5 s) OI pulses (5 μW). mCh-γ9 distribution was continually imaged. Plot shows internal membrane fluorescence. Bar chart shows averaged mCh-γ9 fluorescence rise time in response to number of pulses (n = 6).
Fig. 2.
Fig. 2.
Spatiotemporally restricted Gi activation using bOpsin. (A) Schematic showing how spatially confined GPCR activity can be achieved using an appropriate opsin with desired spectral selectivity. Cell is globally imaged in the basal state with a light beam (orange) of wavelength per second and intensity characteristics that do not activate the opsin (gray). Opsin is activated (yellow) in a spatially confined area of the cell, using a wavelength close to its λ-max (blue). The response to local activation (green) is imaged globally. (B) Localized bOpsin activation with a confined single-pulse OI (white box, 445 nm, 5 μW) induced spatially restricted mCh-γ9 translocation (yellow arrow, activated proximal plasma membrane; green arrow, unactivated distal) in HeLa cells (n = 10). (C) Plot shows averaged mCh-γ9 intensity changes in internal membranes adjacent to the activated plasma membrane (white arrow in B) (n = 10). (D) Repeated optical activation (OA) of bOpsin can be used to achieve repeated signaling in a single cell. After bOpsin activation for a period, recovery was allowed for 1 min before repeating activation (n = 20). (E) Determination of spatial confinement of optically induced GPCR activity using FP-γ9 translocation. Shown is extent of GFP-γ9 translocation from the plasma membrane of HeLa cells expressing bOpsin and GFP-γ9 before and 5 s after application of a confined 3-µm-wide OI (purple line) (Fig. S1B). Fractional GFP-γ9 loss was calculated. A fitted Gaussian distribution curve (red line) to the averaged experimental data points (dotted line) resulted in FWHM of 6.3 (n = 6). (F) OI (yellow box) (445 nm, 5-s interval pulses) applied asymmetrically to a RAW 264.7 cell expressing bOpsin-mCh and PIP3 sensor. Akt-PH-GFP evokes localized PIP3 production at the proximal region of the cell (Right) (n = 5).
Fig. 3.
Fig. 3.
Localized activation of Gq signaling by melanopsin. (A) Single-pulse optical activation (OA) of melanopsin (488 nm, 27 μW) induced mCh-γ9 translocation. (Right) Plot shows representative increase in mCh-γ9 in intracellular membranes. Decrease in the plasma membrane is shown by yellow arrows (Left) (n = 6). (B) Repeated activation (2 min apart) of melanopsin induces repeated translocation of mCh-γ9 (t1/2 = ∼6 s, n = 6). (C) Optical activation of melanopsin induces PH domain translocation in HeLa cells. A HeLa cell expressing melanopsin and PH-mCh was optically activated (entire cell, yellow box) with a single pulse of light. PH-mCh translocated to the cytosol (image: 4 s). There was complete reversal of PH-mCh to the plasma membrane over time (image: 25 s). (Right) Plot shows mCh intensity changes in the plasma membrane and the cytosol (n = 7). (D) Localized melanopsin activation (white box) induced localized PH-mCh translocation, indicating IP3 production. (Right) Plot shows intensity changes in ROIs in the image (Δt1/2 ∼ 4 s, n = 7).
Fig. 4.
Fig. 4.
Reengineering of a spectrally selective opsin for localized Gs signaling. (A) Gs-coupled jellyfish opsin activation induced mCh-βγ9 translocation in HeLa cells during imaging of mCh (n = 10). (Right) Plot shows increase in mCh-βγ9 in intracellular membranes without a baseline. (B) Designing Gs-coupled opsin, CrBlue using extracellular and retinal-binding transmembrane regions of blue opsin (blue) responsible for spectral tuning, and jellyfish opsin (green) intracellular loops that couple to Gs. (C) Primary structures of opsins aligned. IL, intracellular loops. (D) Global CrBlue optical activation (OA) induced mCh-γ9 translocation in HeLa cells (n = 8). (Lower) Plot shows the ability to acquire images in the basal state. (E) Localized CrBlue activation (white box) induced spatially restricted mCh-γ9 translocation (red ROI and yellow arrow, activated proximal region; blue ROI and white arrow, unactivated distal area) in HeLa cells (n = 7). (Right) Plot shows βγ translocation away from the plasma membrane. (F) Optical activation of CrBlue (every 5 s) in HeLa cells induced FRET changes in GFP-Δ-epac-mRFP cAMP sensor [GR(488/565)/GG(488/515] (red) (n = 6). Control cells (black) were similarly imaged without optical activation. To check the sensor functionality, FRET changes in the GFP-Δ-epac-mRFP cAMP sensor were examined in HeLa cells (green plot) by adding 25 μM Forskolin and 100 μM phosphodiesterase inhibitor, IBMX (final concentrations) at 100 s.
Fig. 5.
Fig. 5.
Optical control of neurite initiation and extension in rat hippocampal neurons. (A) Localized PIP3 formation in response to confined optical activation (OA). Yellow box represents OI. (Right) Line plots show PIP3 changes over time. Line used is shown in basal image (Left). Time here and below is shown as h:min:s on the images. (B) (Left) Stage 1 neuron expressing bOpsin-mCh before optical activation. Cell was optically activated every 5 s (yellow box) and imaged. Selected area of the light-activated region (yellow lines) is shown. Lamellipodia (yellow arrows) form in the direction of optical input. After termination of optical activation at 3 min 45 s, lamellipodia consolidate into a neurite (white arrows) with a growth cone (green arrow) (n = 6). (C) Growth dynamics of the lamellipodia formation during neurite initiation on onset of optical activation in multiple neurons. Responses were normalized to whole-cell mean opsin-mCh or DenMark-mCh fluorescence and further normalized from 0 to 1 in the y axis (methods for quantitation are described in SI Methods and Fig. S4). (D) Optically induced neurite initiation and associated actin cytoskeleton remodeling in neuron expressing bOpsin-mCh and mGFP-actin. During optical activation, only GFP images were captured. Both mCh and GFP images were captured after terminating optical activation and overlaid (Right). Actin-rich lamellipodia (yellow arrow) later consolidated into a neurite (white arrow) (n = 7). (E) Optical activation induced neurite extension in a neuron expressing bOpsin and DenMark-mCh (dendritic marker). During optical activation (yellow box) of a selected region of a neuron, spontaneously growing lamellipodia at the opposite end of the neuron (yellow arrow) retracted. (F) Growth dynamics during optically induced neurite extension in multiple neurons. Neurons expressing bOpsin-mCh or DenMark-mCh were optically activated as described in E, using 5 μW, 445 nm OI. Responses were normalized to whole-cell mean opsin-mCh or DenMark-mCh fluorescence and further normalized from 0 to 1 in the y axis as above (SI Methods and Fig. S4). (G) Actin remodeling during optical activation stimulated neurite extension in a neuron expressing bOpsin-mCh and mGFP-actin. Shown is formation of actin-rich filopodia (white arrow) (n = 5). (H) Plot shows GFP fluorescence change in the activated neurite compared with an unactivated neighbor (red line).
Fig. 6.
Fig. 6.
Extension and retraction of growth in response to spatially discrete sequential optical activation. (A) Rat hippocampal neuron (1–2 d postnatal) expressing bOpsin-mCh. Images show optical activation (OA) induced lamellipodial growth (blue arrows) at the activated site and retraction (green arrows) at distal sites. Mean pixel intensities were determined in regions that cover fully grown lamellipodia (R1–R5). Images are representative of >10 experiments. In other experiments only one or two cycles of extension–retraction were examined. (B) Synchronization of multiple-lamellipodia extension and retractions in a single neuron during application of optical inputs. Image at 47 min 30 s shows optical activation induced three extended (yellow arrows) and one new (white arrow) neurite. (C) Determination of single-neurite growth dynamics to restricted optical input function varying in time and space. Stationary optical input induced lamellipodia growth, resulting in an increase in width of the lamellipodia without significant elongation. (D) Elongation of lamellipodia and directed neurite extension were achieved by step-like movement of the optical input away from the growth region. The slope of lamellipodia elongation and the slope of optical input (∼0.05) varying along the neurite axis were found to be similar. (E) By varying the optical input in space and time, neurite initiation and extension can be reprogrammed.

Similar articles

Cited by

References

    1. Mogilner A, Allard J, Wollman R. Cell polarity: Quantitative modeling as a tool in cell biology. Science. 2012;336(6078):175–179. - PubMed
    1. Hille B. G protein-coupled mechanisms and nervous signaling. Neuron. 1992;9(2):187–195. - PubMed
    1. Luo DG, Xue T, Yau KW. How vision begins: An odyssey. Proc Natl Acad Sci USA. 2008;105(29):9855–9862. - PMC - PubMed
    1. Shichida Y, Matsuyama T. Evolution of opsins and phototransduction. Philos Trans R Soc Lond B Biol Sci. 2009;364(1531):2881–2895. - PMC - PubMed
    1. Frentiu FD, Briscoe AD. A butterfly eye’s view of birds. Bioessays. 2008;30(11–12):1151–1162. - PubMed

Publication types

MeSH terms

LinkOut - more resources