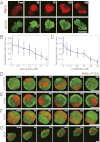
Phase geometries of two-dimensional excitable waves govern self-organized morphodynamics of amoeboid cells
- PMID: 23479620
- PMCID: PMC3612638
- DOI: 10.1073/pnas.1218025110
Phase geometries of two-dimensional excitable waves govern self-organized morphodynamics of amoeboid cells
Abstract
In both randomly moving Dictyostelium and mammalian cells, phosphatidylinositol (3,4,5)-trisphosphate and F-actin are known to propagate as waves at the membrane and act to push out the protruding edge. To date, however, the relationship between the wave geometry and the patterns of amoeboid shape change remains elusive. Here, by using phase map analysis, we show that morphology dynamics of randomly moving Dictyostelium discoideum cells can be characterized by the number, topology, and position of spatial phase singularities, i.e., points that represent organizing centers of rotating waves. A single isolated singularity near the cellular edge induced a rotational protrusion, whereas a pair of singularities supported a symmetric extension. These singularities appeared by strong phase resetting due to de novo nucleation at the back of preexisting waves. Analysis of a theoretical model indicated excitability of the system that is governed by positive feedback from phosphatidylinositol (3,4,5)-trisphosphate to PI3-kinase activation, and we showed experimentally that this requires F-actin. Furthermore, by incorporating membrane deformation into the model, we demonstrated that geometries of competing waves explain most of the observed semiperiodic changes in amoeboid morphology.
Conflict of interest statement
The authors declare no conflict of interest.
Figures


Similar articles
-
Excitable dynamics of Ras triggers spontaneous symmetry breaking of PIP3 signaling in motile cells.J Cell Sci. 2019 Mar 4;132(5):jcs224121. doi: 10.1242/jcs.224121. J Cell Sci. 2019. PMID: 30745337 Free PMC article.
-
Three-Dimensional Cell Geometry Controls Excitable Membrane Signaling in Dictyostelium Cells.Biophys J. 2019 Jan 22;116(2):372-382. doi: 10.1016/j.bpj.2018.12.012. Epub 2018 Dec 20. Biophys J. 2019. PMID: 30635124 Free PMC article.
-
Self-organization of PIP3 waves is controlled by the topology and curvature of cell membranes.Biophys J. 2024 May 7;123(9):1058-1068. doi: 10.1016/j.bpj.2024.03.022. Epub 2024 Mar 21. Biophys J. 2024. PMID: 38515298
-
The excitable signal transduction networks: movers and shapers of eukaryotic cell migration.Int J Dev Biol. 2019;63(8-9-10):407-416. doi: 10.1387/ijdb.190265pd. Int J Dev Biol. 2019. PMID: 31840779 Free PMC article. Review.
-
Amoeboid leukocyte crawling through extracellular matrix: lessons from the Dictyostelium paradigm of cell movement.J Leukoc Biol. 2001 Oct;70(4):491-509. J Leukoc Biol. 2001. PMID: 11590185 Review.
Cited by
-
Three-component contour dynamics model to simulate and analyze amoeboid cell motility in two dimensions.PLoS One. 2024 Jan 26;19(1):e0297511. doi: 10.1371/journal.pone.0297511. eCollection 2024. PLoS One. 2024. PMID: 38277351 Free PMC article.
-
Membrane shape-mediated wave propagation of cortical protein dynamics.Nat Commun. 2018 Jan 10;9(1):136. doi: 10.1038/s41467-017-02469-1. Nat Commun. 2018. PMID: 29321558 Free PMC article.
-
Activator-inhibitor coupling between Rho signalling and actin assembly makes the cell cortex an excitable medium.Nat Cell Biol. 2015 Nov;17(11):1471-83. doi: 10.1038/ncb3251. Epub 2015 Oct 19. Nat Cell Biol. 2015. PMID: 26479320 Free PMC article.
-
Micrometer-Scale Membrane Transition of Supported Lipid Bilayer Membrane Reconstituted with Cytosol of Dictyostelium discoideum.Life (Basel). 2017 Mar 7;7(1):11. doi: 10.3390/life7010011. Life (Basel). 2017. PMID: 28272354 Free PMC article.
-
From actin waves to mechanism and back: How theory aids biological understanding.Elife. 2023 Jul 10;12:e87181. doi: 10.7554/eLife.87181. Elife. 2023. PMID: 37428017 Free PMC article.
References
-
- Friedl P, Borgmann S, Bröcker EB. Amoeboid leukocyte crawling through extracellular matrix: Lessons from the Dictyostelium paradigm of cell movement. J Leukoc Biol. 2001;70(4):491–509. - PubMed
-
- Grabher C, et al. Birth and life of tissue macrophages and their migration in embryogenesis and inflammation in medaka. J Leukoc Biol. 2007;81(1):263–271. - PubMed
-
- Ridley AJ, et al. Cell migration: Integrating signals from front to back. Science. 2003;302(5651):1704–1709. - PubMed
Publication types
MeSH terms
Substances
LinkOut - more resources
Full Text Sources
Other Literature Sources

