. 2013 Mar 21;38(3):555-69.
doi: 10.1016/j.immuni.2013.02.012. Epub 2013 Mar 7.

Recruitment of beneficial M2 macrophages to injured spinal cord is orchestrated by remote brain choroid plexus

Affiliations

Recruitment of beneficial M2 macrophages to injured spinal cord is orchestrated by remote brain choroid plexus

Ravid Shechter et al. Immunity. .

Abstract

Monocyte-derived macrophages are essential for recovery after spinal cord injury, but their homing mechanism is poorly understood. Here, we show that although of common origin, the homing of proinflammatory (M1) and the "alternatively activated" anti-inflammatory (M2) macrophages to traumatized spinal cord (SC) was distinctly regulated, neither being through breached blood-brain barrier. The M1 macrophages (Ly6c(hi)CX3CR1(lo)) derived from monocytes homed in a CCL2 chemokine-dependent manner through the adjacent SC leptomeninges. The resolving M2 macrophages (Ly6c(lo)CX3CR1(hi)) derived from monocytes trafficked through a remote blood-cerebrospinal-fluid (CSF) barrier, the brain-ventricular choroid plexus (CP), via VCAM-1-VLA-4 adhesion molecules and epithelial CD73 enzyme for extravasation and epithelial transmigration. Blockage of these determinants, or mechanical CSF flow obstruction, inhibited M2 macrophage recruitment and impaired motor-function recovery. The CP, along with the CSF and the central canal, provided an anti-inflammatory supporting milieu, potentially priming the trafficking monocytes. Overall, our finding demonstrates that the route of monocyte entry to central nervous system provides an instructional environment to shape their function.


Figures

Figure 1
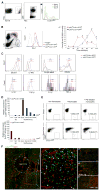
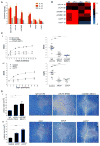
Figure 1. M1 and M2 Monocyte-Macrophages Are Actively Recruited to Injured SC Parenchyma
(A–C) Flow cytometry analysis of lesion sites of injured Cx3cr1GFP/+ chimeras. (A) Erythrocytes and GFP+ monocyte-macrophages (n = 3–5 mice). (B) M1 and M2 monocyte-macrophage populations (based on GFP and Ly6c). (i) Histogram for Iba-1. (ii) Quantitative kinetic analysis. ANOVA: F13,27 = 19.5, *p = 0.0001 relative to uninjured. (C) Pooled (n = 10–20) lesion sites (d7) analyzed for M1 and M2 markers and intracellular cytokines. (D) Monocyte-macrophage populations were separately sorted by flow cytometry from the lesion parenchyma (d5; n = 20 chimeras) and analyzed by qRT-PCR. The same experimental results were used, but each graph is presented relative to the expression of the reciprocal subset, defined as 100. (E) Analysis of CD45.1 injured mice, 3 days after SCI and 2 days after i.v. injection of monocytes (i.v. at d1; Cx3cr1GFP/+; with or without pertussis toxin [ptx] pretreatment). Student’s t test, n = 3 pools (of 2 mice) in each group: blood p = 0.197, SC p = 0.0001. Cells were Ly6c pregated. (F) Cx3cr1GFP/+ chimeras SC stained for GFP and CD31. n = 4 mice per time point, three depths. Data are represented as mean ± SEM. Scale bars represent 50 μm.
Figure 2
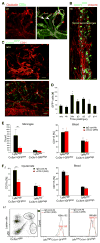
Figure 2. CCL2-Dependent Homing of M1 Monocyte-Macrophages to the Injured SC via the Leptomeninges
(A) SC leptomeninges stained for occludin and CD31. Arrowheads indicate vessels lacking tight junctions. n = 4 mice. (B) GFP+ cells in the leptomeninges of SC sections of injured Cx3cr1GFP/+ chimeras. n = 4 mice. (C) Whole-mount staining of SC leptomeninges dissected out from Cx3cr1GFP/+ chimeras. n = 4 mice per time point. (D) Quantification by flow-cytometric analysis of GFP+ cells in dissected SC leptomeninges lining the injured site. Values are absolute cell numbers per 10,000 live cells. ANOVA: F6,14 = 4.26, *p = 0.011 relative to uninjured. (E and F) Spinally injured Cx3cr1GFP/+ chimeras, intraperitoneally injected with CCL2 (or isotype-matched IgG) antibodies, analyzed on d1 for SC leptomeninges (E) or at d5 for lesion sites (F). CCL2 inhibition reduced Ly6chiCx3cr1-GFPlo trafficking. Two-way ANOVA: (E) n = 5–6 mice; F1,17 = 8.2, p = 0.01; (F) n = 4–7 mice; F1,17 = 8.8, p = 0.008. Values are absolute cell numbers in 0.5 cm SC tissue. As a control, blood was analyzed by two-way ANOVA: (E) F1,16 = 0, p = 0.96; (F) F1,20 = 1.8, p = 0.2. Data are represented as mean ± SEM. Scale bars represent 100 μm in (A) and (C) and 10 μm in (B). See also Figure S1.
Figure 3
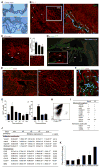
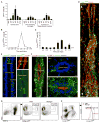
Figure 3. SCI Leads to Brain Choroid Plexus Activation and Monocyte Recruitment
(A–C) Morphological changes at the CP after SCI. (A) Cresyl violet staining; arrowheads indicate epithelial swelling, pointer indicates epithelial flattening or attenuation, and asterisk indicates ventricular flocculent material. n = 3–4 animals. (B and C) Staining of CP for tight junctions (Zo-1 in B and occludin in C) and CD31. Arrowheads mark areas with disorganized epithelial tight junctions. n = 3 animals per time point; qualitatively similar. (Cii) qRT-PCR analysis of isolated CP for Ocln, encoding occludin. n = 3–4 per time point. ANOVA: F = 6, p = 0.03. (D–I) GFP+ cells in the CP of SC-injured Cx3cr1GFP/+ chimeras. (D–F) GFP+ cells in CP sections (D) or whole mounts (E and higher magnification in F). n = 3–4 mice. (G–I) Flow cytometry analysis. (G) Quantitative kinetics. Values are absolute cell numbers per 10,000 live cells. ANOVA: (i) F5,12 = 3.12, p = 0.04; (ii) F3,15 = 27.05, *p < 0.0001 relative to uninjured. (H) Dot plot of CP (d0; chimera) for Iba-1 and GFP. (I) Marker expression; slash indicates heterogeneity; isotype controls served as negative controls; pools of ten mice. (J and K) CPs analyzed by (J) qRT-PCR (n = 3–4 per time point; ANOVA; *relative to uninjured) and (K) Luminex (pools of six mice; results of day 0 are presented as fold of change relative to noninjured; ANOVA; F6,9 = 4.96, p = 0.018). Data are represented as mean ± SEM. Scale bars represent 100 μm in (D) and (E), 50 μm in (A)–(C), and 10 μm in (F). See also Figure S2.
Figure 4
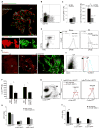
Figure 4. CP CD73 and VCAM-1 Orchestrate the Trafficking of Monocytes Maturing into M2 at the Injured SC Site
(A and B) CD73 expression by CP epithelium (A) and not by blood CD115+ monocytes (B) of spinally injured mice. (C) CD11b+CD115+CD45.1+ monocyte-macrophages in injured (d14) CD45.1→WT (CD45.2) chimeras, after treatment with APCP, a CD73 inhibitor. Student’s t test: n = 5–7 mice; SC, p = 0.007; blood, p = 0.31; percentages are of CD11b. (D) Monocyte-macrophages (CD11b+CFSE+) at the lesion site (d7) of Cd73/ mice and their controls. Student’s t test: n = 4–5 mice, p = 0.01. CFSE was i.v. injected 24 hr before injury. Values are absolute cell numbers in 0.5 cm SC tissue. (E) VCAM-1 expression by CP endothelium after SCI (n = 3–4 mice). (F and G) Monocyte-macrophages (GFP+Ly6c+CD11b+) in injured Cx3cr1GFP/+ chimeras (d5), i.v. injected with VLA-4 (PS2) or VCAM-1(MK2.7) or isotype-matched antibodies, as controls. n = 5 mice per group. Student’s t test: (F) VLA-4 antibodies: p = 0.01; VCAM-1 antibodies: p = 0.03. (Gi) Ly6cloCx3cr1-GFPhi p = 0.01; Ly6chiCx3cr1-GFPlo p = 0.35. (Gii) Two-way ANOVA: F1,23 = 17.24, p = 0.0004. Values are absolute cell numbers in 0.5 cm SC tissue, per 20,000 CD11b+ cells. (H) Monocyte-macrophages (GFP+Ly6c+CD11b+) in injured (d5) Cx3cr1GFP/+ chimera SC, i.v. injected with CD11b (or isotype matched) antibodies. n = 6 per group. Two-way ANOVA: F1,30 = 1.23, p = 0.28. Data are represented as mean ± SEM. Scale bars represent 50 μm in (Ai) and (E) and 20 μm in (Aii). See also Figure S3.
Figure 5
Figure 5. The CP-Dependent Recruited Cells Resolve Inflammation and Improve Recovery
VLA-4-VCAM-1 interaction (by VLA-4 or VCAM-1 antibodies) or CD73 activity (using APCP, or Cd73/) was inhibited in SC-injured mice; appropriate controls were included. (A) Cytokine Multiplex analysis of lesion site (d7). n = 4–8 pools of 3 mice. Two-way ANOVA: F5,74 = 11.1, p < 0.0001. (B) qRT-PCR analysis of lesion sites for genes encoding proinflammatory cytokines, presented as a heat map relative to the relevant control. (C) Hind limb motor function, assessed according to the BMS. Left: Motor score as a function of time. Right: Scores (d21) of individual mice. (i) n = 14–15 mice per group. Left: repeated ANOVA: Fbetween groups(2,40) = 60.8, p < 0.0001; right: ANOVA, F = 59, p < 0.0001. (ii) n = 12–15 mice per group. Left: repeated ANOVA: Fbetween groups(2,37) = 36.7, p < 0.0001; right: ANOVA: F = 32, p < 0.0001. (D) Quantification of lesion size (d21; an average of 3 depths) and representative pictures, as demarcated by Luxol and Nissl reactivity in longitudinal coronal sections. n = 8–10 mice per group. ANOVA: (i) F = 35, p = 0.02; (ii) F = 10.2, p = 0.0007. Data are represented as mean ± SEM. Scale bars represent 100 μm (D).
Figure 6
Figure 6. Homing of M2 Monocyte-Macrophages to the Injured Parenchyma through the Cerebrospinal Fluid
(A–C) Quantification of GFP+ cells in Cx3cr1GFP/+ chimeras after SCI (A) in sections (30 μm) of brains and SC. # in segments of 0.5 cm; n = 4–8 mice per time point. ANOVA: F = 4.7, *p < 0.0001 relative to uninjured. (B) GFP+ cell count in the CSF assessed by flow cytometry (results are presented as cell count per 100 μl CSF). n = 4–6 pools (of 8–12 mice); Student’s t test; * relative to uninjured. (C) GFP+ cell count in the CSF presented as percentages of live cells, as determined by flow cytometry. Dashed line represents blood monocyte percentages. n = 4–6 pools (of 8–12 mice); Student’s t test; * relative to uninjured. (D) GFP+ cells in association with vimentin-immunoreactive fiber structure at the edge of the central canal (delineated by Vimentin) of injured Cx3cr1GFP/+ chimeras. n = 3 mice. (E) SC sections immunostained for visualization of GFP+ cells in the central canal (delineated by Vimentin or Hoechst) of injured Cx3cr1GFP/+ chimeras. n = 3 mice each. (F) Central canal stained for vimentin together with ICAM-1 (i) or SDF-1(ii). (G and H) Cx3cr1GFP/+ chimeras were subjected to SCI concurrently with intracisternal Matrigel injection, and at d7, their SC were analyzed for monocyte-macrophages. Student’s t test: (G) n = 5–7 mice, p = 0.02; (H) n = 6–8 mice; Ly6cloCx3cr1-GFPhi p = 0.02; Ly6chiCx3cr1-GFPlo p = 0.66; one experiment representative of three. In (H), cells from both gates were plotted on the same histogram. Absolute numbers of cells in 0.5 cm SC tissue, per 20,000 CD11b+ cells, are indicated. Data are represented as mean ± SEM. Scale bars represent 20 μm in (D) and 10 μm in (E) and (F). See also Figure S4.
Figure 7
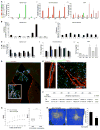
Figure 7. The CP-CSF Pathway Exhibits an M2-Supportive Milieu
(A–C) Luminex analysis of pooled (6–12 mice) samples of SC, CP, and CSF. (A) Samples analyzed for pro- (green) and anti- (red) inflammatory cytokines. Two-way ANOVA: (i) F = 32.1, p < 0.0001; Fday = 32.6, p < 0.0001; Fcyto = 65, p < 0.0001; (ii) F = 0.817, p = 0.73; Fday = 1.84, p = 0.13; Fcyto = 67.7, p < 0.0001; (iii) F = 1.82, p = 0.023; Fday = 0.78, p = 0.56; Fcyto = 13.9, p < 0.0001. (B) Fold increase at 24 hr postinjury relative to uninjured amount. ANOVA: (i) F = 38, p < 0.0001; (ii) F = 3.05, p = 0.014. (C) TGF-β isoforms. Two-way ANOVA: (i) F = 4.35, p = 0.017; Fday = 1.86, p = 0.17; Fcyto = 26, p = 0.0002; (ii) F = 0.67, p = 0.05; Fday = 3.9, p = 0.02; Fcyto = 2.5, p = 0.13. ANOVA: (iii) F = 12.14, p = 0.004. (D and E) TGF-β staining in (D) brain (n = 3 mice each; 3 depths, analyzed at d1, d3, and d7) or (E) central canal (CC; Vimentin+) of injured mice; right: in Cx3cr1GFP/+ chimeras (n = 3 mice). (F) qRT-PCR expression of isolated CP. ANOVA: n = 3–4 mice per time group; *relative to uninjured. (G and H) Injured C57BL/6 mice were ICV injected (d3) with CD115+ monocytes (isolated from BM; predominantly [>80%] Ly6chi). (G) Hind limb motor function assessment according to BMS. Left: Kinetic follow up. Right: Motor scores (d21) of individuals. Left: Repeated ANOVA: Fbetween groups(1,26) = 13, p = 0.001. Right: Student’s t test: n = 11 mice per group, p = 0.0001; repeated in three experiments. (H) Lesion size evaluation (d28) as demarcated by Luxol and Nissl reactivity in longitudinal coronal sections. Student’s t test: n = 9 mice per group, p = 0.001. Data are represented as mean ± SEM. Scale bars represent 50 μm in (D), 20 μm in (E), and 100 μm in (H).

Similar articles

Cited by

References

    1. Ajami B, Bennett JL, Krieger C, Tetzlaff W, Rossi FM. Local self-renewal can sustain CNS microglia maintenance and function throughout adult life. Nat Neurosci. 2007;10:1538–1543. - PubMed
    1. Anandasabapathy N, Victora GD, Meredith M, Feder R, Dong B, Kluger C, Yao K, Dustin ML, Nussenzweig MC, Steinman RM, Liu K. Flt3L controls the development of radiosensitive dendritic cells in the meninges and choroid plexus of the steady-state mouse brain. J Exp Med. 2011;208:1695–1705. - PMC - PubMed
    1. Arnold L, Henry A, Poron F, Baba-Amer Y, van Rooijen N, Plonquet A, Gherardi RK, Chazaud B. Inflammatory monocytes recruited after skeletal muscle injury switch into antiinflammatory macrophages to support myogenesis. J Exp Med. 2007;204:1057–1069. - PMC - PubMed
    1. Bartholomäus I, Kawakami N, Odoardi F, Schläger C, Miljkovic D, Ellwart JW, Klinkert WE, Flügel-Koch C, Issekutz TB, Wekerle H, Flügel A. Effector T cell interactions with meningeal vascular structures in nascent autoimmune CNS lesions. Nature. 2009;462:94–98. - PubMed
    1. Basso DM, Fisher LC, Anderson AJ, Jakeman LB, McTigue DM, Popovich PG. Basso Mouse Scale for locomotion detects differences in recovery after spinal cord injury in five common mouse strains. J Neurotrauma. 2006;23:635–659. - PubMed

Publication types

MeSH terms