. 2013 Mar 6;33(10):4216-33.
doi: 10.1523/JNEUROSCI.3441-12.2013.

Microglia regulate the number of neural precursor cells in the developing cerebral cortex

Affiliations

Microglia regulate the number of neural precursor cells in the developing cerebral cortex

Christopher L Cunningham et al. J Neurosci. .

Abstract

Neurogenesis must be properly regulated to ensure that cell production does not exceed the requirements of the growing cerebral cortex, yet our understanding of mechanisms that restrain neuron production remains incomplete. We investigated the function of microglial cells in the developing cerebral cortex of prenatal and postnatal macaques and rats and show that microglia limit the production of cortical neurons by phagocytosing neural precursor cells. We show that microglia selectively colonize the cortical proliferative zones and phagocytose neural precursor cells as neurogenesis nears completion. We found that deactivating microglia in utero with tetracyclines or eliminating microglia from the fetal cerebral cortex with liposomal clodronate significantly increased the number of neural precursor cells, while activating microglia in utero through maternal immune activation significantly decreased the number of neural precursor cells. These data demonstrate that microglia play a fundamental role in regulating the size of the precursor cell pool in the developing cerebral cortex, expanding our understanding of the mechanisms that regulate cortical development. Furthermore, our data suggest that any factor that alters the number or activation state of microglia in utero can profoundly affect neural development and affect behavioral outcomes.


Figures

Figure 1.
Figure 1.
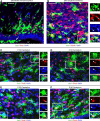
Iba1+ microglia colonize the proliferative zones of the developing primate forebrain. A, B, There are relatively few Iba1+ cells (green) in the developing macaque occipital cortex during early stages of neurogenesis (E50 and E65). A monolayer of Iba1+ cells is visible at the interface between the VZ and SVZ and between the SVZ and IZ, DAPI (blue). C, By E80 activated Iba1+ cells (green) colonize the SVZ at the interface between the inner fiber layer and the oSVZ (white arrow), DAPI (blue). D, At E100 there is a dense band of Iba1+ cells in the iSVZ (white arrow) and numerous Iba1+ cells in the oSVZ, DAPI (blue). E, Iba1+ cells (green) in the E80 SVZ are closely associated with Pax6+ (blue) and Tbr2+ (red) precursor cells. F, A dense band of Iba1+ cells (green) colonizes the iSVZ of the human neocortex by 10GW, DAPI (blue). The inset shows Iba1+ cells (green) are closely associated with proliferative PCNA+ precursor cells (red). Scale bars: A–D, 500 μm; E, 50 μm; F, 100 μm.
Figure 2.
Figure 2.
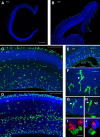
Iba1+ microglia colonize the rat proliferative zones. A, At E13 very few Iba1+ microglia (green) are present in the telencephalic wall. B, At E17 Iba1+ cells (green) are distributed sparsely throughout the neocortex. A small number are visible in the proliferative zones. At E17 and later ages Iba1+ cells densely populate the marginal zone and pia. C, By E19 increased numbers of Iba1+ cells (green) were present in the cortical VZ and SVZ. Iba1+ cells were virtually absent from the embryonic cortical plate. D, By E20 a dense band of Iba1+ cells (green) was present in the rodent VZ and iSVZ, and a second band of amoeboid-shaped Iba1+ cells was present at the interface between the oSVZ and IZ. E, Iba1+ cells (green) were also present throughout the choroid plexus (Ch Plx). Some Iba1+ microglia in the VZ evoked radial glial morphology but lacked a pial process. F–H, The RG-like Iba1+ cells were bipolar with somata in the VZ (white arrowheads), a single process that appeared to contact the ventricle, and a short process that ascended to the top of the VZ. These cells lacked the pial process characteristic of radial glial cells. I, Iba1+ cells (green) were also present along the surface of the ventricle in close contact with mitotic 4A4+ VZ precursor cells (red). J, Many of these cells had a rounded morphology and lacked processes, but did not stain positive for mitotic markers such as PH3. A–J, DAPI (blue). Scale bars: A–D, 250 μm; E, 100 μm; F–H, 20 μm; I, J, 10 μm.
Figure 3.
Figure 3.
Iba1+ microglia distribution varies across cortical areas. A, Line drawing of a single coronal section of E80 macaque occipital cortex that was stained for Iba1 and confocal imaged to produce the images shown in B–E. Location of panels indicated by labeled lines, and orientation is indicated with arrows. B–E, Iba1+ microglia (green) colonize the iSVZ and oSVZ in the occipital cortex, but the position of the dense Iba1+ cell bands varies across cortical areas. Scale bar: (in B) B–E, 250 μm. Blue, DAPI.
Figure 4.
Figure 4.
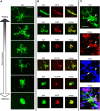
Iba1+ cells in the prenatal neocortex are microglia. A, The morphology of Iba1+ cells in the E80 macaque neocortex ranged from cells with a small soma and fine ramified processes that appeared to be in a resting state, to cells with an activated morphology–a large soma with a few thick processes (Rezaie and Male, 1999). The overwhelming majority of Iba1+ cells in the E50–E100 macaque neocortex and the E13–P4 rodent neocortex had an activated morphology. B, Iba1+ cells (green) coexpressed traditional markers of activated microglia including CD14, F4/80, CD11b, HLADR, and iNOS (red). C, Most Iba1+ cells (green) in the prenatal brain expressed the mitotic marker PCNA (red). The nucleus of this Iba1+ cell is indicated with a white arrow, the PCNA+ cell being phagocytosed is indicated with a white arrowhead. Blue, DAPI. Scale bars: A, C, 20 μm; B, 10 μm.
Figure 5.
Figure 5.
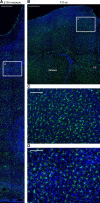
Microglia are distributed evenly across the entire cerebral cortex after neurogenesis. A, D, Coronal sections of E150 macaque occipital costained for Iba1 (green) and DAPI (blue). B, C, Coronal sections of P13 rat cortex costained for Iba1 (green) and DAPI (blue). White inset boxes show location of higher magnification panels shown in C, D. In both species many of the microglia in the cortical gray matter exhibit an activated morphology. CC, Corpus callosum. Scale bars: A, B, 500 μm; C, D, 150 μm.
Figure 6.
Figure 6.
Iba1+ microglia phagocytose neural precursor cells in the developing neocortex. A–D, Iba1+ microglia (green) in the E80 macaque SVZ contact and envelope Tbr2+ neural precursor cells (red). E, An Iba1+ microglial cell (green) enveloping a PCNA-positive mitotic cell (red). F, A Tbr2+ nucleus (red, white arrowhead) inside an Iba1+ microglial cell (green). The nucleus of the microglial cell (DAPI, blue) is indicated by a white arrow. G, H, Microglia (green) contained Tbr2+ (red) puncta indicating degradation after phagocytosis. I, J, Microglia (green) contact and envelope Pax6+ precursor cells (red). Panels show confocal optical plane images. Nuclei stained with DAPI (blue). Scale bar: (in A) A–J, 10 μm.
Figure 7.
Figure 7.
The proportion of Tbr2+ neural precursor cells targeted by Iba1+ microglia increases during later stages of cortical neurogenesis. The proportion of all Tbr2+ cells in a 200-μm-wide bin that is targeted by Iba1+ microglia is ∼2% at the start of neurogenesis (E50), 3% during deep layer neurogenesis (E65), and rises to >33% at the end of neurogenesis (E100).
Figure 8.
Figure 8.
Time-lapse imaging demonstrates that microglia contact and phagocytose VZ and SVZ cells. A–C, Microglia labeled with fluorescent lectins (green, asterisks) phagocytose DsRed+ precursor cells (red, white arrowheads) in slice cultures. The microglia first contacted the precursor cells and then within 30 min to 10 h phagocytosed the DsRed+ cells. B, Some microglia phagocytosed multiple precursor cells during time-lapse recording. Confocal optical plane imaging confirmed that DsRed+ cells were located within labeled microglia. Imaging interval (h:m) for A and B is displayed at the top of the figure. Imaging interval for C is displayed at the bottom of the figure. Images in A and B were taken with a 10× objective; images in C were taken with a 40× objective.
Figure 9.
Figure 9.
Iba1+ microglia (green) target and phagocytose apoptotic cells, mitotic neural precursor cells, and neurons in the proliferative zones. A, Iba1+ cells (green) target cleaved caspase 3 (CC3)+ cells (red, white arrowhead). The DAPI+ nucleus (blue) of the Iba1+ cell is indicated with a white arrow. The vast majority of targeted neural precursor cells were CC3-negative. B, A Tbr2+ cell (red, arrowhead) expressing PCNA (blue) is targeted by an Iba1+ microglial cell (green). The microglial cell is also PCNA+ (blue, arrow). The majority of precursor cells targeted by microglia were PCNA+. C, Iba1+ cells (green) also target NeuN+ cells in the proliferative zones (red). Scale bar: (in A) A–C, 5 μm.
Figure 10.
Figure 10.
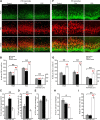
Manipulating the activation state of microglia changes the number of neural precursor cells in the prenatal brain. The number of Pax6+ and Tbr2+ precursor cells was quantified in 200-μm-wide bins that spanned from the ventricular surface through the proliferative zones at E19 and at P2. A, B, At E19 Dox treatment significantly elevated the number of Tbr2+ cells per bin, while LPS treatment significantly reduced the number of Pax6+ and Tbr2+ cells per bin, and reduced the combined thickness of the VZ/iSVZ. C, D, LPS treatment increased the proportion of Iba1+ cells that express high levels of iNOS, a marker of activated microglia (Verney et al., 2010), and the proportion of Iba1+ cells that expressed high levels of the cytokine IL-1β. The proportion of Iba1+ cells that expressed these markers was slightly decreased in the Dox group. E, LPS slightly elevated the number of CC3+ cells per hemisphere, but the difference was not significant. F, G, At P2 Dox treatment significantly increased the number of Pax6+ and Tbr2+ cells and increased the combined thickness of the VZ/iSVZ, while LPS significantly decreased the number of Tbr2+ cells. H, Dox treatment significantly reduced the number of CC3+ cells per hemisphere. I, Dox treatment significantly increased the number of NeuN+ cells in the oSVZ. Brackets denote ANOVA significance, *p < 0.05; **p < 0.01. Red asterisks indicate post hoc significance, single red asterisk: p < 0.05; double red asterisk: p < 0.01. Error bars show SE. Scale bars: A, 100 μm; B, 50 μm.
Figure 11.
Figure 11.
Minocycline treatment significantly increased the number of Tbr2+ neural precursor cells in the prenatal proliferative zones. A, A control organotypic slice after 3 d in culture stained for Tbr2+ precursor cells (red) and DAPI (blue). B, The number of Tbr2+ cells was significantly increased in slices treated for 3 d with 100 μm minocycline. Scale bar, 50 μm.
Figure 12.
Figure 12.
Eliminating microglia from the developing cerebral cortex increases the number of neural precursor cells. A, Iba1+ microglia (green) populate an organotypic slice prepared from the E16 cerebral cortex and cultured for 3 d. B, Addition of liposomal clodronate to the culture media for the first 24 h in culture eliminated 97% of microglia from the cerebral cortex. C, A coronal section of a P1 rat brain stained for microglia (green) and nuclei (DAPI, blue). Microglia populate the proliferative zones. D, The number of microglia in the P1 cerebral cortex is reduced by 90% after in utero intraventricular injections of liposomal clodronate at E20. A–D, DAPI (blue). E, F, Liposomal clodronate decreases the number of microglia (green) and significantly increases the number of Pax6+ precursor cells (red) and Tbr2+ precursor cells (G, H). White arrowheads indicate precursor cells targeted or phagocytosed by microglial cells. I, Histogram showing that 3 d after E20 in utero intraventricular injection of liposomal clodronate there is a significant decrease in the number of microglia, and a significant increase in the number of Pax6+ cells and Tbr2+ cells. Double red asterisk: p < 0.01; single red asterisk: p < 0.05. Scale bars: A, 500 μm; C, 200 μm; F, 50 μm.
Figure 13.
Figure 13.
Iba1+ microglia colonize proliferative regions in multiple structures in the developing macaque CNS. A, Iba1+ microglia (green) colonize proliferative zones in the medial wall of the telencephalon of E80 macaques where they target Tbr2+ precursor cells (red). Microglial often migrate along the surface of the lateral ventricle (arrow). B, Iba1+ microglia (green) colonize the proliferative zones of the E80 macaque ganglionic eminence and target PCNA+ precursor cells (red). Insets show phagocytosed PCNA+ precursor cells (arrowheads) within Iba1+ microglia (arrows). C–F, Iba1+ cells (green) are present in the E100 macaque cerebellum where they target Pax6+ precursor cells (red, arrowheads). Scale bars, 20 μm. Blue, DAPI. LV, Lateral ventricle.
Figure 14.
Figure 14.
Iba1+ microglia colonize proliferative regions in multiple structures in the developing rat brain. A, Iba1+ microglia (green) colonize proliferative zones in the developing hippocampal formation of the E20 rat where they target Tbr2+ precursor cells (red). B, Iba1+ microglia (green) concentrate around proliferative Tbr2+ precursor cells (red) in the subpial neurogenic zone (Li et al., 2009) of the developing hippocampal formation in P0 rat where they target Tbr2+ precursor cells (red). Iba1+ microglia also target Tbr2-negative cells in the developing hippocampal formation. C, Iba1+ microglia (green) form a monolayer immediately superficial to the proliferative ventricular zone (VZ) of the E20 rat third ventricle. D, Examples of Iba1+ microglia (green) targeting and phagocytosing Tbr2+ precursor cells (red) in the developing hippocampal formation of E20 and P0 rat. White arrowheads indicate Tbr2+ cells enveloped by Iba1+ microglia. Images are optical plane sections obtained from a confocal microscope. Blue, DAPI. Scale bars: (in A) A–C, 100 μm; D, 20 μm.

Similar articles

Cited by

References

    1. Alliot F, Godin I, Pessac B. Microglia derive from progenitors, originating from the yolk sac, and which proliferate in the brain. Brain Res Dev Brain Res. 1999;117:145–152. - PubMed
    1. Amaral DG, Schumann CM, Nordahl CW. Neuroanatomy of autism. Trends Neurosci. 2008;31:137–145. - PubMed
    1. Andjelkovic AV, Nikolic B, Pachter JS, Zecevic N. Macrophages/microglial cells in human central nervous system during development: an immunohistochemical study. Brain Res. 1998;814:13–25. - PubMed
    1. Ashwell K. The distribution of microglia and cell death in the fetal rat forebrain. Brain Res Dev Brain Res. 1991;58:1–12. - PubMed
    1. Barrientos RM, Frank MG, Watkins LR, Maier SF. Aging-related changes in neuroimmune-endocrine function: implications for hippocampal-dependent cognition. Horm Behav. 2012;62:219–227. - PMC - PubMed

Publication types

MeSH terms