Comparison of DNA decatenation by Escherichia coli topoisomerase IV and topoisomerase III: implications for non-equilibrium topology simplification
- PMID: 23460205
- PMCID: PMC3632123
- DOI: 10.1093/nar/gkt136
Comparison of DNA decatenation by Escherichia coli topoisomerase IV and topoisomerase III: implications for non-equilibrium topology simplification
Abstract
Type II topoisomerases are essential enzymes that regulate DNA topology through a strand-passage mechanism. Some type II topoisomerases relax supercoils, unknot and decatenate DNA to below thermodynamic equilibrium. Several models of this non-equilibrium topology simplification phenomenon have been proposed. The kinetic proofreading (KPR) model postulates that strand passage requires a DNA-bound topoisomerase to collide twice in rapid succession with a second DNA segment, implying a quadratic relationship between DNA collision frequency and relaxation rate. To test this model, we used a single-molecule assay to measure the unlinking rate as a function of DNA collision frequency for Escherichia coli topoisomerase IV (topo IV) that displays efficient non-equilibrium topology simplification activity, and for E. coli topoisomerase III (topo III), a type IA topoisomerase that unlinks and unknots DNA to equilibrium levels. Contrary to the predictions of the KPR model, topo IV and topo III unlinking rates were linearly related to the DNA collision frequency. Furthermore, topo III exhibited decatenation activity comparable with that of topo IV, supporting proposed roles for topo III in DNA segregation. This study enables us to rule out the KPR model for non-equilibrium topology simplification. More generally, we establish an experimental approach to systematically control DNA collision frequency.
Figures


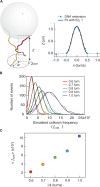
 >, for each turn. (C) Mean collision frequency, <
 >, as a function of imposed turns, n. Values are colour-coded based on the corresponding number of imposed turns shown in B.

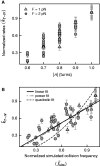
 , are plotted as a function of bead rotation (n) for applied forces of 1 pN (triangles) and 2 pN (circles). Error bars are calculated through propagation of uncertainties (SD) in the initial fit parameters. (B)
  as a function of the normalized simulated collision frequency,
  , fit with linear (solid line), quadratic (dashed line) and power (short-long dashed line) functions. The power fit,
  returned a power close to 1 (A = 0.90 ± 0.01 and P = 1.10 ± 0.03,
  ). The data are poorly fit by a quadratic relation (
 ) as evidenced by the 2-fold increase in reduced chi-square,
  . Fitting to a line returned a slope of 0.87 ± 0.01 and a linear correlation coefficient of 0.75 with
  .
.
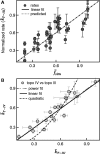
 are plotted as a function of the normalized collision frequency from MC simulations,
  , and fit to a line, with slope = 1.00 ± 0.01,
  , and a linear correlation coefficient = 0.76. Error bars are calculated through propagation of uncertainties (SD) in the initial fit parameters. (B) Normalized rates of topo IV are directly compared with the normalized rates of topo III in a scatter plot, in which each point corresponds to the two normalized unlinking rates (topo III -x, and topo IV -y) measured with double tethers of comparable geometry at the same imposed rotation. Fitting the scatter plot with a linear function gave a slope S = 0.97 ± 0.02 with linear correlation coefficient 0.78 and
  . Fitting to power function (y = AxP) returned A = 0.99 ± 0.04 and P = 1.02 ± 0.05 with
  . Fitting to a quadratic function (y = Ax2) resulted in a significantly increased reduced chi-squared value,
  .
.Similar articles
-
Single-molecule analysis uncovers the difference between the kinetics of DNA decatenation by bacterial topoisomerases I and III.Nucleic Acids Res. 2014 Oct;42(18):11657-67. doi: 10.1093/nar/gku785. Epub 2014 Sep 17. Nucleic Acids Res. 2014. PMID: 25232096 Free PMC article.
-
Topoisomerase IV, not gyrase, decatenates products of site-specific recombination in Escherichia coli.Genes Dev. 1997 Oct 1;11(19):2580-92. doi: 10.1101/gad.11.19.2580. Genes Dev. 1997. PMID: 9334322 Free PMC article.
-
Contrasting enzymatic activities of topoisomerase IV and DNA gyrase from Escherichia coli.J Biol Chem. 1996 Dec 6;271(49):31549-55. doi: 10.1074/jbc.271.49.31549. J Biol Chem. 1996. PMID: 8940171
-
What makes a type IIA topoisomerase a gyrase or a Topo IV?Nucleic Acids Res. 2021 Jun 21;49(11):6027-6042. doi: 10.1093/nar/gkab270. Nucleic Acids Res. 2021. PMID: 33905522 Free PMC article. Review.
-
Supercoiling, R-loops, Replication and the Functions of Bacterial Type 1A Topoisomerases.Genes (Basel). 2020 Feb 27;11(3):249. doi: 10.3390/genes11030249. Genes (Basel). 2020. PMID: 32120891 Free PMC article. Review.
Cited by
-
Duplex DNA and BLM regulate gate opening by the human TopoIIIα-RMI1-RMI2 complex.Nat Commun. 2022 Jan 31;13(1):584. doi: 10.1038/s41467-022-28082-5. Nat Commun. 2022. PMID: 35102151 Free PMC article.
-
Single-molecule analysis uncovers the difference between the kinetics of DNA decatenation by bacterial topoisomerases I and III.Nucleic Acids Res. 2014 Oct;42(18):11657-67. doi: 10.1093/nar/gku785. Epub 2014 Sep 17. Nucleic Acids Res. 2014. PMID: 25232096 Free PMC article.
-
Diversity and Functions of Type II Topoisomerases.Acta Naturae. 2021 Jan-Mar;13(1):59-75. doi: 10.32607/actanaturae.11058. Acta Naturae. 2021. PMID: 33959387 Free PMC article.
-
The Dynamic Interplay Between DNA Topoisomerases and DNA Topology.Biophys Rev. 2016 Sep;8(3):221-231. doi: 10.1007/s12551-016-0206-x. Epub 2016 Jul 2. Biophys Rev. 2016. PMID: 27942270 Free PMC article.
-
Systematic Comparison of Atomistic Force Fields for the Mechanical Properties of Double-Stranded DNA.J Chem Theory Comput. 2024 Mar 12;20(5):2261-2272. doi: 10.1021/acs.jctc.3c01089. Epub 2024 Feb 27. J Chem Theory Comput. 2024. PMID: 38411091 Free PMC article.
References
-
- Champoux JJ. DNA topoisomerases: structure, function, and mechanism. Annu. Rev. Biochem. 2001;70:369–413. - PubMed
-
- Corbett KD, Berger JM. Structure, molecular mechanisms, and evolutionary relationships in DNA topoisomerases. Annu. Rev. Biophys. Biomol. Struct. 2004;33:95–118. - PubMed
-
- Forterre P, Gribaldo S, Gadelle D, Serre MC. Origin and evolution of DNA topoisomerases. Biochimie. 2007;89:427–446. - PubMed
-
- Schoeffler AJ, Berger JM. DNA topoisomerases: harnessing and constraining energy to govern chromosome topology. Q. Rev. Biophys. 2008;41:41–101. - PubMed
-
- Wang JC. Cellular roles of DNA topoisomerases: a molecular perspective. Nat. Rev. Mol. Cell Biol. 2002;3:430–440. - PubMed
Publication types
MeSH terms
Substances
Grants and funding
LinkOut - more resources
Full Text Sources
Other Literature Sources
Molecular Biology Databases

