. 2013 Mar 4:6:2.
doi: 10.3389/fnmol.2013.00002. eCollection 2013.

Genetically encoded calcium indicators for multi-color neural activity imaging and combination with optogenetics

Affiliations

Genetically encoded calcium indicators for multi-color neural activity imaging and combination with optogenetics

Jasper Akerboom et al. Front Mol Neurosci. .

Abstract

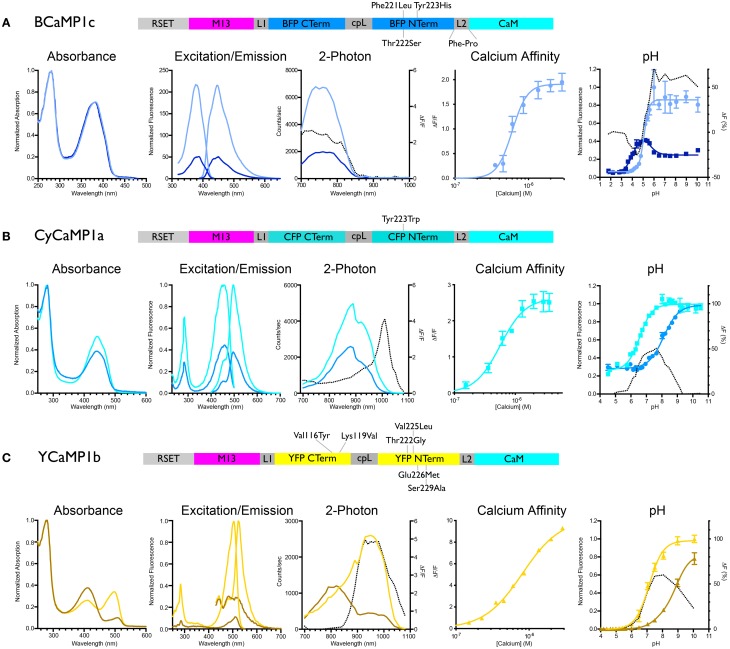
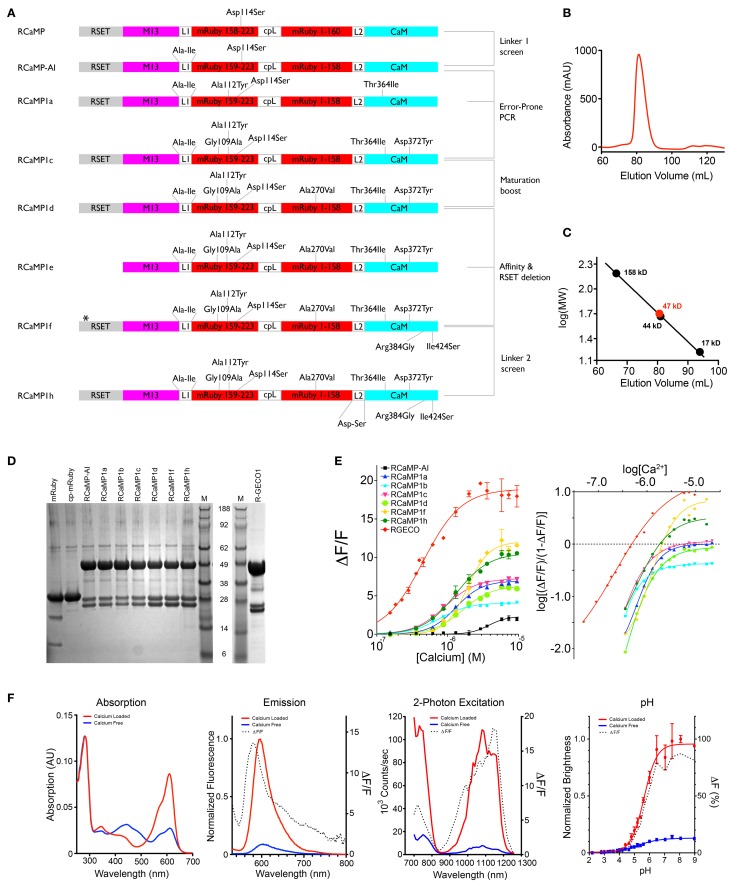
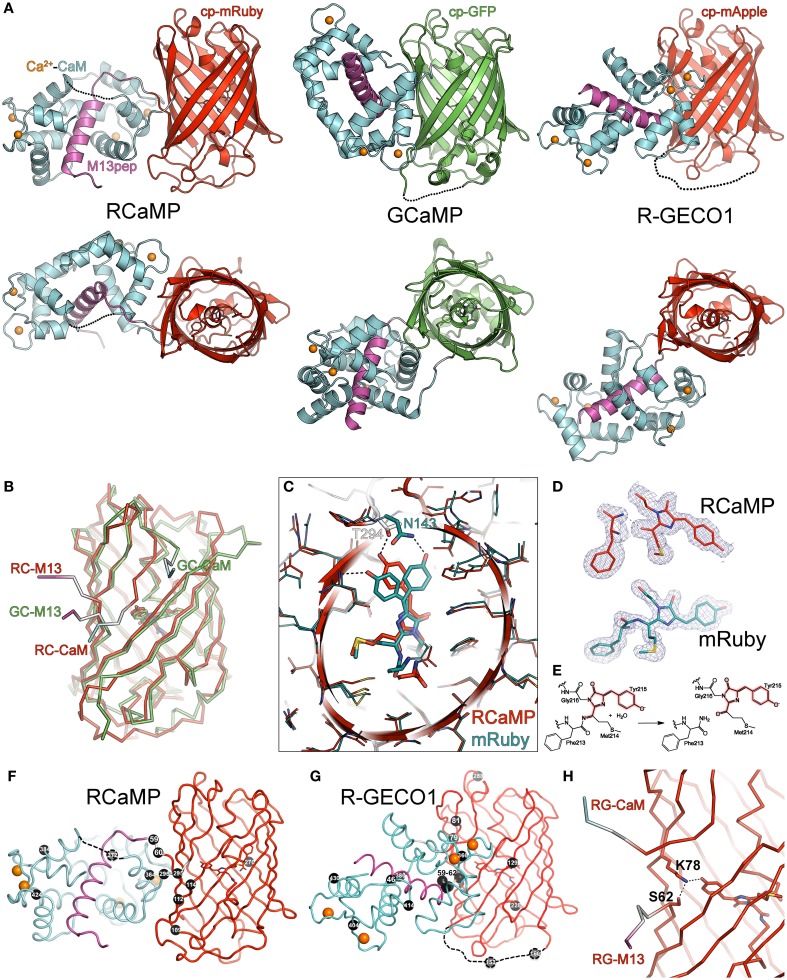
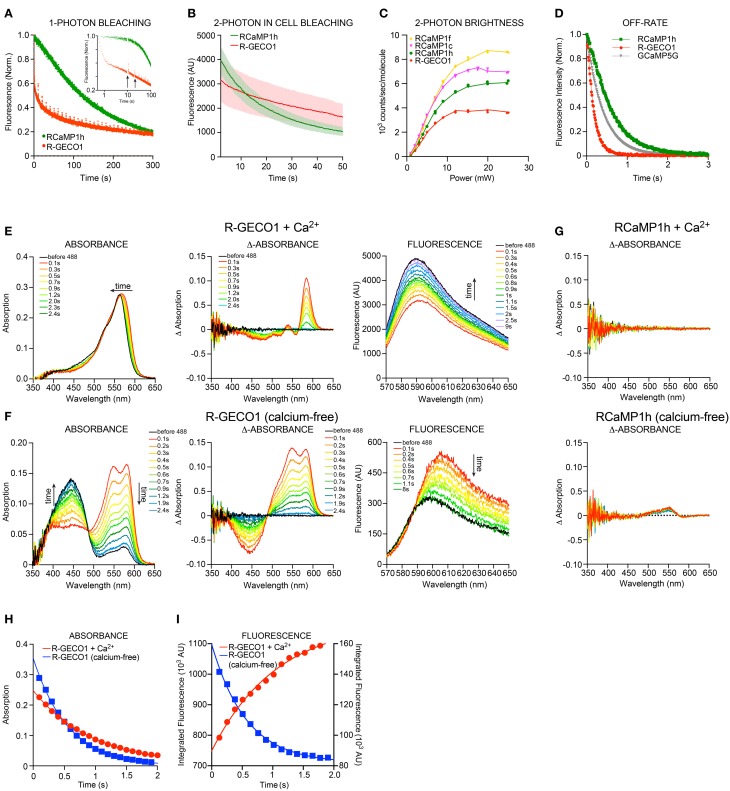
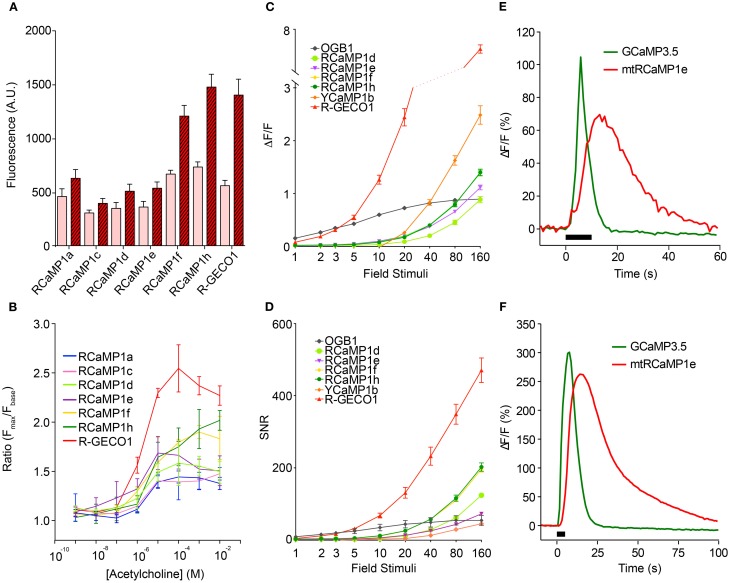
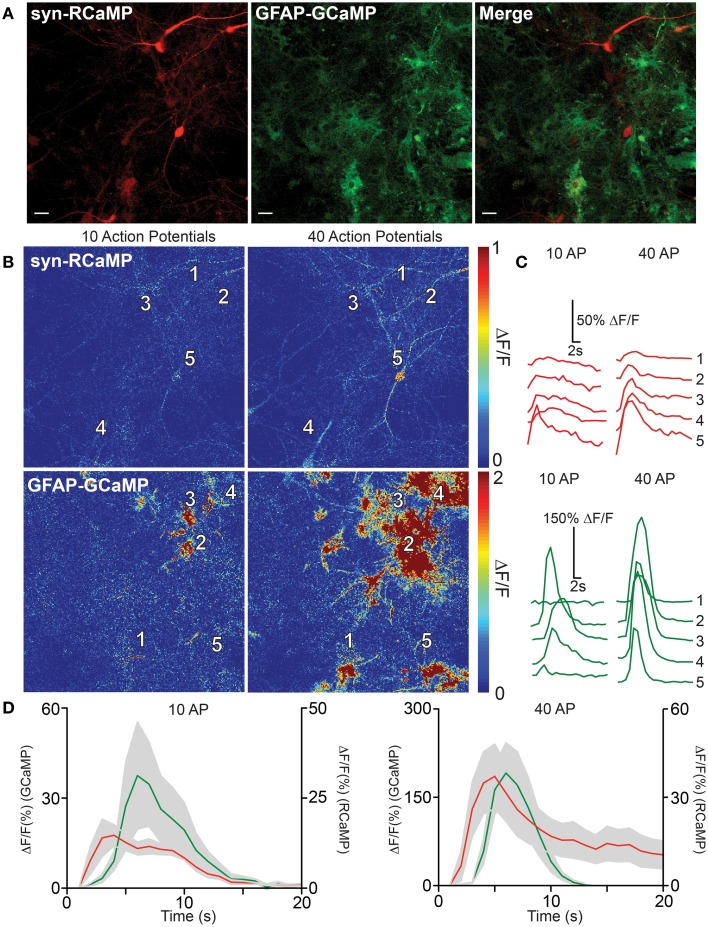
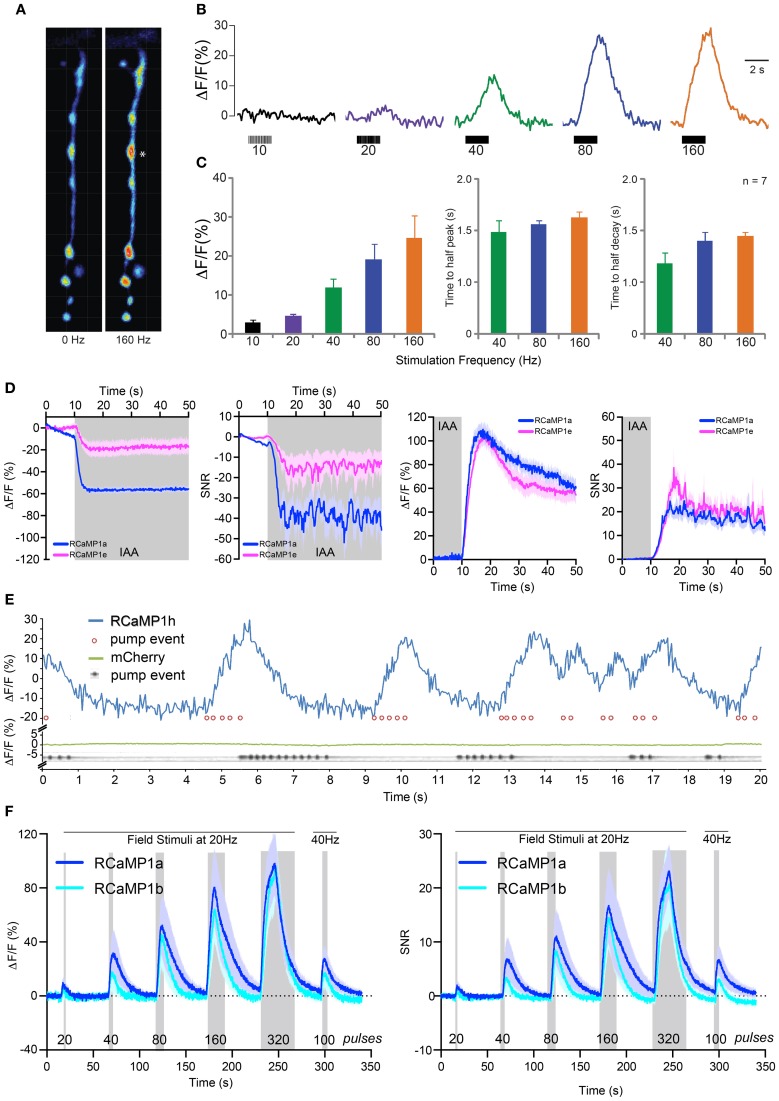
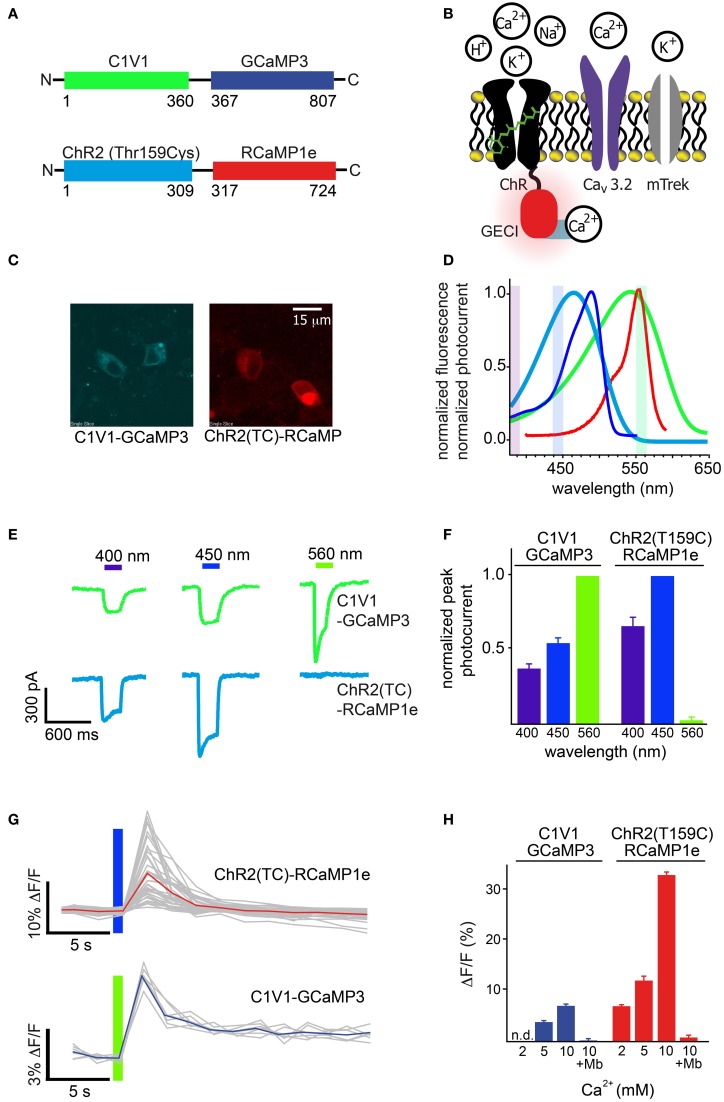
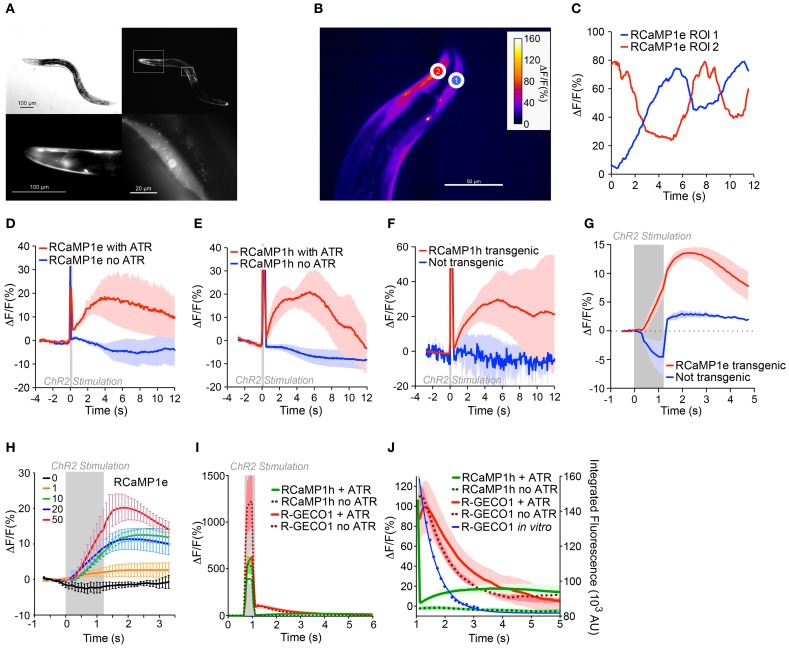
Genetically encoded calcium indicators (GECIs) are powerful tools for systems neuroscience. Here we describe red, single-wavelength GECIs, "RCaMPs," engineered from circular permutation of the thermostable red fluorescent protein mRuby. High-resolution crystal structures of mRuby, the red sensor RCaMP, and the recently published red GECI R-GECO1 give insight into the chromophore environments of the Ca(2+)-bound state of the sensors and the engineered protein domain interfaces of the different indicators. We characterized the biophysical properties and performance of RCaMP sensors in vitro and in vivo in Caenorhabditis elegans, Drosophila larvae, and larval zebrafish. Further, we demonstrate 2-color calcium imaging both within the same cell (registering mitochondrial and somatic [Ca(2+)]) and between two populations of cells: neurons and astrocytes. Finally, we perform integrated optogenetics experiments, wherein neural activation via channelrhodopsin-2 (ChR2) or a red-shifted variant, and activity imaging via RCaMP or GCaMP, are conducted simultaneously, with the ChR2/RCaMP pair providing independently addressable spectral channels. Using this paradigm, we measure calcium responses of naturalistic and ChR2-evoked muscle contractions in vivo in crawling C. elegans. We systematically compare the RCaMP sensors to R-GECO1, in terms of action potential-evoked fluorescence increases in neurons, photobleaching, and photoswitching. R-GECO1 displays higher Ca(2+) affinity and larger dynamic range than RCaMP, but exhibits significant photoactivation with blue and green light, suggesting that integrated channelrhodopsin-based optogenetics using R-GECO1 may be subject to artifact. Finally, we create and test blue, cyan, and yellow variants engineered from GCaMP by rational design. This engineered set of chromatic variants facilitates new experiments in functional imaging and optogenetics.

Keywords: calcium imaging; genetically encoded calcium indicator; multi-color imaging; optogenetics; protein engineering.


Figures

Figure 1
Figure 1
Biochemical characterization of BCaMP, CyCaMP, and YCaMP. Schematic for each color variant is given. For all variants, the lighter-colored lines indicate calcium-saturated spectra, darker-colored lines indicate calcium-free spectra. The dotted line in the 2-photon graph indicates ΔF/F, in the pH graph it indicates the difference in fluorescence (%). (A) BCaMP1c, (B) CyCaMP1a, (C) YCaMP1b.
Figure 2
Figure 2
RCaMP engineering and in vitro characterization. (A) Schematic of the RCaMP design process. The star indicates a deletion of two histidines in the poly-histidine tag in RCaMP1f. Numbering is based on RCaMP-AI. (B) Size exclusion chromatogram of purified Ca2+-RCaMP1h. (C) Calibration curve calculated from molecular weight standards and the estimated mass of RCaMP (47 kD) based on elution volume (bottom). The calculated mass of RCaMP is ~49.2 kD, indicating that RCaMP exists primarily as a monomer in solution. (D) SDS-PAGE of mRuby, RCaMP variants, and R-GECO1. Lane M indicates molecular size marker SeeBlue Plus 2 (Invitrogen). The calculated mass of RCaMP is 49.2 kD (for R-GECO1, 46.9 kD), and the fragments resulting from imine hydrolysis at the chromophore are calculated as 23.2 and 25.9 kD (for R-GECO1, 20.8 and 26.1 kD). For mRuby the calculated masses are 29.3 kD for full-length and 10.9 kD and 18.4 kD for the putative fragments (calculated with AphaEase FC, Genetic Technologies Inc., USA). (E) Ca2+ titrations of purified protein (left). Right: Hill plot of data shown left with linear range of sensors at lower calcium concentrations. (F) In vitro spectroscopic analysis of RCaMP1f (from left to right): Absorption, emission, 2-photon spectra, and pH titrations. 2-photon spectra were acquired from 700–1080 nm with Ti: Sapphire illumination, and from 1080–1260 nm with OPO illumination.
Figure 3
Figure 3
Crystal structures of RCaMP, mRuby, and R-GECO1. (A) Crystal structures of Ca2+-bound RCaMP, GCaMP, and R-GECO1 in two orthogonal views. The fluorescent protein domain of each sensor was superimposed. Labels indicate the coloring of the domains of RCaMP; coloring of GCaMP and R-GECO1 is identical except that the cpGFP domain is colored green. (B) Ribbon diagram of the superimposed circularly permuted fluorescent protein domains of RCaMP and GCaMP illustrating structural differences at the circular permutation site. Coloring is the same as in (A). Linker connections to the M13 peptide and CaM domains are labeled. (C) Superposition of the cp-mRuby domain of RCaMP with mRuby. Amino acids are displayed as thin sticks, except the chromophore and select chromophore-interacting residues, which are shown as thicker sticks. RCaMP is additionally displayed as a cartoon, colored as in (A). mRuby is colored cyan. Select hydrogen bonds are displayed as dashed lines. View is oriented and clipped to show the center of the fluorescent protein barrels. (D) The chromophores and preceding amino acid of RCaMP (top, red) and mRuby (bottom, cyan) with the 2Fo-Fc omit electron density map contoured at 1σ superimposed. Note the absence of electron density in RCaMP, indicating backbone cleavage. (E) Proposed hydrolysis of the peptide bond in RCaMP. Atoms involved in the extended π-system of the fluorescent chromophore in red. (F) Ribbon depiction of RCaMP with sites of engineering shown as black spheres, with corresponding amino acid number shown. Orientation is as shown for (A). (G) As in (F), but for R-GECO1. Depicted sites of engineering from Zhao et al. (2011a). (H) In Ca2+-bound R-GECO1, Lys78 forms an ionic hydrogen bond with the chromophore, stabilized by Ser62.
Figure 4
Figure 4
Biophysical characterization RCaMP and R-GECO1. (A) 1-photon Photobleaching of RCaMP1h and R-GECO1 compared. Note the fast decay during the first second and partial re-activation of R-GECO1 during darkness (after each 10 s) of R-GECO1 (arrows). (B) 2-photon photobleaching of RCaMP1h and R-GECO1 in HEK293 cells. (C) 2-photon peak brightness spectra (Mütze et al., 2012) of select RCaMPs and R-GECO1 compared. (D) Stopped-flow fluorescence of R-GECO1, GCaMP5G, and RCaMP1h. Protein concentration, 1 μM. Initial [Ca2+], 10 μM. [EGTA], 10 mM. (E,F) Transient response of 10 μ M R-GECO1 following a pulse of 488-nm light at 600 mW/cm2 for 1 s, in +Ca2+ buffer (D) and Ca2+-free buffer (E), showing time evolution of absolute absorbance (left panels), transient absorbance pre-488 and post-488 (middle panels), and absolute fluorescence induced by weak 561-nm excitation before and following the 488-nm pulse (right panels). (G) In contrast with (D) and (E), 10 μM Ca2+-free RCaMP1h shows only a very small increase in absorbance around 550 nm (lower panel) and no change in absorbance in +Ca2+ buffer (upper panel). No differences are seen in fluorescence (data not shown). (H) The transient absorption decay in time is well fit by exponential decay kinetics with e-1 time constants of 0.96 s and 0.58 s for +Ca2+ and no-Ca2+, respectively. (I) R-GECO1 transient fluorescence is also well fit by exponential decay kinetics with e-1 time constants of 1.01 s and 0.56 s for +Ca2+ buffer and no-Ca2+ buffer, respectively. Note that the transient fluorescence increases following the 488-nm pulse in no-Ca2+ buffer, but decreases in +Ca2+ buffer.
Figure 5
Figure 5
Characterization of the RCaMP, R-GECO1, and YCaMP in cells. (A) Baseline and peak fluorescence of HEK293 cells expressing the red GECIs, in response to acetylcholine (Ach)-induced Ca2+ mobilization. (B) Fluorescence response (Fmax/Fbaseline) for the red GECIs vs. Ach concentration. (C) Fluorescence increase (ΔF/F)max of the red and yellow GECIs, as well as OGB-1, in cultured rat hippocampal neurons following electrode-evoked action potential trains. Plotted is mean ± sem (n = 13–16). (D) Signal-to-noise ratio of the data shown in (C). Plotted is mean ± sem (n = 13–16). (E,F) ΔF/F time-lapse traces from rat cortical neurons expressing RCaMP1e in mitochondria (red) and GCaMP3.5 in cytosol (green) after caffeine-mediated Ca2+ release from ER (E) and KCl-mediated Ca2+ influx from extracellular medium (F).
Figure 6
Figure 6
RCaMP visualization in co-culture with GCaMP-expressing astrocytes. (A) Expression of RCaMP1h and GCaMP5G in cultured rat hippocampal neurons and astrocytes using tissue specific promoters. Scale bars: 10 μm. (B) Heat maps of neuronal (top) and astrocyte (bottom) activity in response to 10 (left) and 40 (right) field stimulations. Five ROIs are specified surrounding neuron and astrocyte somata. (C) Single-trial neuron (top) and astrocyte (bottom) calcium activity in selected ROIs, following 10 (left) and 40 (right) evoked action potentials. (D) The average GECI responses of neurons (red) and astrocytes (green) following 10 (left) and 40 (right) field stimulations. Mean ± sem. (n = 5) shown.
Figure 7
Figure 7
RCaMP visualization in Drosophila larvae, C. elegans, and zebrafish. (A) Boutons expressing RCaMP1f in Drosophila larval muscle 13 before (left) and at the end of (right) a 160 Hz, 2 s train of nerve stimulations. Asterisk indicates typical proximal bouton used for ROI measurements. (B) Raw traces from single ROI (*) showing percent changes in fluorescence in response to a range of stimulation frequencies. (C) Fluorescence change (mean ± s.e.m.) ΔF/F in response to increasing stimulation frequency (left), time to reach half peak amplitude (mean ± s.e.m., middle) and time to reach half decay at 40, 80, and 160 Hz (right, mean ± s.e.m.). (D) RCaMP1a and RCaMP1e responses to isoamyl alcohol (IAA, 10-4 v/v) presentation (left two panels) and removal (right two panels) in C. elegans AWC olfactory neurons. Both ΔF/F and SNR are shown for presentation and removal. Note that odor decreases calcium in these neurons. Traces are mean ± s.e.m. (E) RCaMP1h was expressed in the pharynx muscular pump and imaged for 20 s (blue trace) while the structure was pumping. Pump events were annotated based on visible movements of the terminal bulb (red circles). Ca2+ trace shows large increases following/concomitant with bouts of pharynx pump events. To verify that movement artifacts would not cause such signals, mCherry expressed in the pharynx muscle was analogously imaged in a separate experiment (green trace); here, pump events were detected in a kymograph showing the opening of the pharynx lumen (gray trace). (F) Imaging of RCaMP1a (n = 12) and RCaMP1b (n = 8) in zebrafish trigeminal neurons. ΔF/F (left) and SNR (right) in response to trains of field stimulations of increasing length (shaded region). Mean ± s.e.m. shown.
Figure 8
Figure 8
Simultaneous optical stimulation and detection of calcium influx in HEK293 cells. (A) Schematic of constructs, ChR2(TC) directly fused to RCaMP1e, and C1V1 directly fused to GCaMP3. Colors correspond to (D). (B) Schematic of the channels (ChR-GECI, CaV3.2, mTrek) and ions involved in the Ca2+ influx assay. ChR-induced membrane depolarization leads to opening of CaV3.2; calcium influx is monitored via GECI fluorescence increases. The potassium channel mTrek allows hyperpolarization of HEK cells via extracellular [K+]. (C) Confocal fluorescence micrographs of HEK cells expressing each construct. (D) Normalized excitation spectra of the sensors (GCaMP3 and RCaMP1e), and action spectra of the effectors (ChR2(TC) and C1V1), colored as in (A). (E) Typical single-trial current traces of C1V1-GCaMP3 (green) and ChR2(TC)-RCaMP1e (cyan) when illuminated with 400, 450, and 560 nm for 300 ms. (F) Peak photocurrent amplitudes of several (n = 5, 12) traces as shown in (E), normalized to excitation wavelength exhibiting maximal amplitude. (G) Single-trial (gray) and trial-averaged (red, blue) fluorescence signal increase of each calcium sensor, after activation of CaV3.2 due to membrane depolarization with C1V1 or ChR2(TC), indicated with the colored bar. (H) Trial-averaged peak GECI fluorescence increase in (G) vs. increasing extracellular Ca2+concentration. Addition of the CaV antagonist mibefradil (Mb) abolishes GECI responses.
Figure 9
Figure 9
In vivo integrated optogenetics using ChR2 and RCaMP in C. elegans. (A) Expression of RCaMP1e in body wall muscle of C. elegans. Differential interference contrast (DIC) image (top left) and fluorescence micrograph (top right). Lower panels show magnified regions of insets in the top right panel, i.e., head region (left) and a single body wall muscle (right). Scale bars are indicated in each panel. (B) Transgenic C. elegans expressing RCaMP1e in body wall muscle shows spontaneous muscle Ca2+ increases during (restrained) locomotion. A false-colored still image from the video analysis is shown, with two ROIs shown (heat map indicates fluorescence increase). (C) The ΔF/F in the two ROIs of (B) plotted vs. time. (D) RCaMP1e signals observed in body wall muscles directly optically excited by photostimulation of co-expressed ChR2. A 100 ms light pulse (470 nm, 50 mW/cm2) from an LED was presented (gray box). Animals that were raised in the presence of all-trans retinal (ATR) showed a robust Ca2+ increase that peaked ~4 s after the photostimulus, and decayed within the next 8 s (red trace, n = 4). Animals raised in the absence of ATR (blue trace, n = 2) showed no appreciable Ca2+ increase. Plotted are mean ΔF/F and s.e.m. (E) ChR2 photostimulation of cholinergic motor neurons causes a subsequent Ca2+ increase in body wall muscles. ChR2 was expressed in cholinergic neurons [transgene zxIs6 (Liewald et al., 2008), using the punc-17 promoter] and RCaMP1h in body wall muscles. A 100 ms blue light pulse (470 nm, 50 mW/cm2) was presented and the Ca2+-induced fluorescence increases were measured in single body wall muscles, in animals that were either raised in the presence (red trace, n = 6) or in the absence of ATR (blue trace, n = 3). Shown are mean ΔF/F and s.e.m. (F) Experiment was as in (E), but comparing Ca2+ increases in muscle cells transgenic (red trace, n = 3) or non-transgenic for RCaMP1h (blue trace, n = 3); ATR was present in both cases. While in non-transgenic muscles only transient autofluorescence (excited by the blue light pulse) is observed, the transgenic muscles showed an increase of the fluorescent signal following the stimulus. (G) ChR2 expressed in cholinergic neurons was activated with 1.2 s, 50 mW/cm2 470 nm light (indicated by the gray shaded region), and the Ca2+ increase was monitored in single muscle cells transgenic for RCaMP1e, and compared to non-transgenic muscle. Fluorescence increase in non-transgenic muscle during the blue photostimulus was subtracted from the single traces. (H) Experiment was as in (G), with 1.2 s 470 nm light (indicated by the gray shaded region) of increasing intensities (0, 1, 10, 20, and 50 mW/cm2; n = 3, 3, 5, 6, and 4, respectively), and Ca2+ increases were monitored in single muscle cells transgenic for RCaMP1e and averaged across several animals. Shown are mean ΔF/F and s.e.m. (I) “Ca2+ signals” in muscles expressing R-GECO1 in animals also expressing ChR2 in cholinergic neurons. Neurons were photostimulated with a 200 ms, 50 mW/cm2 470 nm light stimulus, in animals raised in the presence (thick red line, n = 4) or absence (red dots, n = 5) of ATR. Data for RCaMP1h under identical experimental conditions is shown for comparison: with (thick green line, n = 6) or without (green dots, n = 4) ATR. (J) Close-up of (I). Blue line represents the in vitro data from Figure 4I (Ca2+-free state), showing the close correspondence between the “Ca2+-signals” and the blue light-induced photoactivation of R-GECO1.

Similar articles

Cited by

References

    1. Ai H. W., Henderson J. N., Remington S. J., Campbell R. E. (2006). Directed evolution of a monomeric, bright and photostable version of Clavularia cyan fluorescent protein: structural characterization and applications in fluorescence imaging. Biochem. J. 400, 531–540 10.1042/BJ20060874 - DOI - PMC - PubMed
    1. Ai H. W., Shaner N. C., Cheng Z., Tsien R. Y., Campbell R. E. (2007). Exploration of new chromophore structures leads to the identification of improved blue fluorescent proteins. Biochemistry 46, 5904–5910 10.1021/bi700199g - DOI - PubMed
    1. Akerboom J., Chen T. W., Wardill T. J., Tian L., Marvin J. S., Mutlu S., et al. (2012a). Optimization of a GCaMP calcium indicator for neural activity imaging. J. Neurosci. 32, 13819–13840 10.1523/JNEUROSCI.2601-12.2012 - DOI - PMC - PubMed
    1. Akerboom J., Tian L., Marvin J. S., Looger L. L. (2012b). Engineering and application of genetically encoded calcium indicators, in Genetically Encoded Functional Indicators, ed Martin J.-R. (New York, Heidelberg, Dordrecht, London: Humana Press, Springer; ), 125–147
    1. Akerboom J., Rivera J. D., Guilbe M. M., Malave E. C., Hernandez H. H., Tian L., et al. (2009). Crystal structures of the GCaMP calcium sensor reveal the mechanism of fluorescence signal change and aid rational design. J. Biol. Chem. 284, 6455–6464 10.1074/jbc.M807657200 - DOI - PMC - PubMed