. 2013 Feb 28;152(5):1021-36.
doi: 10.1016/j.cell.2013.01.052.

H3K4me3 interactions with TAF3 regulate preinitiation complex assembly and selective gene activation

Affiliations

H3K4me3 interactions with TAF3 regulate preinitiation complex assembly and selective gene activation

Shannon M Lauberth et al. Cell. .

Abstract

Histone modifications regulate chromatin-dependent processes, yet the mechanisms by which they contribute to specific outcomes remain unclear. H3K4me3 is a prominent histone mark that is associated with active genes and promotes transcription through interactions with effector proteins that include initiation factor TFIID. We demonstrate that H3K4me3-TAF3 interactions direct global TFIID recruitment to active genes, some of which are p53 targets. Further analyses show that (1) H3K4me3 enhances p53-dependent transcription by stimulating preinitiation complex (PIC) formation; (2) H3K4me3, through TAF3 interactions, can act either independently or cooperatively with the TATA box to direct PIC formation and transcription; and (3) H3K4me3-TAF3/TFIID interactions regulate gene-selective functions of p53 in response to genotoxic stress. Our findings indicate a mechanism by which H3K4me3 directs PIC assembly for the rapid induction of specific p53 target genes.


Figures

Figure 1
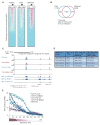
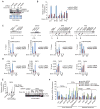
Figure 1. H3K4me3 Facilitates Global TAF3/TFIID Recruitment
(A–B) ChIP-Seq and (C–E) HIT-seq analyses. (A) Heat maps showing the distributions of RNAPII, TAF3, and H3K4me3 within 2 kb of the TSSs of 17,347 Refseq genes, rank-ordered by the size of RNAPII peaks. (B) Venn diagram showing the overlap of genes occupied by TAF3 and enriched for H3K4me3 (p<1E-05, FDR <5%). (C) HIT-seq signals for full-length WT and M880A mutant TAF3 and the corresponding isolated PHD TAF3 proteins at the indicated loci as compared to the distributions of H3K4me3, RNAPII, and expressed RNAs from published datasets (Shen et al., 2012). (D) HIT-seq binding sites with the total integrations including: TAF3 WT (22,844), TAF3 M880A mutant (39,695), TAF3 PHD WT (26,087), and TAF3 PHD M880A mutant (35,363). The number of TAF3 peaks that overlap with H3K4me3 or the TSS (+/− 2 kb) are shown. (E) Line graph showing the distribution of WT and mutant TAF3 binding sites (for both full-length and isolated TAF3 PHD proteins) and the distribution of H3K4me3 (Shen et al., 2012) relative to gene expression levels. ~18,000 mouse Refseq genes were separated into bins of 100 based on expression level. The binding sites associated with the genes in each bin were enumerated and adjusted for the genome size in each bin and the binding activity was normalized and calculated as counts per kb per million tags (CPKM). See also Figure S1.
Figure 2
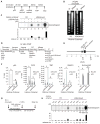
Figure 2. H3K4me3 Enhances PIC Formation and p53-Dependent Transcription
(A) Schematic of the in vitro transcription assay. (B) MNase digestion showing similar nucleosome spacing for chromatin assembled with unmodified H3 and H3Kc4me3-modified octamers. (C) NE-based transcription assay with deletions and additions as indicated. Relative transcription levels were quantitated by a phosphoimager. After background subtraction, all values were normalized to lane 4. The bar graph represents the average of two independent experiments and the error bars denote the standard deviation. ND, nondetectable. (D) Schematic of the in vitro ChIP assays. (E) Schematic of the pG5ML template indicating the amplicons used for qRT-PCR. (F) ChIP on chromatin assembled with unmodified H3 or H3Kc4me3 was performed with IgG and the indicated antibodies. H3K4me3 levels are relative to H3 levels. An average of two independent ChIP experiments is shown with error bars representing the standard deviation. (G and H) Kinetic analyses of PIC formation were performed +/− sarkosyl. Relative transcription levels were quantitated by a phosphoimager. After background subtraction, all values were normalized to lane 1. The bar graph represents the average of two independent experiments. Error bars denote the standard deviation. See also Figure S2.
Figure 3
Figure 3. H3K4me3 Functions Independently and Cooperatively with the TATA Box to Mediate p53-Dependent Transcription
(A) NE-based transcription assays with deletions and additions as indicated. Chromatin templates contained either a wild-type or mutant TATA box and were assembled with H3 or H3Kc4me3-modified octamers. Relative transcription levels were quantitated by a phosphoimager. After background subtraction, all values were normalized to lane 2. The bar graph represents the average of two independent experiments. Error bars denote the standard deviation. ND, nondetectable. (B) In vitro ChIP on the chromatin templates described in (A). The amplicons used for real-time PCR are shown in the schematic. An average of two independent ChIP experiments that are representative of at least four is shown with error bars denoting the standard deviation.
Figure 4
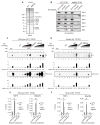
Figure 4. Functional Analysis of the TAF3/TFIID Complexes
(A) SDS/PAGE-silver stain analysis of the purified TAF3/TFIID complexes. (B) Wild-type and mutant TAF3/TFIID complexes were analyzed for binding to H3Kc4-methylated peptides and bound proteins were analyzed by immunoblots with indicated antibodies. In vitro transcription assays performed with ΔIID NE on chromatin templates assembled with H3 or H3Kc4me3-modified octamers and containing a wild-type (WT) TATA (C) or a mutant (M) TATA box (D). These assays were performed in the presence or absence of p53 and the wild-type or mutant TAF3/TFIID complexes. The amount of TFIID added in lanes 8 and 13 is comparable to the amount of endogenous TFIID in the NE in lane 2. Relative transcription levels were quantitated by a phosphoimager. After background subtraction, all values in (C) and (D) were normalized to lane 2, the upper panel of (C). Note that the assays in (C) and (D) were performed and analyzed in parallel such that the absolute levels of transcription are directly comparable. The bar graphs represent the average of two independent experiments. Error bars denote the standard deviation. ND, nondetectable. In vitro ChIP analysis on chromatin templates assembled with H3 or H3Kc4me3-modified octamers and containing a wild-type (E) or mutant (F) TATA box. The amplicons used for real-time PCR are shown in the schematic (Figure 2E, 3B). An average of two independent ChIP experiments is shown with error bars denoting the standard deviation. See also Figure S3.
Figure 5
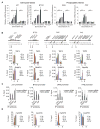
Figure 5. TAF3 Functions as an Essential Coactivator for p53
(A) HCT116 cells were transfected with non-targeting control (control) or TAF3 siRNAs (TAF3-1 and TAF3-2) and cultured with doxorubicin for 0 or 24 hr. (Left) qRT-PCR and (right) immunoblot revealed significant reduction of TAF3 compared to transfection with the control siRNA. The expression levels determined after doxorubicin treatment are relative to the levels before doxorubicin. Error bars denote the standard deviation from duplicate reactions by real time PCR. (B) Microarray analysis of genes affected by TAF3 depletion in HCT116 cells. Genes were sorted before (left-blue, No Doxo) or after (right-red, Doxo 24 h) doxorubicin treatment. Genes induced more than 2-fold after doxorubicin treatment in the control cells are represented (right-red). The numbers of affected gene probes (out of a total of 22,000) are shown with the indicated fold of down-or up-regulation due to TAF3 siRNA-mediated depletion. (C) GO analysis of the genes significantly affected by TAF3 depletion following 24 hours of doxorubicin treatment. The most highly represented categories are shown with ontology terms and the percentage of genes in each category. (D) QRT-PCR analysis of p53 target genes in control and TAF3-depleted HCT116 cells both before (Doxo 0 h) and after (24 h) doxorubicin treatment. The expression levels determined after doxorubicin are relative to the levels before doxorubicin. Error bars denote the standard deviation from duplicate reactions by real time PCR. See also Figure S4.
Figure 6
Figure 6. TAF3 Binding is Required for RNAPII Recruitment and Correlates with H3K4me3 Accumulation at the p21 and BTG2, but not the DR5 and FAS, Promoters
(A) HCT116 (p53+/+ and p53−/−) cells were treated with doxorubicin (for 0, 2, 4, 8, 12, and 24 h) and qRT-PCR was performed to measure the rapid p53-dependent induction of the cell cycle genes p21 and BTG2 and the delayed induction of the proapoptotic genes DR5 and FAS. The expression levels after doxorubicin treatment are provided relative to the levels before doxorubicin. Error bars denote the standard deviation from duplicate reactions by real time PCR. (B, D) ChIP analyses with the indicated antibodies were performed using HCT116 cells that were treated with doxorubicin for 0, 4, 8, and 24 h. The amplicons used for real-time PCR are shown in the schematic of the p53 loci. ChIP for H3K4me3 was normalized to H3. An average of two independent ChIP experiments that are representative of at least three is shown with error bars denoting the standard deviation. (C) HCT116 cells were treated with non-targeting (control) or TAF3 siRNA. Following 8 h of doxorubicin, cell lysates were analyzed by ChIP with the indicated antibodies. An average of two independent ChIP experiments that are representative of at least three is shown with error bars denoting the standard deviation. See also Figure S5.
Figure 7
Figure 7. TAF3 Interacts with H3K4me3 to Facilitate the Rapid Induction of Selective p53 Target Genes
(A) HCT116 cells were transfected with non-targeting control (control) or WDR5 siRNA and treated with doxorubicin for 0 or 24 h. Immunoblot analysis of cell lysates with the indicated antibodies. (B) QRT-PCR analysis of p53 target genes in HCT116 cells that were treated as in (A). The expression levels determined after doxorubicin are relative to the levels before doxorubicin. Error bars denote the standard deviation from duplicate reactions by real time PCR. (C, D) ChIP analysis of HCT116 cells transfected with control or WDR5 siRNA and treated with doxorubicin for 0 or 8 h. The levels of H3K4me3 are relative to H3 levels. Schematic showing the amplicons used for qRT-PCR. An average of two independent ChIP experiments that are representative of at least three is shown with error bars denoting the standard deviation. (E) (left) QRT-PCR and (right) immunoblot analysis of TAF3 in HCT116 cells that were transfected with control or TAF3 siRNA together with empty vector control or siRNA-resistant plasmids expressing wild-type or M880A mutant TAF3. The expression levels determined after doxorubicin are relative to the levels before doxorubicin and error bars denote the standard deviation from duplicate reactions by real time PCR. (F) QRT-PCR analysis of p53 target gene expression in HCT116 cells treated as described in (E). Error bars denote the standard deviation from duplicate reactions by real time PCR.

Similar articles

Cited by

References

    1. An W, Roeder RG. Reconstitution and transcriptional analysis of chromatin in vitro. Methods Enzymol. 2004;377:460–474. - PubMed
    1. Bannister AJ, Kouzarides T. Regulation of chromatin by histone modifications. Cell Res. 2011;21:381–395. - PMC - PubMed
    1. Bernstein BE, Kamal M, Lindblad-Toh K, Bekiranov S, Bailey DK, Huebert DJ, McMahon S, Karlsson EK, Kulbokas EJ, 3rd, Gingeras TR, et al. Genomic maps and comparative analysis of histone modifications in human and mouse. Cell. 2005;120:169–181. - PubMed
    1. Bunz F, Dutriaux A, Lengauer C, Waldman T, Zhou S, Brown JP, Sedivy JM, Kinzler KW, Vogelstein B. Requirement for p53 and p21 to sustain G2 arrest after DNA damage. Science. 1998;282:1497–1501. - PubMed
    1. Burley SK, Roeder RG. Biochemistry and structural biology of transcription factor IID (TFIID) Annu Rev Biochem. 1996;65:769–799. - PubMed

Publication types

Associated data