

virtualArray: a R/bioconductor package to merge raw data from different microarray platforms
- PMID: 23452776
- PMCID: PMC3599117
- DOI: 10.1186/1471-2105-14-75
virtualArray: a R/bioconductor package to merge raw data from different microarray platforms
Abstract
Background: Microarrays have become a routine tool to address diverse biological questions. Therefore, different types and generations of microarrays have been produced by several manufacturers over time. Likewise, the diversity of raw data deposited in public databases such as NCBI GEO or EBI ArrayExpress has grown enormously.This has resulted in databases currently containing several hundred thousand microarray samples clustered by different species, manufacturers and chip generations. While one of the original goals of these databases was to make the data available to other researchers for independent analysis and, where appropriate, integration with their own data, current software implementations could not provide that feature.Only those data sets generated on the same chip platform can be readily combined and even here there are batch effects to be taken care of. A straightforward approach to deal with multiple chip types and batch effects has been missing.The software presented here was designed to solve both of these problems in a convenient and user friendly way.
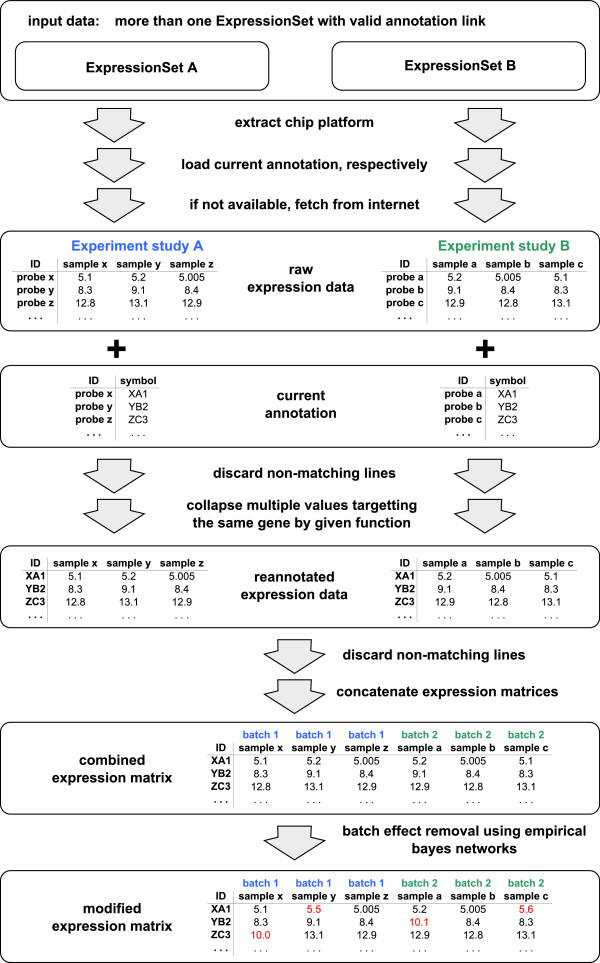
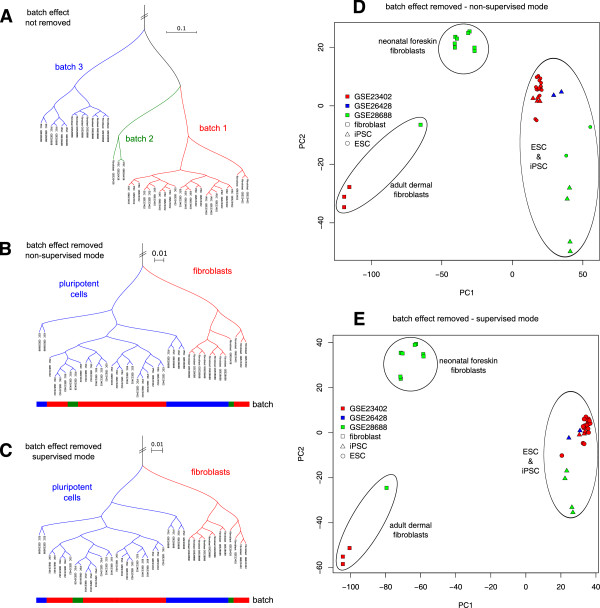
Results: The virtualArray software package can combine raw data sets using almost any chip types based on current annotations from NCBI GEO or Bioconductor. After establishing congruent annotations for the raw data, virtualArray can then directly employ one of seven implemented methods to adjust for batch effects in the data resulting from differences between the chip types used. Both steps can be tuned to the preferences of the user. When the run is finished, the whole dataset is presented as a conventional Bioconductor "ExpressionSet" object, which can be used as input to other Bioconductor packages.
Conclusions: Using this software package, researchers can easily integrate their own microarray data with data from public repositories or other sources that are based on different microarray chip types. Using the default approach a robust and up-to-date batch effect correction technique is applied to the data.
Figures
Similar articles
-
Cross-species and cross-platform gene expression studies with the Bioconductor-compliant R package 'annotationTools'.BMC Bioinformatics. 2008 Jan 17;9:26. doi: 10.1186/1471-2105-9-26. BMC Bioinformatics. 2008. PMID: 18201381 Free PMC article.
-
Importing ArrayExpress datasets into R/Bioconductor.Bioinformatics. 2009 Aug 15;25(16):2092-4. doi: 10.1093/bioinformatics/btp354. Epub 2009 Jun 8. Bioinformatics. 2009. PMID: 19505942 Free PMC article.
-
lumi: a pipeline for processing Illumina microarray.Bioinformatics. 2008 Jul 1;24(13):1547-8. doi: 10.1093/bioinformatics/btn224. Epub 2008 May 8. Bioinformatics. 2008. PMID: 18467348
-
Software packages for quantitative microarray-based gene expression analysis.Curr Pharm Biotechnol. 2003 Dec;4(6):417-37. doi: 10.2174/1389201033377436. Curr Pharm Biotechnol. 2003. PMID: 14683435 Review.
-
Open source software for the analysis of microarray data.Biotechniques. 2003 Mar;Suppl:45-51. Biotechniques. 2003. PMID: 12664684 Review.
Cited by
-
The neural crest is a source of mesenchymal stem cells with specialized hematopoietic stem cell niche function.Elife. 2014 Sep 25;3:e03696. doi: 10.7554/eLife.03696. Elife. 2014. PMID: 25255216 Free PMC article.
-
Drug repurposing and personalized treatment strategies for bipolar disorder using transcriptomics: an exploratory study.Braz J Psychiatry. 2024;46:e20233441. doi: 10.47626/1516-4446-2023-3441. Epub 2024 Mar 6. Braz J Psychiatry. 2024. PMID: 38446713 Free PMC article.
-
Topological data analysis identifies molecular phenotypes of idiopathic pulmonary fibrosis.Thorax. 2023 Jul;78(7):682-689. doi: 10.1136/thorax-2022-219731. Epub 2023 Feb 20. Thorax. 2023. PMID: 36808085 Free PMC article.
-
Meta-analysis approach as a gene selection method in class prediction: does it improve model performance? A case study in acute myeloid leukemia.BMC Bioinformatics. 2017 Apr 11;18(1):210. doi: 10.1186/s12859-017-1619-7. BMC Bioinformatics. 2017. PMID: 28399794 Free PMC article.
-
Large scale aggregate microarray analysis reveals three distinct molecular subclasses of human preeclampsia.PLoS One. 2015 Feb 13;10(2):e0116508. doi: 10.1371/journal.pone.0116508. eCollection 2015. PLoS One. 2015. PMID: 25679511 Free PMC article.
References
-
- Parkinson H, Sarkans U, Kolesnikov N, Abeygunawardena N, Burdett T, Dylag M, Emam I, Farne A, Hastings E, Holloway E. ArrayExpress update-an archive of microarray and high-throughput sequencing-based functional genomics experiments. Nucleic Acids Res. 2011;39:D1002–D1004. doi: 10.1093/nar/gkq1040. - DOI - PMC - PubMed
-
- Shi L, Reid LH, Jones WD, Shippy R, Warrington JA, Baker SC, Collins PJ, de Longueville F, Kawasaki ES, Lee KY. The MicroArray Quality Control (MAQC) project shows inter- and intraplatform reproducibility of gene expression measurements. Nat Biotechnol. 2006;24(9):1151–1161. doi: 10.1038/nbt1239. - DOI - PMC - PubMed
Publication types
MeSH terms
LinkOut - more resources
Full Text Sources
Other Literature Sources
