

doi: 10.1242/dev.091844.
ClearT: a detergent- and solvent-free clearing method for neuronal and non-neuronal tissue
Affiliations
- PMID: 23444362
- PMCID: PMC3912244
- DOI: 10.1242/dev.091844
Item in Clipboard
ClearT: a detergent- and solvent-free clearing method for neuronal and non-neuronal tissue
Development.
2013 Mar.
Abstract
We describe a clearing method for enhanced visualization of cell morphology and connections in neuronal and non-neuronal tissue. Using Clear(T) or Clear(T2), which are composed of formamide or formamide/polyethylene glycol, respectively, embryos, whole mounts and thick brain sections can be rapidly cleared with minimal volume changes. Unlike other available clearing techniques, these methods do not use detergents or solvents, and thus preserve lipophilic dyes, fluorescent tracers and immunohistochemical labeling, as well as fluorescent-protein labeling.
Figures

Rapid tissue clearing with ClearT. (A) Fixed whole embryos (E14.5) and dissected postnatal brains (P0) were cleared overnight. The grid is visible through tissue cleared by ClearT. (B) E14.5 embryos cleared with ClearT or ScaleA2 reach full transparency in 1 day or 14 days, respectively. (C) ClearT does not lead to volume changes. P0 sections (800 μm), surface area measured: pre-cleared, red line; ClearT, blue line. (D) Clearing is reversible with PBS (30 minutes). Scale bars: 1 mm.
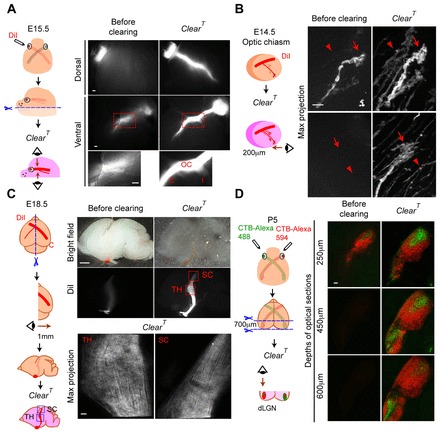
Retinal axon projections in brain tissue cleared with ClearT. (A) E15.5 eye was labeled with DiI, the jaw and tongue were cut away and the head was cleared with ClearT. DiI-labeled contralateral (C) and ipsilateral (I) retinal axons and optic chiasm are detected in both dorsal and ventral views after clearing with ClearT. (B) Merged stack (41 images, 5 μm steps) of E14.5 DiI-labeled growth cones (GCs) (arrows) and axons (arrowheads) of the ipsilateral optic tract; imaged from the ventral surface of 200 μm brain section, before and after clearing. (C) DiI-labeled contralateral RGC projection to the thalamus and superior colliculus at E18.5. Brains were cut sagittally at the midline and cleared with ClearT. Merged stack (51 images, 20 μm steps), viewed from the midline. DiI-labeled RGC axons in the dLGN in the thalamus (TH) and superior colliculus (SC) were undetectable in pre-cleared tissue, but easily visible after clearing. (D) CTB conjugated to Alexa Fluor 488 or 594 was injected into each eye and a 700 μm frontal section of P5 brain was cleared with ClearT. Optical slices at 250 μm, 450 μm and 600 μm below the tissue section surface are shown (from 71 images, 10 μm steps). Both CTB labels were observable, though deeper, in cleared dLGN compared with the same tissue before clearing. Scale bars: 1 mm in C (top); 100 μm in A and bottom of C,D (bottom); 10 μm in B.
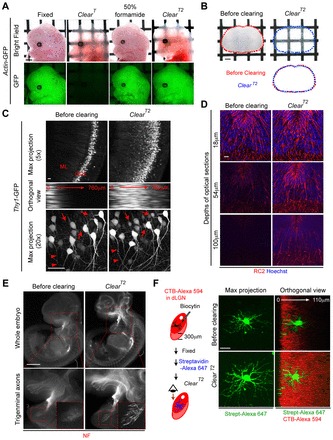
ClearT2 clears tissue with fluorescent proteins or immunohistochemistry. (A) ClearT cleared E14.5 actin-GFP embryos, but reduced GFP fluorescence. Formamide (50%) maintained fluorescence, but failed to clear embryos. ClearT2 cleared embryos and maintained fluorescence. (B) P0 sections (800 μm) were transparent after ClearT2, with no volume change. (C) P11 Thy1-GFP (M-line) hippocampus section (800 μm), before and after clearing with ClearT2; 38 images, 20 μm steps (top and middle). GFP+ pyramidal neurons (arrows) and dendrites (arrowheads) in CA1 region are markedly more visible after clearing; 52 images, 2.5 μm steps (bottom). GCL, granule cell layer; ML, molecular layer. (D) Sections of E14.5 optic chiasm (200 μm), immunolabeled with the radial glial marker RC2, cleared with ClearT2; 51 images, 3 μm steps; three optical slices shown. RC2+ staining was observed deeper in cleared compared with pre-cleared tissue. Blue indicates Hoechst staining. (E) E11.5 whole embryos, immunolabeled with neurofilament antibody (NF) and treated with ClearT2. NF+ axons were much more visible in cleared embryos (top); magnification of trigeminal axons reaching epithelial targets (bottom). (F) Section (300 μm) of postnatal mouse brain, dLGN anterogradely labeled with CTB conjugated to Alexa Fluor 594. A single neuron was filled with biocytin and immunostained with streptavidin-Alexa Fluor 647. Clearing with ClearT2 enhanced resolution and visibility of the dendritic arbor of the neuron. Merged stack, 55 images, 2 μm steps. CTB label is in red; biocytin-filled neuron is pseudo-colored green. Scale bars: 1 mm in A,B,E; 40 μm in C; 20 μm in D,F.
Similar articles
-
RTF: a rapid and versatile tissue optical clearing method.Sci Rep. 2018 Jan 31;8(1):1964. doi: 10.1038/s41598-018-20306-3. Sci Rep. 2018. PMID: 29386656 Free PMC article.
-
Fluorescent double-labeling with carbocyanine neuronal tracing and immunohistochemistry using a cholesterol-specific detergent digitonin.J Neurosci Methods. 2008 Sep 15;174(1):71-81. doi: 10.1016/j.jneumeth.2008.07.003. Epub 2008 Jul 15. J Neurosci Methods. 2008. PMID: 18674563
-
A rapid approach to high-resolution fluorescence imaging in semi-thick brain slices.J Vis Exp. 2011 Jul 26;(53):2807. doi: 10.3791/2807. J Vis Exp. 2011. PMID: 21841756 Free PMC article.
-
Embryo slices and strips: guidance and adhesion assays in the avian embryo.Methods Cell Biol. 2008;87:97-113. doi: 10.1016/S0091-679X(08)00205-7. Methods Cell Biol. 2008. PMID: 18485293 Review. No abstract available.
-
A survey of clearing techniques for 3D imaging of tissues with special reference to connective tissue.Prog Histochem Cytochem. 2016 Aug;51(2):9-23. doi: 10.1016/j.proghi.2016.04.001. Epub 2016 Apr 14. Prog Histochem Cytochem. 2016. PMID: 27142295 Review.
Cited by
-
Seamless reconstruction of intact adult-born neurons by serial end-block imaging reveals complex axonal guidance and development in the adult hippocampus.J Neurosci. 2013 Jul 10;33(28):11400-11. doi: 10.1523/JNEUROSCI.1374-13.2013. J Neurosci. 2013. PMID: 23843512 Free PMC article.
-
3D Visualization of the Temporal and Spatial Spread of Tau Pathology Reveals Extensive Sites of Tau Accumulation Associated with Neuronal Loss and Recognition Memory Deficit in Aged Tau Transgenic Mice.PLoS One. 2016 Jul 28;11(7):e0159463. doi: 10.1371/journal.pone.0159463. eCollection 2016. PLoS One. 2016. PMID: 27466814 Free PMC article.
-
Extracting structural and functional features of widely distributed biological circuits with single cell resolution via tissue clearing and delivery vectors.Curr Opin Biotechnol. 2016 Aug;40:193-207. doi: 10.1016/j.copbio.2016.03.012. Epub 2016 Jul 6. Curr Opin Biotechnol. 2016. PMID: 27393829 Free PMC article. Review.
-
On-chip clearing of arrays of 3-D cell cultures and micro-tissues.Biomicrofluidics. 2016 Jul 20;10(4):044107. doi: 10.1063/1.4959031. eCollection 2016 Jul. Biomicrofluidics. 2016. PMID: 27493703 Free PMC article.
-
Optimisation and validation of hydrogel-based brain tissue clearing shows uniform expansion across anatomical regions and spatial scales.Sci Rep. 2019 Aug 19;9(1):12084. doi: 10.1038/s41598-019-48460-2. Sci Rep. 2019. PMID: 31427619 Free PMC article.
References
-
- Bielle F., Marcos-Mondéjar P., Leyva-Díaz E., Lokmane L., Mire E., Mailhes C., Keita M., García N., Tessier-Lavigne M., Garel S., et al. (2011). Emergent growth cone responses to combinations of Slit1 and Netrin 1 in thalamocortical axon topography. Curr. Biol. 21, 1748–1755 - PubMed
-
- Dodt H. U., Leischner U., Schierloh A., Jährling N., Mauch C. P., Deininger K., Deussing J. M., Eder M., Zieglgänsberger W., Becker K. (2007). Ultramicroscopy: three-dimensional visualization of neuronal networks in the whole mouse brain. Nat. Methods 4, 331–336 - PubMed
-
- Ertürk A., Mauch C. P., Hellal F., Förstner F., Keck T., Becker K., Jährling N., Steffens H., Richter M., Hübener M., et al. (2012). Three-dimensional imaging of the unsectioned adult spinal cord to assess axon regeneration and glial responses after injury. Nat. Med. 18, 166–171 - PubMed
-
- Feng G., Mellor R. H., Bernstein M., Keller-Peck C., Nguyen Q. T., Wallace M., Nerbonne J. M., Lichtman J. W., Sanes J. R. (2000). Imaging neuronal subsets in transgenic mice expressing multiple spectral variants of GFP. Neuron 28, 41–51 - PubMed
Publication types
MeSH terms
Substances
Grants and funding
LinkOut - more resources
Full Text Sources
Other Literature Sources
