

Metabolic fluxes in an illuminated Arabidopsis rosette
- PMID: 23444331
- PMCID: PMC3608787
- DOI: 10.1105/tpc.112.106989
Metabolic fluxes in an illuminated Arabidopsis rosette
Abstract
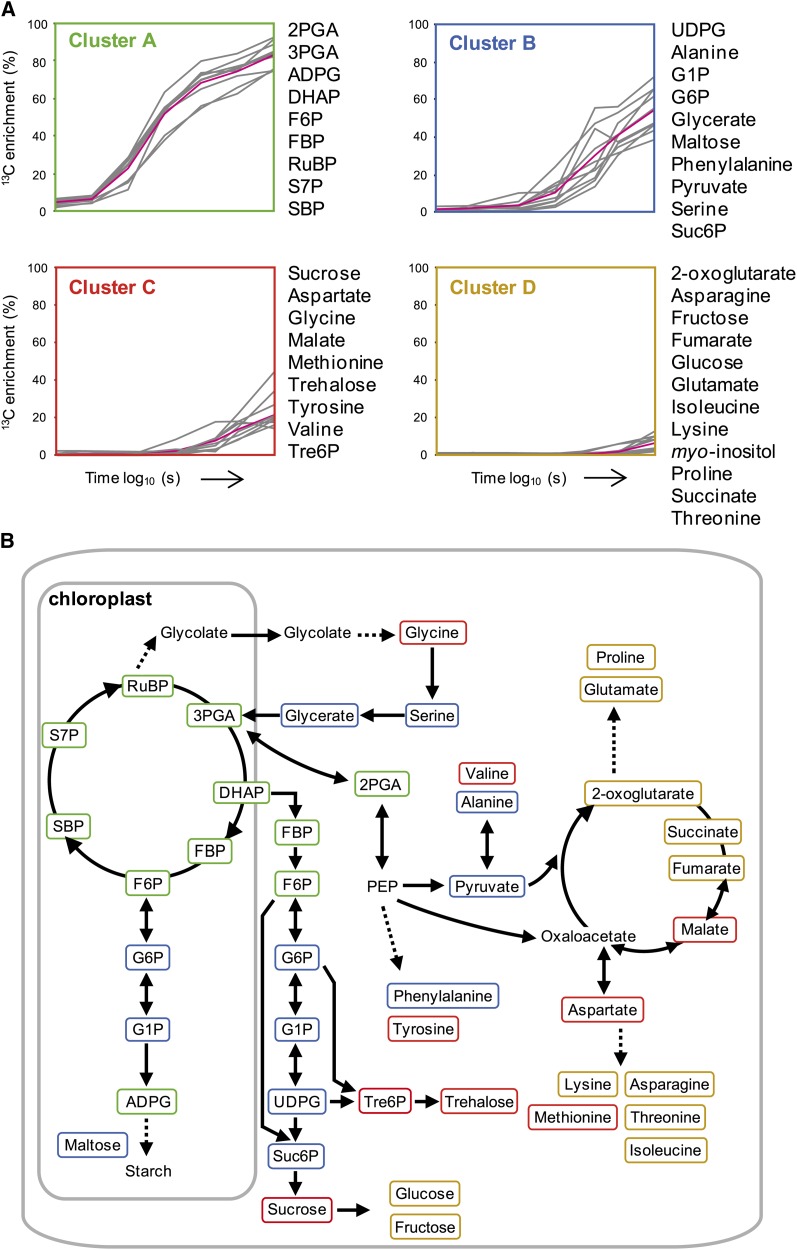
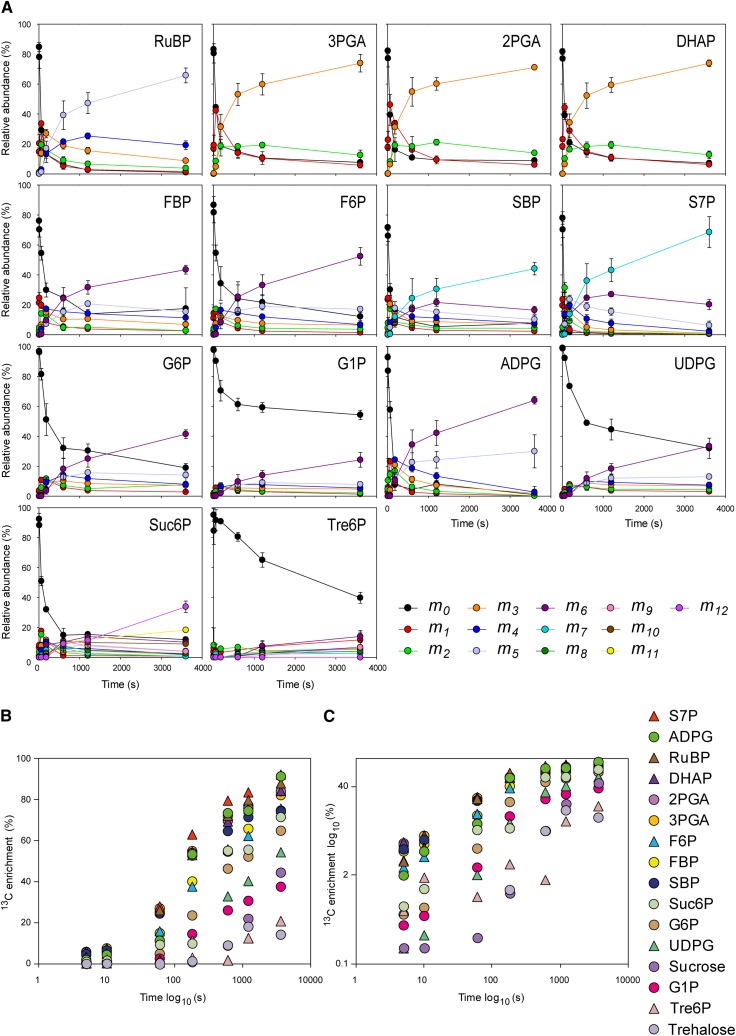
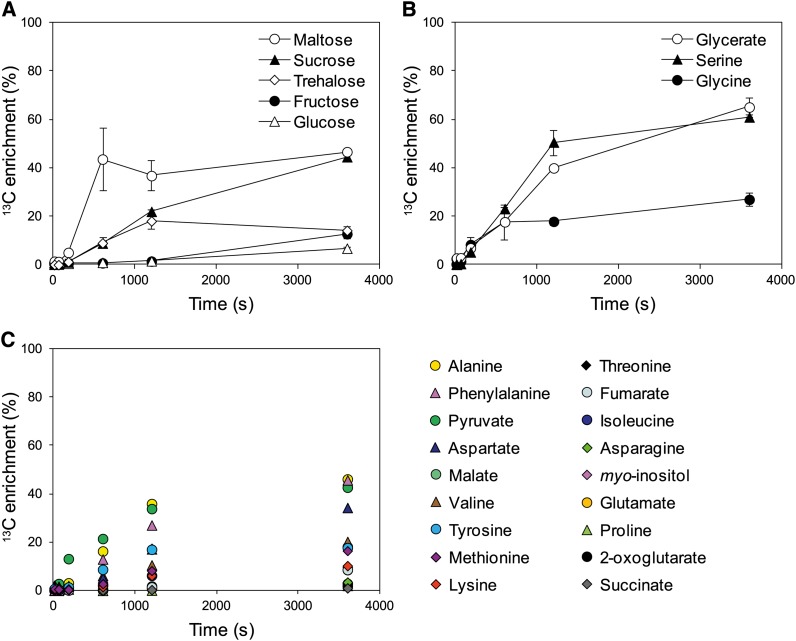
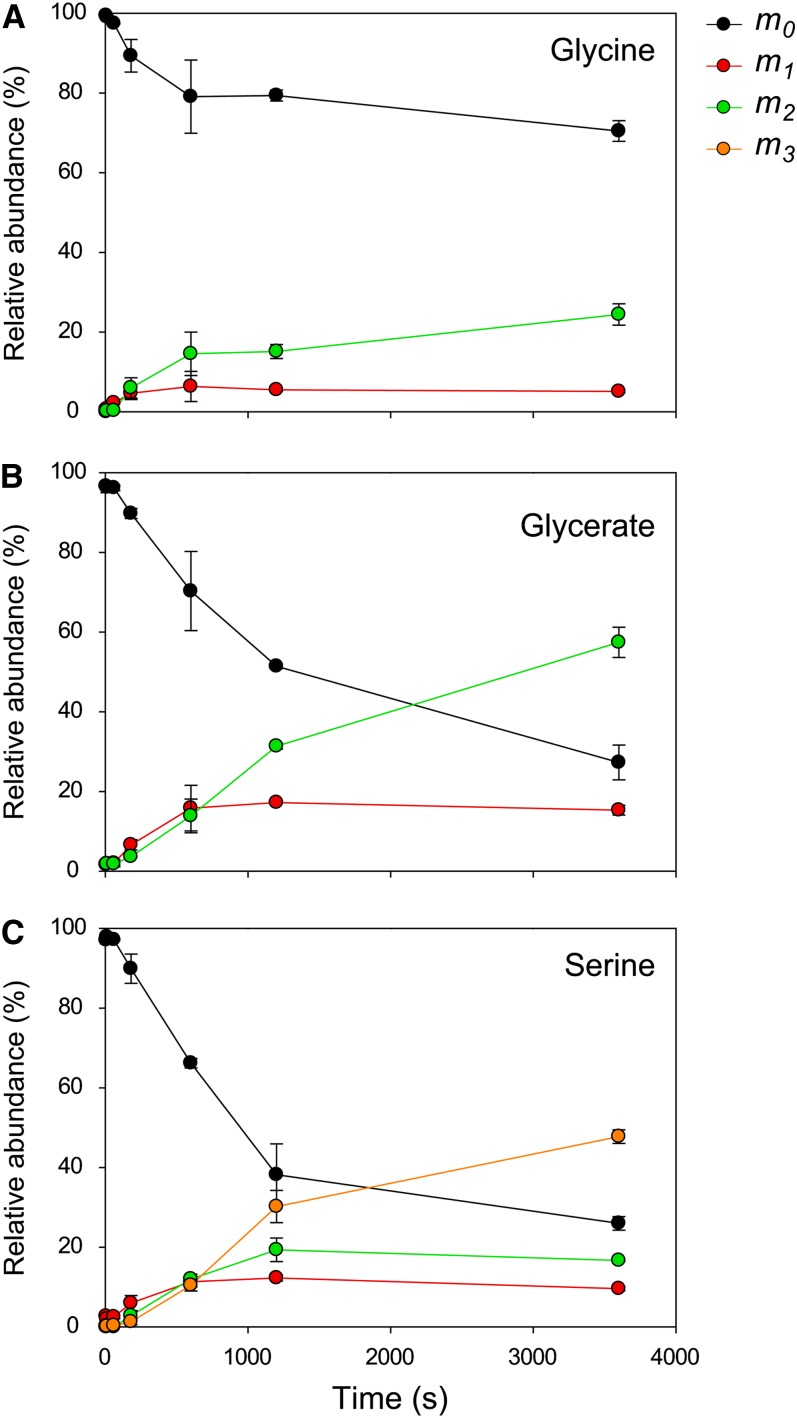
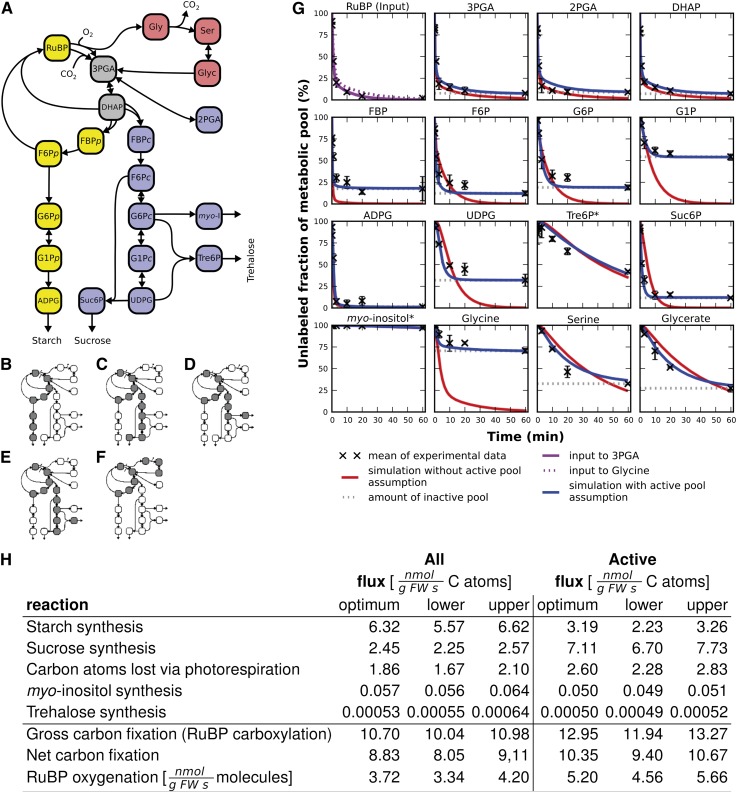
Photosynthesis is the basis for life, and its optimization is a key biotechnological aim given the problems of population explosion and environmental deterioration. We describe a method to resolve intracellular fluxes in intact Arabidopsis thaliana rosettes based on time-dependent labeling patterns in the metabolome. Plants photosynthesizing under limiting irradiance and ambient CO2 in a custom-built chamber were transferred into a (13)CO2-enriched environment. The isotope labeling patterns of 40 metabolites were obtained using liquid or gas chromatography coupled to mass spectrometry. Labeling kinetics revealed striking differences between metabolites. At a qualitative level, they matched expectations in terms of pathway topology and stoichiometry, but some unexpected features point to the complexity of subcellular and cellular compartmentation. To achieve quantitative insights, the data set was used for estimating fluxes in the framework of kinetic flux profiling. We benchmarked flux estimates to four classically determined flux signatures of photosynthesis and assessed the robustness of the estimates with respect to different features of the underlying metabolic model and the time-resolved data set.
Figures
Similar articles
-
Stable Isotope Labeling and Quantification of Photosynthetic Metabolites.Methods Mol Biol. 2024;2790:439-466. doi: 10.1007/978-1-0716-3790-6_24. Methods Mol Biol. 2024. PMID: 38649586
-
Flux profiling of photosynthetic carbon metabolism in intact plants.Nat Protoc. 2014 Aug;9(8):1803-24. doi: 10.1038/nprot.2014.115. Epub 2014 Jul 3. Nat Protoc. 2014. PMID: 24992096
-
13CO2 Labeling and Mass Spectral Analysis of Photorespiration.Methods Mol Biol. 2017;1653:157-166. doi: 10.1007/978-1-4939-7225-8_11. Methods Mol Biol. 2017. PMID: 28822132
-
Applications of stable isotope-based metabolomics and fluxomics toward synthetic biology of cyanobacteria.Wiley Interdiscip Rev Syst Biol Med. 2020 May;12(3):e1472. doi: 10.1002/wsbm.1472. Epub 2019 Dec 9. Wiley Interdiscip Rev Syst Biol Med. 2020. PMID: 31816180 Review.
-
Translational Metabolomics of Head Injury: Exploring Dysfunctional Cerebral Metabolism with Ex Vivo NMR Spectroscopy-Based Metabolite Quantification.In: Kobeissy FH, editor. Brain Neurotrauma: Molecular, Neuropsychological, and Rehabilitation Aspects. Boca Raton (FL): CRC Press/Taylor & Francis; 2015. Chapter 25. In: Kobeissy FH, editor. Brain Neurotrauma: Molecular, Neuropsychological, and Rehabilitation Aspects. Boca Raton (FL): CRC Press/Taylor & Francis; 2015. Chapter 25. PMID: 26269925 Free Books & Documents. Review.
Cited by
-
Combination of long-term 13CO2 labeling and isotopolog profiling allows turnover analysis of photosynthetic pigments in Arabidopsis leaves.Plant Methods. 2022 Oct 1;18(1):114. doi: 10.1186/s13007-022-00946-3. Plant Methods. 2022. PMID: 36183136 Free PMC article.
-
Toward multifaceted roles of sucrose in the regulation of stomatal movement.Plant Signal Behav. 2018;13(8):e1494468. doi: 10.1080/15592324.2018.1494468. Epub 2018 Aug 1. Plant Signal Behav. 2018. PMID: 30067434 Free PMC article.
-
Serine synthesis through PHGDH coordinates nucleotide levels by maintaining central carbon metabolism.Nat Commun. 2018 Dec 21;9(1):5442. doi: 10.1038/s41467-018-07868-6. Nat Commun. 2018. PMID: 30575741 Free PMC article.
-
Autophagy modulates the metabolism and growth of tomato fruit during development.Hortic Res. 2022 Jun 13;9:uhac129. doi: 10.1093/hr/uhac129. eCollection 2022. Hortic Res. 2022. PMID: 35928403 Free PMC article.
-
Identification of gene function based on models capturing natural variability of Arabidopsis thaliana lipid metabolism.Nat Commun. 2023 Aug 14;14(1):4897. doi: 10.1038/s41467-023-40644-9. Nat Commun. 2023. PMID: 37580345 Free PMC article.
References
-
- Abramson F.P., McCaman M.W., McCaman R.E. (1974). Femtomole level of analysis of biogenic amines and amino acids using functional group mass spectrometry. Anal. Biochem. 57: 482–499 - PubMed
-
- Aharoni A., Brandizzi F. (2012). High-resolution measurements in plant biology. Plant J. 70: 1–4 - PubMed
-
- Andriotis V.M., Pike M.J., Kular B., Rawsthorne S., Smith A.M. (2010). Starch turnover in developing oilseed embryos. New Phytol. 187: 791–804 - PubMed
-
- Antoniewicz M.R., Kelleher J.K., Stephanopoulos G. (2006). Determination of confidence intervals of metabolic fluxes estimated from stable isotope measurements. Metab. Eng. 8: 324–337 - PubMed
Publication types
MeSH terms
Substances
LinkOut - more resources
Full Text Sources
Other Literature Sources
