

Knockout of the Na,K-ATPase α2-isoform in cardiac myocytes delays pressure overload-induced cardiac dysfunction
- PMID: 23436327
- PMCID: PMC3625909
- DOI: 10.1152/ajpheart.00594.2012
Knockout of the Na,K-ATPase α2-isoform in cardiac myocytes delays pressure overload-induced cardiac dysfunction
Abstract
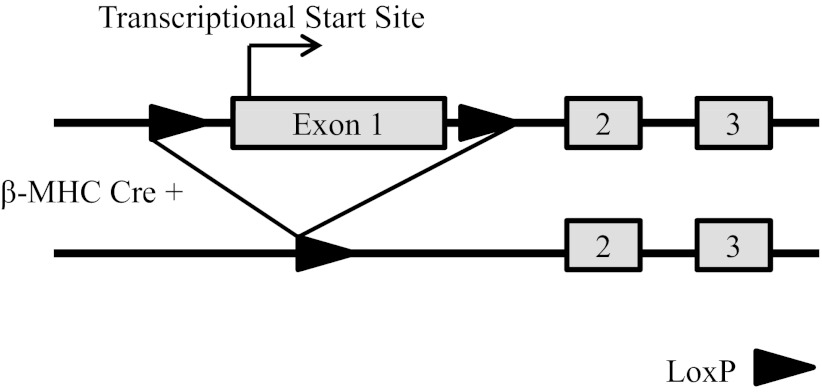
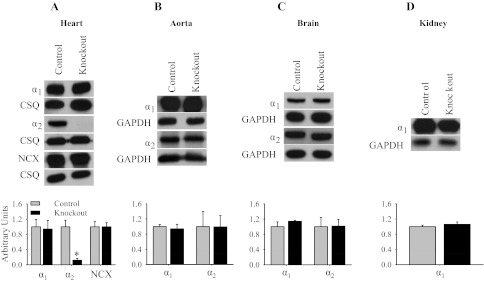
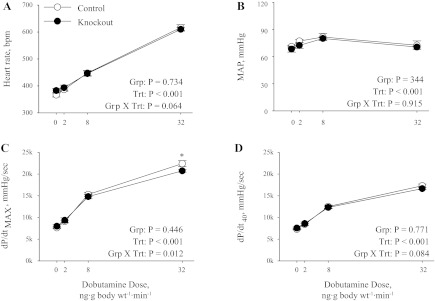
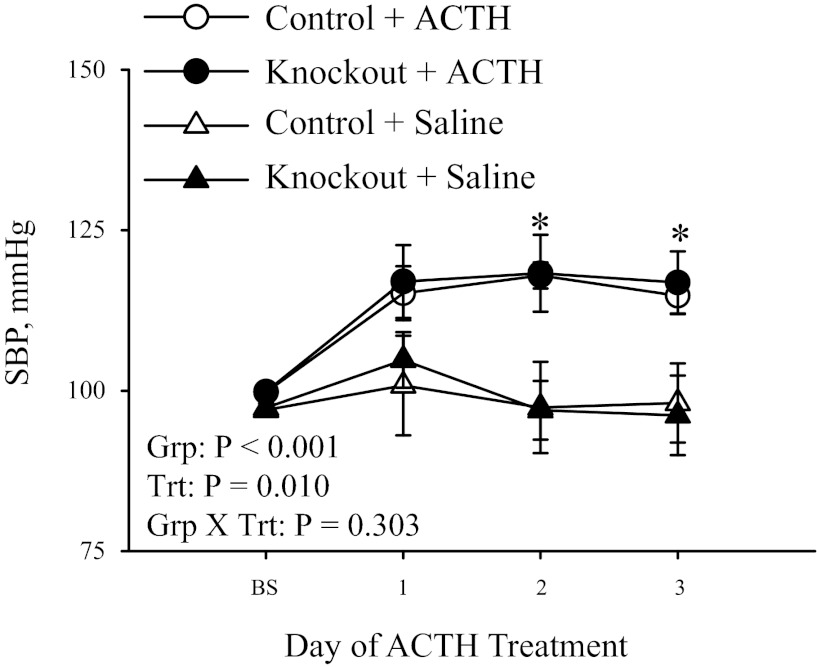
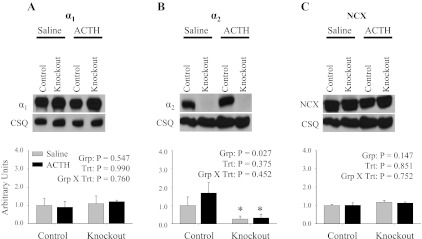
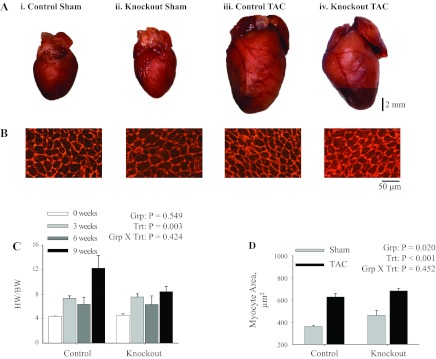
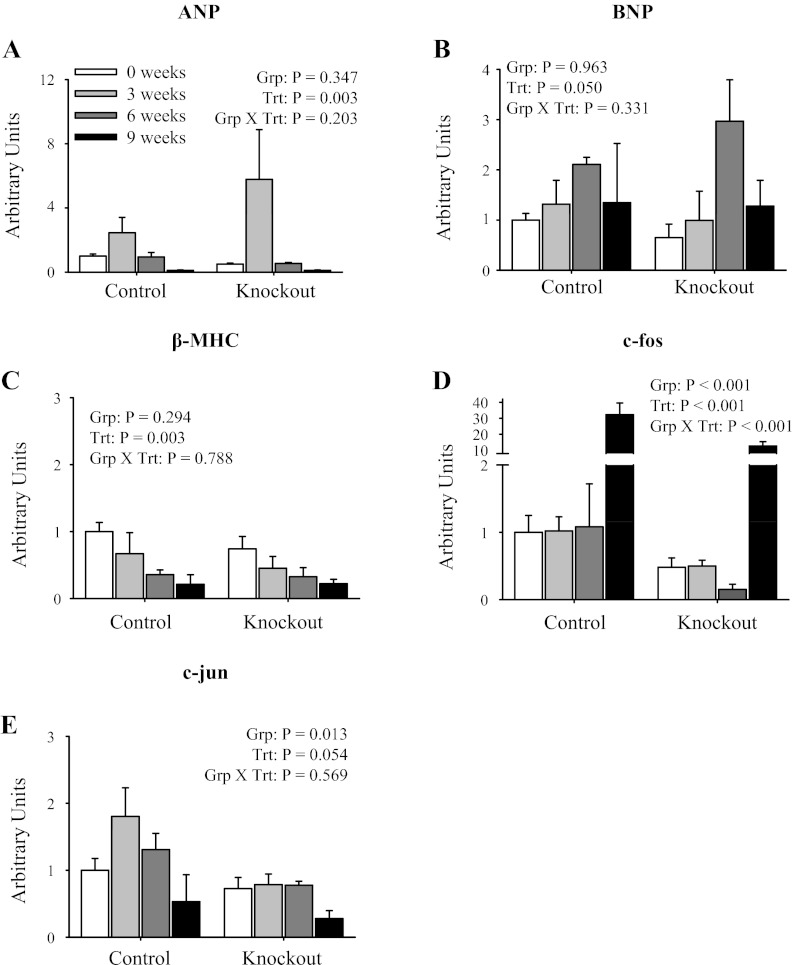
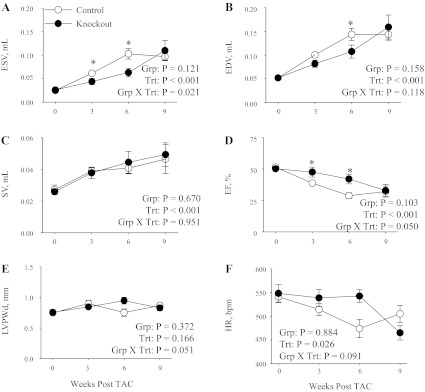
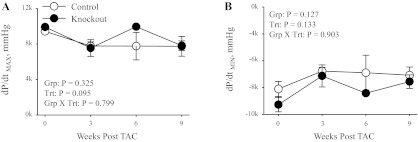
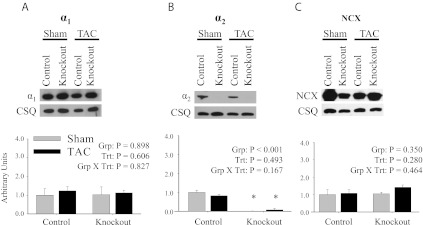
The α2-isoform of the Na,K-ATPase (α2) is the minor isoform of the Na,K-ATPase expressed in the cardiovascular system and is thought to play a critical role in the regulation of cardiovascular hemodynamics. However, the organ system/cell type expressing α2 that is required for this regulation has not been fully defined. The present study uses a heart-specific knockout of α2 to further define the tissue-specific role of α2 in the regulation of cardiovascular hemodynamics. To accomplish this, we developed a mouse model using the Cre/loxP system to generate a tissue-specific knockout of α2 in the heart using β-myosin heavy chain Cre. We have achieved a 90% knockout of α2 expression in the heart of the knockout mice. Interestingly, the heart-specific knockout mice exhibit normal basal cardiac function and systolic blood pressure, and in addition, these mice develop ACTH-induced hypertension in response to ACTH treatment similar to control mice. Surprisingly, the heart-specific knockout mice display delayed onset of cardiac dysfunction compared with control mice in response to pressure overload induced by transverse aortic constriction; however, the heart-specific knockout mice deteriorated to control levels by 9 wk post-transverse aortic constriction. These results suggest that heart expression of α2 does not play a role in the regulation of basal cardiovascular function or blood pressure; however, heart expression of α2 plays a role in the hypertrophic response to pressure overload. This study further emphasizes that the tissue localization of α2 determines its unique roles in the regulation of cardiovascular function.
Figures
Similar articles
-
Matairesinol blunts adverse cardiac remodeling and heart failure induced by pressure overload by regulating Prdx1 and PI3K/AKT/FOXO1 signaling.Phytomedicine. 2024 Dec;135:156054. doi: 10.1016/j.phymed.2024.156054. Epub 2024 Sep 15. Phytomedicine. 2024. PMID: 39306883
-
Cardiac tumour necrosis factor receptor-associated factor 7 mediates the ubiquitination of apoptosis signal-regulating kinase 1 and aggravates cardiac hypertrophy.Cardiovasc Res. 2024 Dec 14;120(16):2031-2046. doi: 10.1093/cvr/cvae217. Cardiovasc Res. 2024. PMID: 39373232
-
Cardiac secreted HSP90α exacerbates pressure overload myocardial hypertrophy and heart failure.Redox Biol. 2025 Feb;79:103466. doi: 10.1016/j.redox.2024.103466. Epub 2024 Dec 10. Redox Biol. 2025. PMID: 39721497 Free PMC article.
-
Depressing time: Waiting, melancholia, and the psychoanalytic practice of care.In: Kirtsoglou E, Simpson B, editors. The Time of Anthropology: Studies of Contemporary Chronopolitics. Abingdon: Routledge; 2020. Chapter 5. In: Kirtsoglou E, Simpson B, editors. The Time of Anthropology: Studies of Contemporary Chronopolitics. Abingdon: Routledge; 2020. Chapter 5. PMID: 36137063 Free Books & Documents. Review.
-
Heart Disease and Diabetes.2023 Dec 20. In: Lawrence JM, Casagrande SS, Herman WH, Wexler DJ, Cefalu WT, editors. Diabetes in America [Internet]. Bethesda (MD): National Institute of Diabetes and Digestive and Kidney Diseases (NIDDK); 2023–. 2023 Dec 20. In: Lawrence JM, Casagrande SS, Herman WH, Wexler DJ, Cefalu WT, editors. Diabetes in America [Internet]. Bethesda (MD): National Institute of Diabetes and Digestive and Kidney Diseases (NIDDK); 2023–. PMID: 38117924 Free Books & Documents. Review.
Cited by
-
The Na/K-ATPase α1/Src Signaling Axis Regulates Mitochondrial Metabolic Function and Redox Signaling in Human iPSC-Derived Cardiomyocytes.Biomedicines. 2023 Dec 2;11(12):3207. doi: 10.3390/biomedicines11123207. Biomedicines. 2023. PMID: 38137428 Free PMC article.
-
Augmented Ouabain-Induced Vascular Response Reduces Cardiac Efficiency in Mice with Migraine-Associated Mutation in the Na+, K+-ATPase α2-Isoform.Biomedicines. 2023 Jan 25;11(2):344. doi: 10.3390/biomedicines11020344. Biomedicines. 2023. PMID: 36830881 Free PMC article.
-
Why isn't endogenous ouabain more widely accepted?Am J Physiol Heart Circ Physiol. 2014 Sep 1;307(5):H635-9. doi: 10.1152/ajpheart.00404.2014. Epub 2014 Jul 3. Am J Physiol Heart Circ Physiol. 2014. PMID: 24993043 Free PMC article. No abstract available.
-
Inwardly rectifying K+ channels are major contributors to flow-induced vasodilatation in resistance arteries.J Physiol. 2017 Apr 1;595(7):2339-2364. doi: 10.1113/JP273255. Epub 2016 Dec 26. J Physiol. 2017. PMID: 27859264 Free PMC article.
-
The pump, the exchanger, and the holy spirit: origins and 40-year evolution of ideas about the ouabain-Na+ pump endocrine system.Am J Physiol Cell Physiol. 2018 Jan 1;314(1):C3-C26. doi: 10.1152/ajpcell.00196.2017. Epub 2017 Nov 7. Am J Physiol Cell Physiol. 2018. PMID: 28971835 Free PMC article. Review.
References
-
- Berry RG, Despa S, Fuller W, Bers DM, Shattock MJ. Differential distribution and regulation of mouse cardiac Na+/K+-ATPase alpha1 and alpha2 subunits in T-tubule and surface sarcolemmal membranes. Cardiovasc Res 73: 92–100, 2007 - PubMed
-
- Dorn GW, 2nd, Robbins J, Ball N, Walsh RA. Myosin heavy chain regulation and myocyte contractile depression after LV hypertrophy in aortic-banded mice. Am J Physiol Heart Circ Physiol 267: H400–H405, 1994 - PubMed
-
- Dostanic I, Lorenz JN, Schultz Jel J, Grupp IL, Neumann JC, Wani MA, Lingrel JB. The alpha2 isoform of Na,K-ATPase mediates ouabain-induced cardiac inotropy in mice. J Biol Chem 278: 53026–53034, 2003 - PubMed
-
- Dostanic I, Paul RJ, Lorenz JN, Theriault S, Van Huysse JW, Lingrel JB. The α2-isoform of Na-K-ATPase mediates ouabain-induced hypertension in mice and increased vascular contractility in vitro. Am J Physiol Heart Circ Physiol 288: H477–H485, 2005 - PubMed
Publication types
MeSH terms
Substances
Grants and funding
LinkOut - more resources
Full Text Sources
Other Literature Sources
Medical
Molecular Biology Databases
Miscellaneous