

Calcium-activated chloride channel ANO1 promotes breast cancer progression by activating EGFR and CAMK signaling
- PMID: 23431153
- PMCID: PMC3600458
- DOI: 10.1073/pnas.1217072110
Calcium-activated chloride channel ANO1 promotes breast cancer progression by activating EGFR and CAMK signaling
Abstract
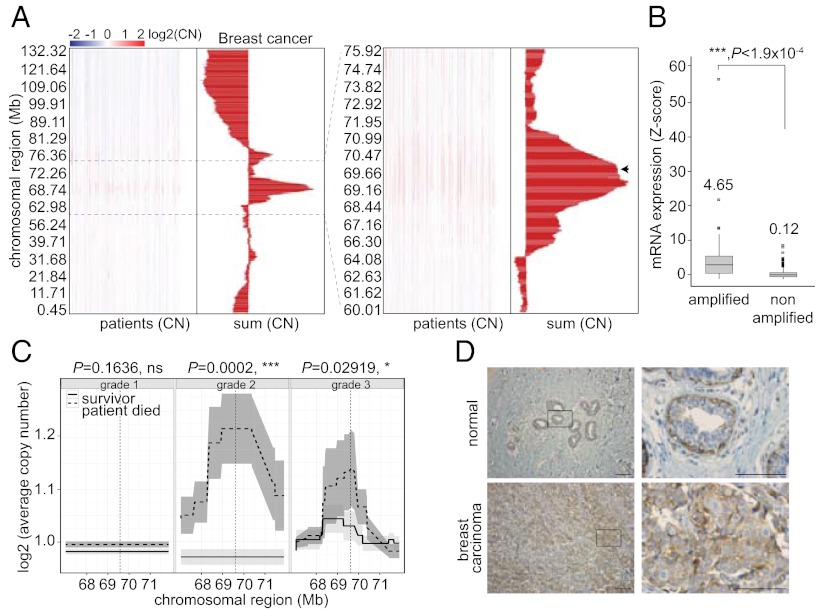
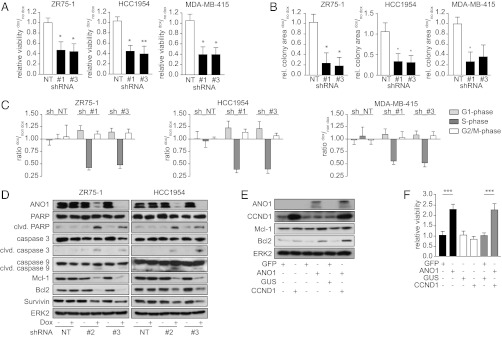
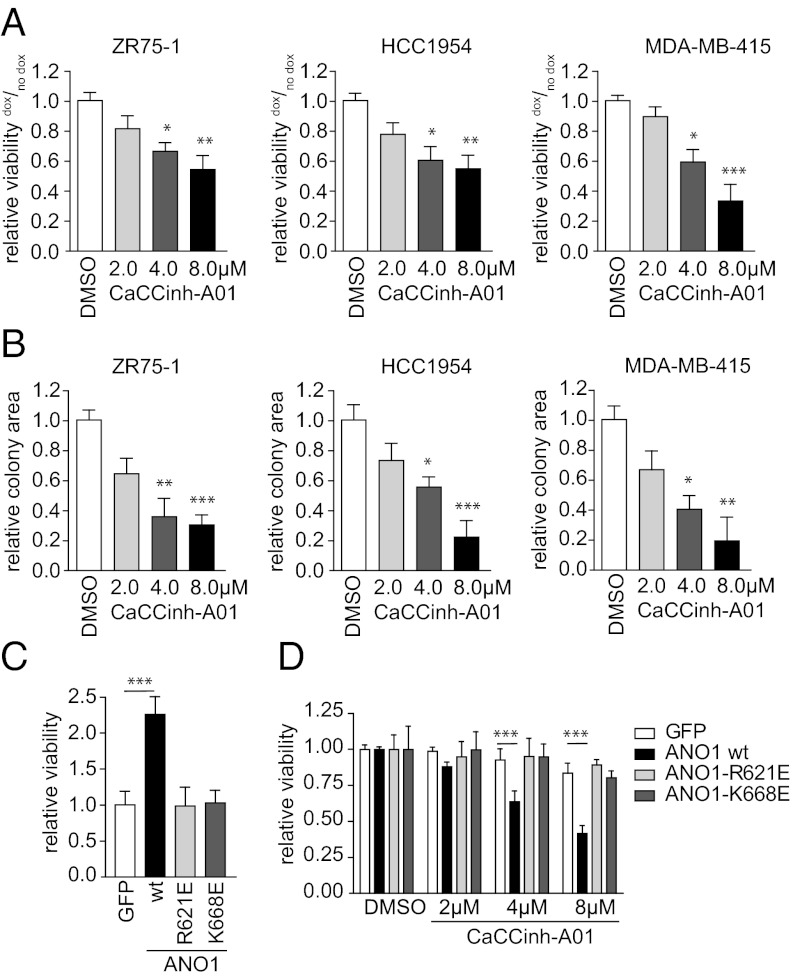
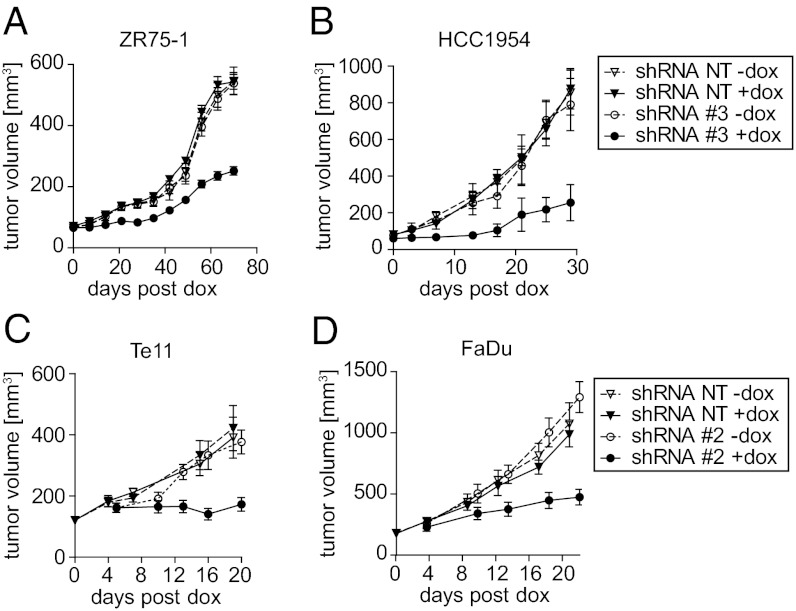
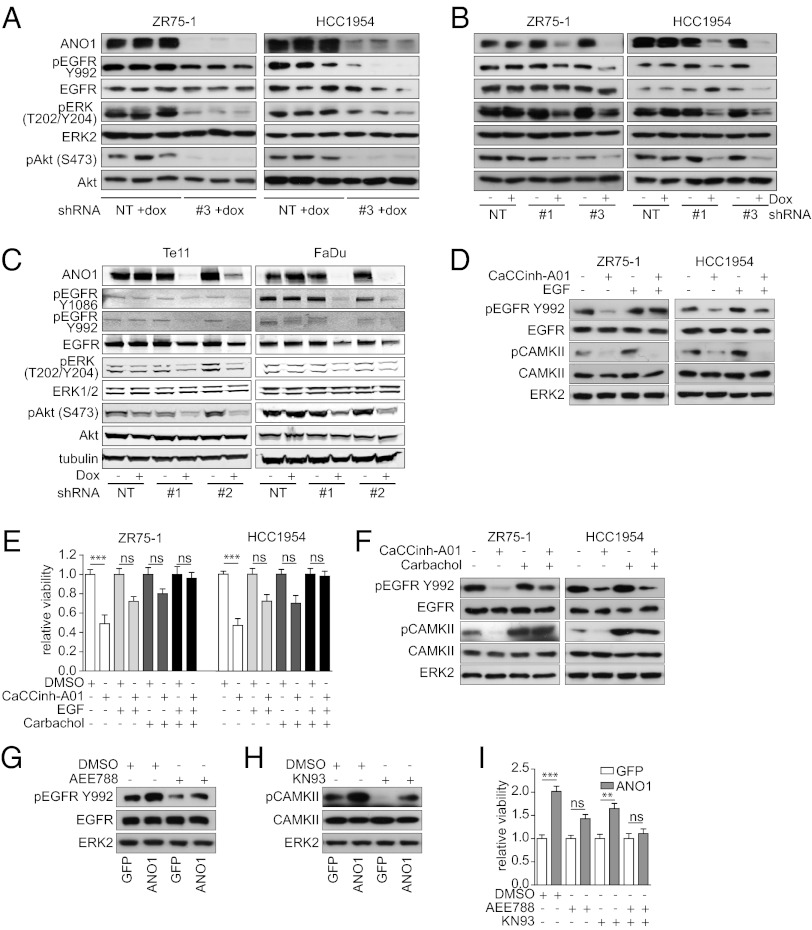
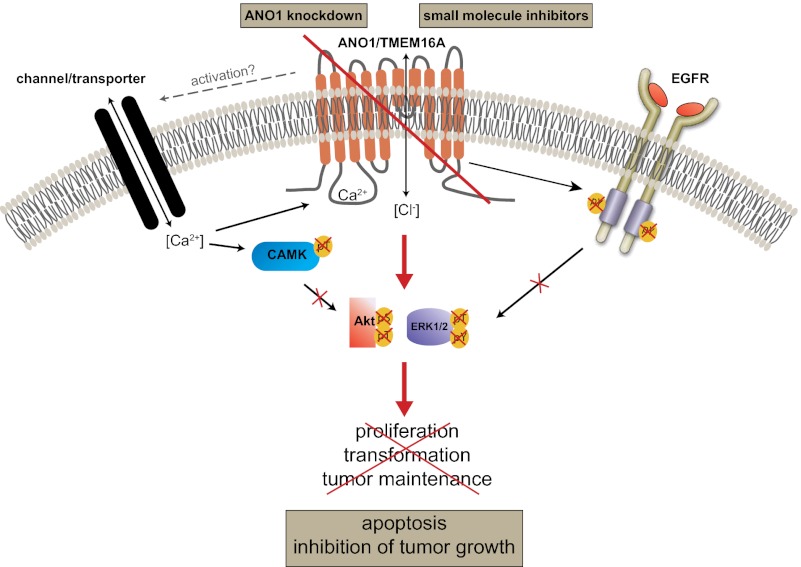
The calcium-activated chloride channel anoctamin 1 (ANO1) is located within the 11q13 amplicon, one of the most frequently amplified chromosomal regions in human cancer, but its functional role in tumorigenesis has remained unclear. The 11q13 region is amplified in ∼15% of breast cancers. Whether ANO1 is amplified in breast tumors, the extent to which gene amplification contributes to ANO1 overexpression, and whether overexpression of ANO1 is important for tumor maintenance have remained unknown. We have found that ANO1 is amplified and highly expressed in breast cancer cell lines and primary tumors. Amplification of ANO1 correlated with disease grade and poor prognosis. Knockdown of ANO1 in ANO1-amplified breast cancer cell lines and other cancers bearing 11q13 amplification inhibited proliferation, induced apoptosis, and reduced tumor growth in established cancer xenografts. Moreover, ANO1 chloride channel activity was important for cell viability. Mechanistically, ANO1 knockdown or pharmacological inhibition of its chloride-channel activity reduced EGF receptor (EGFR) and calmodulin-dependent protein kinase II (CAMKII) signaling, which subsequently attenuated AKT, v-src sarcoma viral oncogene homolog (SRC), and extracellular signal-regulated kinase (ERK) activation in vitro and in vivo. Our results highlight the involvement of the ANO1 chloride channel in tumor progression and provide insights into oncogenic signaling in human cancers with 11q13 amplification, thereby establishing ANO1 as a promising target for therapy in these highly prevalent tumor types.
Conflict of interest statement
Conflict of interest statement: A. Bill, C.R., I.C., M.R., P.R., C.T.G., K.W., E.G., M.O.P., S.L., H.C., M.G., L.W., S.F., J. Borawski, J. Baffoe, M.L. and L.A.G. are employees of Novartis Institutes for Biomedical Research.
Figures
Similar articles
-
Enhanced expression of ANO1 in head and neck squamous cell carcinoma causes cell migration and correlates with poor prognosis.PLoS One. 2012;7(8):e43265. doi: 10.1371/journal.pone.0043265. Epub 2012 Aug 17. PLoS One. 2012. PMID: 22912841 Free PMC article.
-
Researches of calcium-activated chloride channel ANO1 intervening amyotrophic lateral sclerosis progression by activating EGFR and CaMKII signaling.Brain Res Bull. 2023 Nov;204:110792. doi: 10.1016/j.brainresbull.2023.110792. Epub 2023 Oct 18. Brain Res Bull. 2023. PMID: 37858681
-
ANO1/TMEM16A interacts with EGFR and correlates with sensitivity to EGFR-targeting therapy in head and neck cancer.Oncotarget. 2015 Apr 20;6(11):9173-88. doi: 10.18632/oncotarget.3277. Oncotarget. 2015. PMID: 25823819 Free PMC article.
-
The Ca(2+) -activated Cl(-) channel, ANO1 (TMEM16A), is a double-edged sword in cell proliferation and tumorigenesis.Cancer Med. 2014 Jun;3(3):453-61. doi: 10.1002/cam4.232. Epub 2014 Mar 18. Cancer Med. 2014. PMID: 24639373 Free PMC article. Review.
-
Role of anoctamins in cancer and apoptosis.Philos Trans R Soc Lond B Biol Sci. 2014 Feb 3;369(1638):20130096. doi: 10.1098/rstb.2013.0096. Print 2014 Mar 19. Philos Trans R Soc Lond B Biol Sci. 2014. PMID: 24493744 Free PMC article. Review.
Cited by
-
The Calcium/Calmodulin-Dependent Kinases II and IV as Therapeutic Targets in Neurodegenerative and Neuropsychiatric Disorders.Int J Mol Sci. 2021 Apr 21;22(9):4307. doi: 10.3390/ijms22094307. Int J Mol Sci. 2021. PMID: 33919163 Free PMC article. Review.
-
Spatial intratumoral heterogeneity and temporal clonal evolution in esophageal squamous cell carcinoma.Nat Genet. 2016 Dec;48(12):1500-1507. doi: 10.1038/ng.3683. Epub 2016 Oct 17. Nat Genet. 2016. PMID: 27749841 Free PMC article.
-
Sphingosine and FTY720 modulate pacemaking activity in interstitial cells of Cajal from mouse small intestine.Mol Cells. 2013 Sep;36(3):235-44. doi: 10.1007/s10059-013-0091-0. Epub 2013 Aug 2. Mol Cells. 2013. PMID: 23912597 Free PMC article.
-
Ion Channels as Therapeutic Targets in High Grade Gliomas.Cancers (Basel). 2020 Oct 21;12(10):3068. doi: 10.3390/cancers12103068. Cancers (Basel). 2020. PMID: 33096667 Free PMC article. Review.
-
Suppression of 14-3-3γ-mediated surface expression of ANO1 inhibits cancer progression of glioblastoma cells.Sci Rep. 2016 May 23;6:26413. doi: 10.1038/srep26413. Sci Rep. 2016. PMID: 27212225 Free PMC article.
References
-
- Jonkers J, Berns A. Oncogene addiction: Sometimes a temporary slavery. Cancer Cell. 2004;6(6):535–538. - PubMed
-
- Kashyap MK, et al. Genomewide mRNA profiling of esophageal squamous cell carcinoma for identification of cancer biomarkers. Cancer Biol Ther. 2009;8(1):36–46. - PubMed
-
- Carles A, et al. Head and neck squamous cell carcinoma transcriptome analysis by comprehensive validated differential display. Oncogene. 2006;25(12):1821–1831. - PubMed
Publication types
MeSH terms
Substances
Grants and funding
LinkOut - more resources
Full Text Sources
Other Literature Sources
Medical
Research Materials
Miscellaneous
